In this experiment the main aim of trawling was to identify the fish species for the analysis of the acoustic survey data. As stated already earlier (see chapter 4.1) this was only possible to a limited extent. On the one hand the selectivity of the trawls prevented the catch of small fishes (<10 cm) and on the other the catches were biased towards fishes of AG I. Perch and whitefish of the AG II and elder costituting the bulk of the catches of the commercial fishery were underepresented in the trawl hauls.
The echo sounder results are given in measurements of the target strength (TS) of fish in decibels. This value largely depends on the size and shape of the swim bladder of the fish which is the main reflective surface (Foote 1980). The target strength will therefore vary between species and also with the tilt of the fish body resp. the angel of the swim bladder to the sound beam. Behaviour therefore influences target strength. Fish near the surface e.g. that dive as the echosounding boat approaches will present a smaller scattering cross section in the horizontal plane and so will appear as smaller fish. For the conversion of decibels into centimeters, Bagenal et al. (1982) and Lindem (1984) in their work on small sized fish found the formula TS (dB)=20 log L(cm) - 68. In Lake Constance where most of the pelagic fish is bigger whitefish another target strength/length relation has to be adopted. For the pelagic community in this lake it is suggested to use TS (dB) = 20 log L(cm) - 67.
Length-frequency distributions from the trawl data usually show peaks at 15 – 17 cm and near 29 cm which correspond mainly to catches of perch and whitefish. However, in the final analysis of all trawl hauls only a few could be found where the peaks are clearly separated from each other and represent to a very high degree only one species per peak. This is the case in hauls 4,5 and 20 which were all made over the deep parts of the lake. In addition to that there are also synchronous hydroacoustic surveys of the same areas. These hauls are therefore especially valuable for an identification of measured target strengths.
In Fig. 2a and 2b both target strength and length of fishes are drawn to the same scale so that every length value matches the corresponding target strength. In this kind of display characteristic conformities and deviations of both frequency distributions can be observed. One reason for the later is certainly that the target strength distribution integrates all recordings from 5 m down to 15 m wheras the fishes are taken from the densest fish concentrations in 9 – 12 m resp. 14 – 17 m depth. Differences in frequency should therefore not be overestimated. The same applies to the fact that no coincidence can be found between both diagrams in the small-size-fish range from 0 to 10 cm length. This can partly be explained by the selectivity of the trawl, partly by the fact that smaller smaller sized fish for evident biological reasons inhabit other water layers than the bulk of the big sized and partly also by the mentioned target strength displacement of diving fish. A satisfying coincidence is to be seen in the range of the medium sized fish (10 – 25 cm). As the length frequency distribution reveals these are to a very high degree perch and there is therefore some allowance to identity the target strength recordings in this dB range as perch. The next peak in the length-frequency distribution is pure whitefish. The corresponding peak in the target-strength distribution is shifted ldB to the right. However, in this part of the lake only whitefish occur in this size range as can be seen from the trawl hauls and also from recent records of the commercial fishery. It was therefore assumed that all target strength records over -40 dB originated from whitefish and this was taken as base of the total population estimate, irrespective of the possible reasons for the target strength shift.

Figure 5 Echogram from transect 1, Langenargen - Arbon. Distribution of pelagic fish over deep water. Depth = 150 meter. Fish density 606 fish/ha. (Fish>30 cm = 87 fish/ha)

Figure 6 Echogram from shore area Bregenzer Bucht. Example of contagious distribution of perch. Fish density 8 000 fish/ha. (Fish > 30 cm = 140 fish/ha)

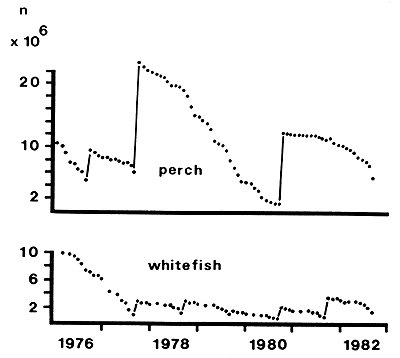
Figure 7 Standing stock of at least two-summers-old whitefish and perch in Lake Constance (Upper Lake) 1976 – 1982. Recruitment on Oct. 1. From Hartmann 1983a, modified
Nevertheless, in the shallower parts of the lake in the East and in the nearshore zone trawl catches brought a mix of whitefish, roach, dace, bream, pileperch and trout of a similar length range and it was not possible to distinguish them by echo soundings. With regards to these difficulties these areas were therefore left out of the population assessment.
The main goal of this exercise, identification of targets as single fish species and subsequent assessment of their number, was attained at least in the deeper parts of the lake where the pelagic was dominated by big whitefish and small perch. The comparison of target recordings and trawl catches from the shallow parts shows on the other hand the limitations of echosounding. In situations like this with a multispecies community of fish with about the same length the echosounder will not be able to discern among different species even if it can give the total biomass available. The investigation of the true relative species composition by trawl hauls on the contrary is biased by the selective porperties of the gear used. It seems feasible to overcome these frictions by use of a set of trawls of different meshsizes but the methodology for such “unselective” trawling still has to be developped and tested in inland waters.