![]()
![]()
![]()
Pool and weir passes and Borland-type locks are the only types of fish pass facilities currently in operation in Latin America. Data is available on the efficiency of the Cachoeira de Emas fish ladder in Brazil (Godoy, 1975) and the Salto Grande Borland-type lock (Delfino, Baigún and Quirós, 1986).
It was almost 5 m high from 1942 to 1966, but was remodelled in 1984 and currently operates with a height of 3 m (Godoy, 1985). At this level, the mean flow rate of the Mogi Guassu river is less than 100 m3/sec. Until 1977, actual flow rate at the fish entrance was 0.5 to 2.5 m3/sec. A flow of less than 0.5 m3/sec was not sufficient to attract the fish upstream (Castello, 1982). Flow velocity in the first pool varies between 1.2 and 3.6 m/sec, depending on the level of the river. The turbulence created at the foot of the ladder below the dam when the flow is between 2.3 and 3.6 m/sec discourages the fish from entering the system.
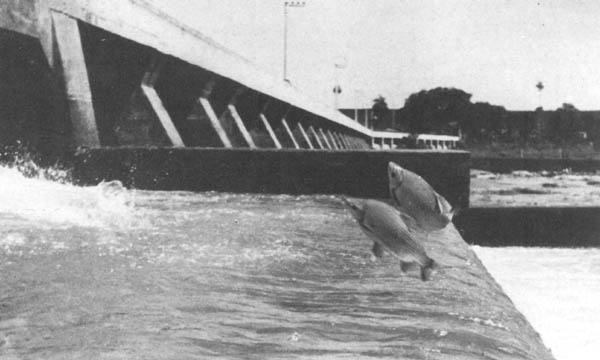
Figure 10 Mogi Guassu river, Cachoeira de Emas (Pirassununga), Sao Paolo State, Brazil. Fish ladder (height 5 m in 1959) in the Cachoeira de Emas dam (Emas Falls). Reproductive migration of “curimbatás” (Prochilodus scrofa Steindacher, 1881) on 26.10.59. The two “curimbatás” were leaping toward the penultimate step of the ladder. In order to surmount the last step the fish were required to clear a height of 2 m (Photo: M.P. de Godoy)
The pass is used mainly by major commercial species in their reproductive migrations to the headwaters of the Mogi Guassu (Figure 10). Godoy (1975) reports that among the species observed during 1961 were Prochilodus scrofa, Leporinus copelandii, Leporinus octofasciatus, Leporinus elongatus, Salminus maxillosus, Salminus hilarii, Triurobrycon lundii and Pimelodus clarias. On one occasion, between 80 and 100 fish/min (total length 30–70 cm, with maturing gonads) (Godoy, 1975) were observed. Fish counts undertaken between 1954 and 1963 showed mixed shoals of 100 000 fish ascending the river over a period of four or five days (Godoy, 1985).
The Salto Grande hydroelectric plant went into operation in 1979 and the fish lock system in 1984. At that time fish density was high in the downstream collection pools (Figure 6). Fish were attracted by the auxiliary water resulting from the difference in pressure in the turbine discharge area and in the adjacent collection pool. Between 1980 and 1985, the largest accumulations downstream of the dam occurred in late March or early April, coinciding with the rise of the river and, in September and October, during high water. Generally speaking, fish accumulations were noted during the period September - April, but not in winter. High fish densities for two or three days were followed by very low densities. The cycle was repeated every three or four days (Delfino, Baigún and Quirós, 1986). Periods of high density downstream was usually an indication of migrations to waters upstream of the reservoir. Species showing clear upstream migratory tendencies were Salminus maxillosus and Leporinus obtusidens (Delfino and Baigún, 1985). Sampling experiments carried out over three consecutive years showed that individuals of these species captured downstream of the dam were in better condition than those taken in the reservoir. The contrary occurred with respect to Prochilodus platensis.
Downstream aggregations take place in a 200–300 m area spanning the entire width of the river below the dam. The major species recorded were: Prochilodus platensis, Leporinus obtusidens, Salminus maxillosus, Pseudoplatystoma coruscans, Luciopimelodus pati and Serrasalmus sp. The presence of one migratory species is an indication that the others are there as well. On the other hand, it would appear that the different species move through the area independently of each other. Fish catches downstream were frequently unispecific (Delfino, Baigún and Quirós, 1986).
Shoals of Prochilodus platensis were observed some 1 500 m downstream swimming, in proximity of the river bank, toward the dam. With the weir closed, they approached the dam from some 300–400 m downstream following the water velocity lines of the turbine discharge (Figure 11). Selminus, Leporinus and Prochilodus were seen to approach the dam swimming in the least turbulent areas, close to the calm area in front of the weirs. This would be the main route toward the collection pool. The other approaches are the areas close to the river banks. The fish accumulate in the slack close to the river banks and in proximity of the dam (Figure 11). Shoals of 200–300 specimens of Prochilodus can be seen moving from this area, leaping over the spur dike and the line where calm and turbulent waters meet. They later approach the dam skirting the spur dike wall (Figure 12). Prochilodus also accumulate in the slack water below the weirs.
Pseudoplatystoma coruscans which follows the contours of the river bottom (Poddubnyi, Espinach Ros and Oldani, 1981) appears to move toward the turbine discharges along the river bottom. Specimens of Salminus are often caught some 20 or 30 m downstream of these discharges (Figure 11).
Specimens of Prochilodus and Leporinus are usually found swimming close to the dam wall, in the opposite direction to the many, small secondary currents produced there (Delfino, Baigún and Quirós, 1986).
Fish which follow the current lines in the vicinity of the calm water area below the weir move toward the accumulation pools (Figure 11) and congregate in front of them. Some enter, but the majority travel to the turbine discharge zone. Once in the pools, the fish congregate in front of the sluice-gate leading to the lower chamber. Some continue to swim in the opposite direction, skirting the walls, guided by secondary currents, which are produced by interaction between the water discharged from the lock and the auxiliary, attraction water from the turbine area. Prochilodus, Leporinus and Salminus have been observed in the collection pools (Figure 13).
The fish, particularly Prochilodus, enter the lock through the lower sluice-gate (C2, Figure 9) “all together or not at all”, i.e., when the fish at the head of the shoal enters, all the others follow. They usually remain in front of the sluice-gate for long periods before entering. This could be due to the fact that there is no lighting in the lock system and there is a sudden reduction in light intensity in C2 (Figure 13).
Species passing through the system in 1984–85 were: Prochilodus platensis, Leporinus obtusidens, Salminus maxillosus and one specimen of Pellona flavipinnis (Delfino, Baigún and Quirós, 1986). Staff have reported the passage of Pseudoplatystoma coruscans. Fish can be seen leaping out of the water as the locks fill (Figure 14) and when the locks are full and the upper sluice-gate (Cl, Figure 9) is fully open, they leap out of the water as they move, all together, toward the reservoir. A large number of specimens of small-sized species have also been reported at the lock exits upstream. They skirt the walls as they leave the exits avoiding the turbulent areas. A significant number of these small fish appear not to leave the top chamber and probably remain in the lock for several cycles. It is not known for certain whether they enter the lock with the filling water from the reservoir. Many are also found in the collection pools downstream (Delfino, Baigún and Quirós, 1986).
In the attraction stage of the cycle, flow velocities in the vicinity of the lower chamber (C2, Figure 9) may vary between 0.1 m/sec and 1.8 m/sec, depending basically on the degree of aperture of the top sluice-gate and the level of the river downstream. Since the auxiliary water flow varies depending on the number of turbines in operation, only a lower limit can be set for water velocity at the entrances to the collection pools. With a flow of 0.9 m /sec in the lock and a downstream water level of 5.5 m, water velocity at the entrance to the pools exceeds 0.6 m/sec (Delfino, Baigún and Quirós, 1986).
Fish movements
Figure 11 Fish approaching the Salto Grande dam (no fish pass). Allis shad: Prochilodus platensis; dolfinfish: Salminus maxillosus; surubí*: Pseudoplatystoma coruscans; bogue: Leporinus obtusidens (Delfino, Baigún and Quirós, 1986)
Figure 12 Fish resting place on the Uruguayan side. The fish leap over the dike spur and then, skirting the dike wall, move toward the bottom discharges and the dam wall (Delfino, Baigún and Quirós, 1986)
Figure 13 Fish entering the collection pools. Most of them move toward the turbine discharge area (Delfino, Baigún and Quirós, 1986)
The behaviour of the fish as they approach the dam may be described as follows: (a) a large proportion do not enter the system because of the water velocity pattern downstream; (b) those entering the collection pools meet with secondary currents there and are discouraged from entering the lower chamber by the sudden change in light conditions. Small fish have been observed in all stages of the lock cycle, but only in less than 5% of cases do shoals of 100 to 200 individuals of the larger sized species pass through the system. This is probably due to the drawbacks mentioned earlier and, to a lesser extent, to lack of experience on the part of those operating the installation (Delfino, Baigún and Quirós, 1986).
When the recommended modifications (see Section 4.4) are completed, the installation will be able to deal more efficiently with stocks entering the collection pools. It is clear, however, that in the original design, insufficient attention was paid to the type of river in which the installation was to be built, the type of reservoir to be developed and plant and weir operation. The Salto Grande reservoir has a main channel and branch channels. The water remains in the reservoir 11 days per year on average and at the times when fish are accumulating downstream, less than 5 days (Quirós and Cuch, 1982). The fact that control capacity is inadequate is reflected in the way the fish pass installation operates.
In high water months (Figure 15), the flow into the reservoir (Qentr) is almost equal to weir and turbine discharges (Qexit). The linear regression between the mean monthly level of the river immediately downstream of the dam (L) and the mean monthly flow into the dam (Qentr) for the period 1982–86, was:
L = 5.38 + 5.26 × 10⁻⁴ × Qentr' n = 72, r = 0.99
with L in metres and Q in m/sec. The lock's upper operating limit is L = 9.20 m (Salto Grande Joint Technical Commission, 1983), which corresponds to an inflow of 7.280 m3/sec. This is only 6% above the historical mean maximum flow for the annual hydrological cycle (Figure 15). Lock operation is determined by another factor - weir opening - which depends on the water level downstream. The ratio: number of days per month when the weir is closed (DC) against water inflow (Qentr) is
with n = 64 and r = 0.97.
Predictions are that the locks will not be in operation for 9% of the time during the upstream migration period (March – April) and for 46% of the time during the second migratory period (September – October). Another limiting factor is reservoir level (Salto Grande Joint Technical Commission, 1983). Between 1982 and 1986, the reservoir did not operate for 44% and 62% of the time during the first and second migratory periods respectively. Between 1984 and 1986, it did not operate for 72 and 54% of the time during the first and second migratory periods respectively (Delfino, Baigún and Quirós, 1986).
An approximate calculation will give an idea of the difficulties involved in operating the Salto Grande Borland locks with the weir open. Each of the dam's 14 Kaplan turbines requires 600 m3/sec when fully loaded, and the weir is 357 m wide. Let us assume that the river is flowing at its historical mean for October, 6 900 m3/sec and the hydroelectric plants are operating at 50% of their maximum capacity. The downstream level predicted above is 9 m. Net mean depth in the vicinity of the weirs, downstream, is approximately 6 m and flow over the weir is 2 700 m3/sec. This gives us a mean minimum water velocity below the weir dissipators of 1.3 m/sec. This is the maximum estimated velocity at the fish entrances to the collection pools. Each of the four entrances is 1 m wide and the weir is 375 m wide. In any case, if some fish managed to find the entrances and were passed up to the reservoir, they would probably become trapped in the weir and would return downstream.
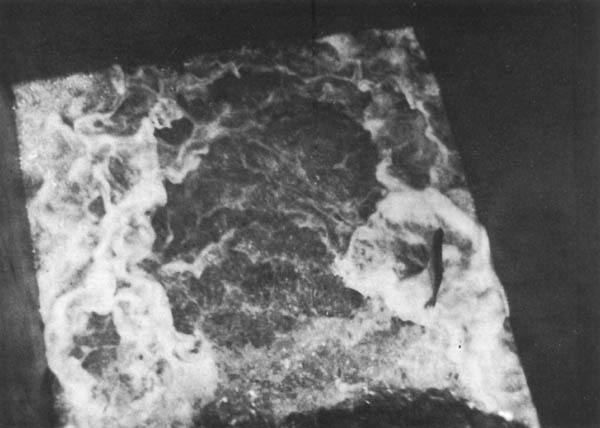
Figure 14 The lock filling. Prochilodus leaping out of the water (photo: R. Delfino)
Figure 15 Hydrological cycle of the Uruguay river. Mean monthly flows. Qlim: maximum flow rate into the reservoir above which the lock system cannot operate. Arrows point to the months in which upstream migrations take place in the Uruguay river (see explanation in text)
If turbine flows and weir operation could be adjusted to take these difficulties into account, the situation described above could improve slightly. Energy demand is greatest during the day, which is when Prochilodus, Salminus and possibly Leporinus migrate. It would be convenient to reduce flow over the weirs as much as possible during the day and discharge at night when Pseudoplatystoma and Luciopimelodus are moving. Overall efficiency of the system appears to be less important where these species are concerned (Delfino, Baigún and Quirós, 1986).
To sum up, the system's weaknesses, insofar as the fish are concerned, appear to be: the route they take to approach the dam to find the entrances to the collection pools and the way they interact with the lock system. In addition, there are design problems related to river flow and hydrological cycle.
![]()
![]()
![]()