![]()
![]()
Bayley, P.B., 1988. Accounting for effort when comparing tropical fisheries in lakes, river-floodplains and lagoons. Limnol. Oceanogr., 33(4, part 2): 963–972.
Bernacsek, G.M. and S. Lopes, 1984. Mozambique. Investigations into the fisheries and limnology of Cahora Bassa Reservoir seven years after dam closure. FAO/GCP/MOZ/006/SWE, Field Doc. 9. Rome: FAO, 145 pp.
Crul, R.C.M., 1992. DIFRA. Database on the inland fisheries resources of Africa. CIFA Occas. Pap., No. 17. Rome: FAO, 21 pp.
Fox, W.W., 1970. An exponential surplus yield model for optimizing exploited fish populations. Trans. Am. Fish. Soc., 99:80–88.
Hanson, J.M. and W.C. Legget, 1982. Empirical prediction of fish biomass and yield. Can. J. Fish. Aquat. Sci., 39(2): 257–263.
Henderson, H.F. and R.L. Welcomme, 1974. The relationship of yield to Morpho Edaphic Index and number of fishermen in African inland fisheries. Relation entre la production, l'indice Morpho-Edaphique et le nombre de pêcheurs des pêcheries des eaux continentales d'Afrique. CIFA Occas. Pap./Doc. Occas. CPCA, (1): 19 p.
Jackson, D.A., H.H. Harvey and K.M. Somers, 1990. Ratios in Aquatic Sciences: Statistical Shortcomings with Mean Depth and the morphoedaphic Index. Can. J. Fish. Aquat. Sci., 47: 1788–1795.
Kapetsky, J.M., 1984. Coastal lagoon fisheries around the world: some perspectives on fisheries yields, and other comparative fishery characteristics. In: J.M. Kapetsky and G. Lasserre (eds.), Management of Coastal Lagoon Fisheries. Stud. Rev. GFCM, 61(1):97–140.
Marshall, B.E., 1984. Towards predicting ecology and fish yields in African reservoirs from pre-impoundment physico-chemical data. CIFA Tech. Pap., (12): 36 pp. Rome: FAO.
Melack, J.M., 1976. Primary productivity and fish yields in tropical lakes. Trans. Am. Fish. Soc., 105:575–580.
Moyle, J.B., 1956. Relationships between the chemistry of Minnesota surface waters and wildlife management. J. Wildl. Manag., 20: 303–320.
Northcote, T.G. and P.A. Ryder, 1965. Indices of productivity in British Columbia lakes. J. Fish. Res. Board. Ca., 13: 515–540.
Oglesby, R.T., 1977. Relationships of fish yield to lake phytoplankton standing crop, production and morpho-edaphic factors. J. Fish. Res. Board Can., 34(12): 2271–2279.
Quiros, R., 1990. Predictors of Relative Biomass in Lakes and Reservoirs of Argentin a. Can. J. Fish. Aquat. Sci., 47: 928–939.
Rawson, D.S., 1952. Mean depth and fish production of large lakes. Ecology, 33:513–521.
Ryder, R.A., 1965. A method for estimating the potential fish production of north-temperate lakes. Trans. Am. Fish. Soc., 94: 214–218.
Schaefer, M.B., 1954. Some aspects of the dynamics of populations important to the management of commercial marine fisheries. Bull. Inter-Am. Trop. Tuna Comm., 1(2): 25–56.
Schlesinger, D.A. and H.A. Regier, 1982. Climatic and Morphoedaphic Indices of Fish Yields from Natural Waters. Trans. Am. Fish. Soc., 111: 141–150.
Toews, D.R. and J.S.Griffith, 1979. Empirical estimates of potential fish yield for the Lake Bangweulu system, Zambia, Central Africa. Trans. Am. Fish. Soc., 108: 241–252.
Vanden Bossche, J.-P. and G. Bernacsek, 1990a. Source book on the inland fishery resources of Africa. Vol I. CIFA Tech. Pap., 18/1: 411 pp.
Vanden Bossche, J.-P. and G. Bernacsek, 1990b. Source book on the inland fishery resources of Africa. Vol II. CIFA Tech. Pap., 18/2: 240 pp.
Vanden Bossche, J.-P. and G. Bernacsek, 1991. Source book on the inland fishery resources of Africa. Vol III. CIFA Tech. Pap. 18/3: 219 pp.
Weisberg, S., 1980. Applied linear regression. New York. Wiley & Sons,. 283 p.
Welcomme, R.L., 1972. The Inland Waters of Africa. CIFA Tech. Pap., (1): 117p.
Welcomme, R.L., 1974. Some general and theoretical considerations on the fish production of African rivers. CIFA Occas. Pap. (3): 26 p.
Welcomme, R.L., 1975. The fisheries ecology of African floodplains. CIFA Tech. Pap. 3: 51 p.
Welcomme, R.L., 1979. The fisheries ecology of floodplain rivers. London, Longman, 317 pp.
Welcomme, R.L., 1985. River fisheries. FAO Tech. Pap., 262: 330 pp.
Youngs, W.D. and D.G. Heimbuch, 1982. Another consideration of the Morphoedaphic Index. Trans. Am. Fish. Soc., 111: 151–153.
CATCH VS AREA
71 African lakes and reservoirs
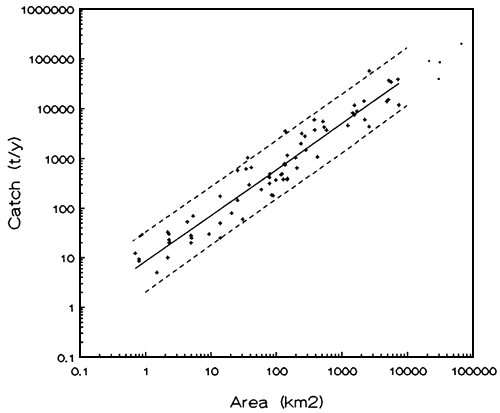
Figure 1. The relationship between surface area and total catch for 71 lakes and reservoirs (+). Lakes Victoria, Tanganyika, Malawi and Chad are plotted for comparison (.). (Broken lines are 95% confidence limits). Data from Table 3.
CATCH VS AREA
Subsets African lakes and reservoirs
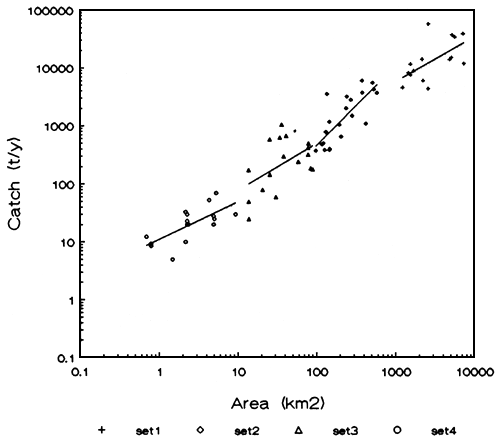
Figure 2. The relationships between surface area and total catch for subsets of the 71 lakes and reservoirs based on surface area.
| Subset 1 | - | surface area > 1000 km2 |
| Subset 2 | - | 100 km2 < surface area < 1000 km2 |
| Subset 3 | - | 10 km2 < surface area < 100 km2 |
| Subset 4 | - | surface area < 10 km2 |
| Data from Table 3. | ||
CATCH VS EFFORT
58 African lakes and reservoirs
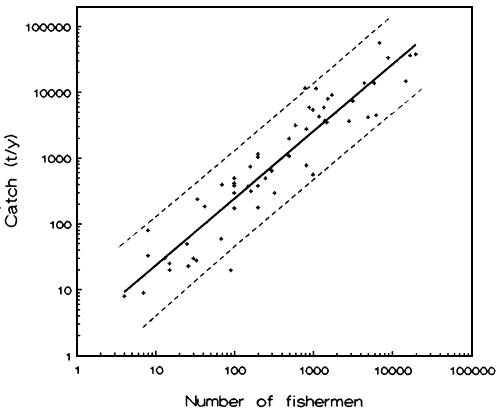
Figure 3. The relationship between number of fishermen and total catch for 58 lakes and reservoirs (Broken lines are 95% confidence limits). Data from Table 3.
CATCH VS DRAINAGE AREA
15 African rivers
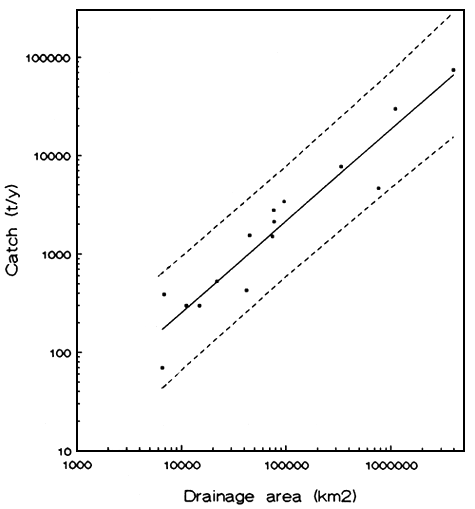
Figure 4. The relationship between drainage area (km2) and total catch (t/y) for 15 African rivers (Broken lines are 95% confidence limits). Data from Table 6.
CATCH VS LENGTH
19 African rivers
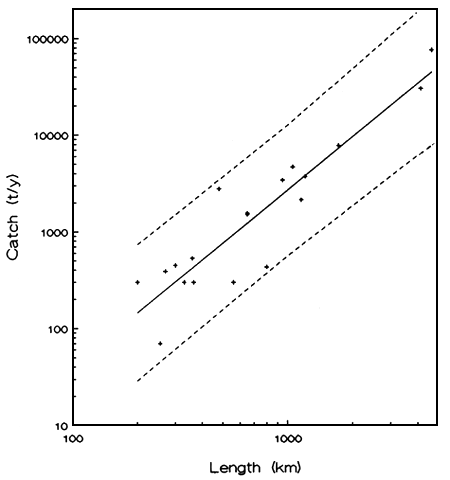
Figure 5. The relationship between length (km) and total catch (t/y) for 19 African rivers (Broken lines are 95% confidence limits). Data from Table 6.
CATCH VS FLOODPLAIN AREA
14 African floodplains
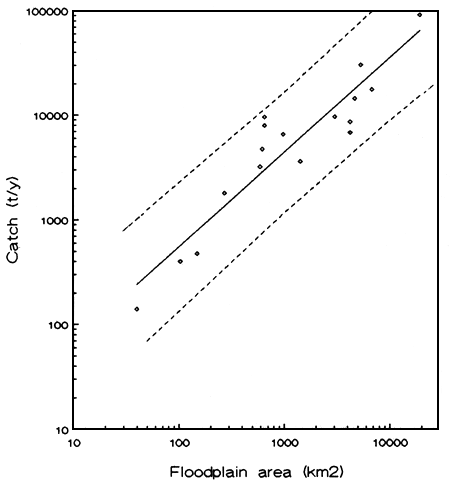
Figure 6. The relationship between surface area (km2) and total catch (t/y) for 14 African floodplains (Broken lines are 95% confidence limits). Data from table 7.
Table 1. Existing models predicting potential fish production in African lakes and reservoirs
| YIELD MODEL (corr. coeff) | DATA SET | SOURCE |
| Catch (kg/ha) = 8.7489 MEI0.3813 (0.51) | 31 African lakes and reservoirs | Henderson & Welcomme 1974 |
| Catch per fisherman (t) = 0.7779 MEI 0.37775 (0.74) | 31 African lakes and reservoirs | Henderson & Welcomme 1974 |
| Catch (kg/ha) = 14.3136 MEI 0.4681 (0.69) | 17 African lakes and reservoirs | Henderson & Welcomme 1974 |
| Log Y (kg/ha/)=0.113 GP (gO2/m2/day) + 0.91 (0.75) | 8 African lakes | Melack 1976 |
| Log Y (kg/ha) = 1.4071 + 0.3697 log MEI - 0.00004565 Area (0.81) 1 | 17 African lakes and reservoirs | Toews and Griffith 1979 |
| Log. Yield (t) = 0.76 log. Area + 3.57 (0.86) | 17 African lakes and reservoirs | Marshall 1984 |
| Yield (kg/ha) = 7.889 MEI 0.59 (0.73) | 11 African lakes | Marshall 1984 |
| Yield (kg/ha) = 23.281 MEI 0.447 (0.85) | 11 African reservoirs | Marshall 1984 |
| Yield (kg/ha) = 19.996 + 32.038 DL/Mean Depth (0.97) 2 | 5 large African reservoirs | Marshall 1984 |
| Yield (kg/ha) = 5.4250 MEI 0.5825 (0.78) | 11 African lakes | Bernacsek and Lopes 1984 |
| Yield (kg/ha) = 23.3956 MEI 0.4215 (0.76) | 8 African reservoirs | Bernacsek and Lopes 1984 |
| Log. (Yield+1) (kg/ha) = 7.30 i0.5 - 2.37 i - 1.08 3 (R2=0.75) | 24 African lakes | Bailey 1988 |
| Log. (Yield+1) (kg/ha) = 5.75 i0.5 - 1.64 i - 0.59 3 (R2=0.80) | 7 African reservoirs | Bailey 1988 |
| Log. (Yield+1) (kg/ha) = 7.30 i0.5 - 2.37 i - 1.08 3 (R2=0.75) | 31 African lakes and reservoirs | Bailey 1988 |
Notes:
1 multiple corr.coeff.
2 DL= Shoreline development
3 i = EFFORT (in number of fishermen)
Table 2. List of African lakes and reservoirs used for models listed in Table 1.
((u) indicates an updated catch figure compared with figure given by Henderson and Welcomme 1974)
(l=lakes, r=reservoirs)
| NAME | Henderson & Welcomme 1974 data sets | Melack 1976 | Toews and Griffith 1979 | Bernacsek & Lopes 1984 data sets | Marshall 1984 data sets | Bailey 1988 data set | |||||
| LAKE/RESERVOIR | 31 l/r | 17 l/r | 8 l/r | 17 l/r | 8 reserv. | 11 lakes | 17 l/r | 11 l | 11 r | 5r | 31 l/r |
| 1 Albert | X | X | X (u) | X | X | X | X | X | |||
| 2 Ayame (R) | X | X | X | X (u) | X | X (u) | X | ||||
| 3 Bangweulu lakes | X | X | X (u) | X | X | X (u) | |||||
| 4 Baringo | X | X | X | X | X | X | X | ||||
| 5 Chad | X | X | X (u) | X | |||||||
| 6 Chilwa | X | X | |||||||||
| 7 Chiuta | X | X | X | X | X | X | X | ||||
| 8 Edward | X | X | X | X (u) | X | X | X | ||||
| 9 George | X | X | X (u) | X | X | X | X | X | |||
| 10 Guiers | X | X | X | X | X | X | X | ||||
| 11 Kainji (R) | X | X | X (u) | X | X (u) | X | X (u) | X (u) | X | ||
| 12 Kariba (R) | X | X | X | X | |||||||
| 13 Kitangiri | X | X | X | ||||||||
| 14 Kivu | X | X | |||||||||
| 15 Kyoga | X | X | X | X | X | X | |||||
| 16 Maji Ndombe | X | X | |||||||||
| 17 Malawi | X | X | |||||||||
| 18 Malombe | X | X | X | X | X | X | X | ||||
| 19 Mwadigusha (R) | X | X | X | X (u) | X | X | X | ||||
| 20 Mweru | X | X | X | X (u) | X | X | X | ||||
| 21 Mweru Wa Ntipa | X | X | |||||||||
| 22 Nasser (R) | X | X | X | X | X (u) | X | |||||
| 23 Nzilo (R) | X | X | X | X | X | X | X | X | |||
| 24 Rukwa | X | X | |||||||||
| 25 Tana | X | X | |||||||||
| 26 Tanganyika | X | X (u) | X | ||||||||
| 27 Tumba | X | X | |||||||||
| 28 Turkana (Rudolf) | X | X | |||||||||
| 29 Upemba | X | X | X | X (u) | X | X | X | ||||
| 30 Victoria | X | XX (u) | X | ||||||||
| 31 Volta (R) | X | X | X (u) | X | X (u) | X | X | X | X | ||
| 32 Mcilwaine (R) | X | X | |||||||||
| 33 Nyumba ya M.(R) | X | X | |||||||||
| 34 Sennar (R) | X | ||||||||||
| 35 Jebel Aulia (R) | X | ||||||||||
| 36 Kossou (R) | X | X | |||||||||
| 37 Ihema | |||||||||||
| 38 Rugwero | |||||||||||
| 39 Naivasha | |||||||||||
| 40 Ziway | |||||||||||
| 41 Pool Malebo | |||||||||||
| 42 Mantasoa (R) | |||||||||||
| 43 Kyle (R) | |||||||||||
| 44 Massingir (R) | |||||||||||
| 45 Cahora Bassa (R) | |||||||||||
Table 3. List of 71 African lakes (1–46) and reservoirs (47–71) used for updating the models
| NO NAME | AREA (km2) | CATCH (t/y) | PERIOD (yrs) | YIELD (kg/ha) | #FISHERMEN (number) | #F/KM2 | Conduct. (μS/cm) | ALT (m) | LAT (°) | VOLUME (km2) | |
| 1 Turkana | 7570 | 11737 | 76–86 | 15.5 | 800 | 0.1 | 3300 | 1136 | 2 | 224.83 | |
| 2 Albert | 5270 | 15000 | 85 mr 1 | 28.5 | 15000 | 2.8 | 700 | 618 | 2 | 131.75 | |
| 3 Mweru | 5000 | 13860 | 75 mr | 27.7 | 6000 | 1.2 | 80 | 930 | 9 | 32.50 | |
| 4 Kyoga | 2700 | 57000 | 88 mr | 211.1 | 7000 | 2.6 | 128 | 1033 | 1 | 6.21 | |
| 5 Rukwa | 2300 | 5990 | 86 mr | 26.0 | 1381 | 0.6 | - | 500 | 8 | - | |
| 6 Edward | 2240 | 14000 | 82 mr | 62.5 | 4500 | 2.0 | 900 | 914 | 0 | 76.16 | |
| 7 Chilwa | 1750 | 9220 | 62–82 | 52.7 | 1740 | 1.0 | 1500 | 654 | 15 | 3.50 | |
| 8 Mweru Wa Nt. | 1600 | 11560 | 75–82 | 72.3 | 1100 | 0.7 | 600 | 928 | 9 | 4.80 | |
| 9 Pool Mal. | 550 | 4250 | 84 mr | 77.3 | 5000 | 9.1 | 32 | 500 | 4 | 1.65 | |
| 10 Upemba | 530 | 5500 | 75–81 | 103.8 | 1000 | 1.9 | 200 | 575 | 8 | 0.90 | |
| 11 Alaotra | 600 | 3700 | 60–80 | 61.7 | 2872 | 4.8 | 165 | 750 | 17 | - | |
| 12 Ziway | 434 | 1085 | 79–83 | 25.0 | 500 | 1.2 | 400 | 1636 | 8 | 1.09 | |
| 13 Malombe | 390 | 5983 | 71–82 | 153.4 | 900 | 2.3 | 225 | 470 | 14 | 1.56 | |
| 14 George | 250 | 3171 | 50–88 | 126.8 | 600 | 2.4 | 223 | 914 | 0 | 0.60 | |
| 15 Wamala | 244 | 2000 | 83 mr | 82.0 | 500 | 2.0 | - | - | 0 | - | |
| 16 Guiers | 210 | 650 | 88 mr | 31.0 | 300 | 1.4 | 73 | 1 | 16 | 0.27 | |
| 17 Chiuta | 200 | 1045 | 71–82 | 52.3 | 200 | 1.0 | 150 | 620 | 14 | 1.00 | |
| 18 Naivasha | 150 | 385 | 78–86 | 25.7 | 200 | 1.3 | 330 | 1890 | 0 | 0.98 | |
| 19 Kinkony | 139 | 750 | 60–75 | 54.0 | 160 | 1.2 | 3379 | - | 6 | 0.49 | |
| 20 Baringo | 130 | 385 | 64–86 | 29.6 | 100 | 0.8 | 416 | 965 | 0 | 0.73 | |
| 21 Rugwero | 100 | 375 | 68–75 | 37.5 | 150 | 1.5 | 157 | 1350 | 2 | 0.21 | |
| 22 Ihema | 86 | 186 | 83 mr | 21.6 | 42 | 0.5 | 107 | 1291 | 2 | 0.43 | |
| 23 Mujunju | 80 | 421 | 69,75 | 52.6 | 100 | 1.3 | 98 | 1280 | 2 | 0.47 | |
| 24 Lushiwashi | 80 | 319 | 78–82 | 39.9 | 163 | 2.0 | - | - | 13 | - | |
| 25 Chisi | 60 | 240 | 54–72 | 40.0 | 34 | 0.6 | 115 | - | 9 | 0.15 | |
| 26 Kijanbalola | 42 | 670 | 62–66 | 159.5 | - | - | - | 1126 | 0 | - | |
| 27 Mugesera | 39 | 300 | 75 mr | 76.9 | 325 | 8.3 | 236 | 1360 | 2 | 0.12 | |
| 28 Jipe | 39 | 300 | 82–86 | 76.9 | 100 | 2.6 | 618 | 700 | 3 | - | |
| 29 Kachira | 37 | 1043 | 60–66 | 281.9 | - | - | - | 1230 | 0 | - | |
| 30 Itasy | 35 | 569 | 84 mr | 162.6 | 1000 | 28.6 | - | 255 | 19 | - | |
| 31 Nakivali | 26 | 581 | 61–66 | 223.5 | - | - | - | 1230 | 0 | - | |
| 32 Oubeira | 21 | 80 | 74,81 | 38.1 | 8 | 0.4 | - | 1 | 36 | - | |
| 33 Nasho | 14 | 50 | 75 mr | 35.7 | 25 | 1.8 | 105 | - | 2 | 0.06 | |
| 34 Sake | 14 | 175 | 73–75 | 125.0 | 100 | 7.1 | 182 | - | 2 | 0.06 | |
| 35 Rwampanga | 10 | 30 | 75 mr | 31.6 | 30 | 3.2 | 108 | - | 2 | 0.05 | |
| 36 Birira | 5 | 70 | 75 mr | 129.6 | - | - | 157 | - | 2 | 0.03 | |
| 37 Madarounja | 5 | 20 | 61 mr | 40.0 | 90 | 18.0 | - | 353 | 13 | - | |
| 38 Mulehe | 5 | 28 | 69 mr | 56.0 | 33 | 6.6 | 260 | 1750 | 1 | - | |
| 39 Nyamisungire | 4 | 53 | 69 mr | 120.5 | - | - | 892 | 975 | 0 | - | |
| 40 Kirimbi | 2 | 20 | 73 mr | 83.3 | 15 | 6.3 | 204 | - | 2 | 0.01 | |
| 41 Gaharwa | 2 | 23 | 68,73,75 | 100.0 | 26 | 11.3 | 192 | - | 2 | 0.00 | |
| 42 Gashanga | 2 | 30 | 73,75 | 130.4 | 13 | 5.7 | 134 | - | 2 | 0.01 | |
| 43 Mirayi | 2 | 20 | 75 mr | 87.0 | - | - | 144 | - | 2 | 0.01 | |
| 44 Kidogo | 2 | 33 | 75 mr | 150.0 | 8 | 3.6 | 129 | - | 2 | 0.01 | |
| 45 Murago | 2 | 10 | 75 mr | 45.5 | - | - | 141 | - | 2 | 0.01 | |
| 46 Cufada | 2 | 5 | 82 mr | 33.3 | - | - | - | - | 11 | - | |
| 47 Volta | 7394 | 38492 | 70–79 | 52.1 | 20000 | 2.7 | 65 | 85 | 8 | 140.49 | |
| 48 Nasser | 5811 | 33933 | 81 mr | 58.4 | 9000 | 1.5 | 220 | 183 | 16 | 146.44 | |
| 49 Kariba | 5364 | 36749 | 88 mr | 68.5 | 17000 | 3.2 | 72 | 485 | 17 | 156.63 | |
| 50 Cahora Bassa | 2665 | 4343 | 82 mr | 16.3 | 1200 | 0.5 | 117 | 326 | 16 | 55.75 | |
| 51 Kossou | 1600 | 7500 | 80 mr | 46.9 | 3200 | 2.0 | 80 | 204 | 7 | 22.88 | |
| 52 Jebel Aulia | 1500 | 8108 | 75,82 | 54.1 | 1550 | 1.0 | 220 | 377 | 15 | 3.45 | |
| 53 Kainji | 1270 | 4579 | 74.78 | 36.1 | 6320 | 5.0 | 55 | 142 | 10 | 13.97 | |
| 54 Mwadingusha | 393 | 3728 | 82–83 | 94.9 | 1410 | 3.6 | 217 | 1100 | 11 | 1.02 | |
| 55 Roseires | 290 | 1480 | 75,76,82 | 51.0 | - | - | - | - | 11 | 2.90 | |
| 56 Nzilo | 280 | 2800 | 57,60,61 | 100.0 | 830 | 3.0 | 400 | 1246 | 10 | 2.32 | |
| 57 Massingir | 151 | 400 | 81 mr | 26.5 | 70 | 0.5 | 238 | 109 | 24 | 2.82 | |
| 58 Sennar | 150 | 1166 | 75,82 | 77.7 | 200 | 1.3 | 265 | 422 | 13 | 1.04 | |
| 59 Nyumba Ya Mungu | 140 | 3540 | 73–87 | 252.9 | 1500 | 10.7 | 854 | 663 | 3 | 0.84 | |
| 60 Ayame | 135 | 785 | 66–79 | 58.1 | 826 | 6.1 | 100 | 91 | 5 | 1.35 | |
| 61 Khashm El G. | 125 | 500 | 75 mr | 40.0 | 100 | 0.8 | - | - | 14 | 0.85 | |
| 62 Masinga | 120 | 480 | 85 mr | 40.0 | - | - | - | - | 0 | 1.56 | |
| 63 Kyle | 91 | 180 | 80 mr | 19.8 | 200 | 2.2 | 52 | 1035 | 20 | 1.43 | |
| 64 Robertson | 81 | 500 | 76,84 | 61.7 | 250 | 3.1 | - | 1350 | 17 | 0.49 | |
| 65 Tsiazompaniry | 31 | 60 | 75 mr | 19.4 | 68 | 2.2 | - | 1490 | 19 | - | |
| 66 Mc Ilwaine | 26 | 145 | 72–78 | 55.8 | - | - | 155 | 1364 | 17 | 0.25 | |
| 67 Mantasoa | 14 | 25 | 75 mr | 17.9 | 7 | 0.5 | 22 | 1385 | 19 | 0.07 | |
| 68 Ngwazi | 5 | 25 | 72–78 | 49.0 | 15 | 2.9 | - | - | 8 | - | |
| 69 IITA | 1 | 9 | 75–79 | 112.5 | - | - | 26 | 20 | 7 | 0.00 | |
| 70 Kerenge | 1 | 10 | 54–63 | 127.5 | - | - | 319 | - | 5 | - | |
| 71 Malya | 1 | 8 | 77,78 | 114.3 | 4 | 5.7 | - | - | 2 | - | |
| V Victoria | 68800 | 200000 | 87 mr | 29.1 | |||||||
| T Tanganyika | 32000 | 85000 | 89 mr | 26.6 | |||||||
| M Malawi | 30800 | 39400 | 70–86 | 12.8 | |||||||
| C Chad | 22000 | 90000 | 70 | 50.0 | |||||||
1 mr = most recent available catch figure
Table 4. New and updated models predicting potential fish yields of African waters
| YIELD MODEL (coeff.of Determination) | DATA SET | SOURCE |
| CATCH VS AREA EQUATIONS LAKES AND RESERVOIRS | ||
| Catch = 8.32 Area0.92 (R2=0.93) | (1) - 71 African lakes and reservoirs | SIFRA 1990, 1991 |
| Catch = 8.93 Area0.92 (R2=0.92) | (1A) - 46 African lakes | SIFRA 1990, 1991 |
| Catch = 7.09 Area0.94 (R2=0.94) | (1B) - 25 African reservoirs | SIFRA 1990, 1991 |
| CATCH VS AREA EQUATIONS SUBSETS LAKES AND RESERVOIRS (based on surface area) | ||
| Catch = 28.58 Area0.77 (R2=0.36) | (s1) - 15 African lakes and reservoirs (A>1000 km2) | SIFRA 1990, 1991 |
| Catch = 0.86 Area1.36 (R2=0.62) | (s2) - 22 African lakes and reservoirs (100<A<1000 km2) | SIFRA 1990, 1991 |
| Catch = 7.10 Area0.94 (R2=0.37) | (s3) - 19 African lakes and reservoirs (10<A<100 km2) | SIFRA 1990, 1991 |
| Catch = 9.88 Area0.79 (R2=0.57) | (s4) - 15 African lakes and reservoirs (A<10 km2) | SIFRA 1990, 1991 |
| CATCH VS NUMBER OF FISHERMEN EQUATIONS LAKES AND RESERVOIRS | ||
| Catch = 2.26 Number of fishermen1.02 (R2=0.88) | (1) - 58 African lakes and reservoirs | SIFRA 1990, 1991 |
| Catch = 2.27 Number of fishermen1.03 (R2=0.84) | (1A) - 38 African lakes | SIFRA 1990, 1991 |
| Catch = 2.01 Number of fishermen1.02 (R2=0.94) | (1B) - 20 African reservoirs | SIFRA 1990, 1991 |
| CATCH VS DRAINAGE AREA AND LENGTH RIVERS | ||
| Catch (t) = 0.048 Drainage Area0.93 (R2=0.91) | 14 African rivers | SIFRA 1990/ Welcomme 1985 |
| Catch (t) = 0.01 Length1.81 (R2=0.85) | 19 African rivers | SIFRA 1990/ Welcomme 1985 |
| CATCH VS FLOODPLAIN AREA FLOODPLAINS | ||
| Catch (t) = 8.78 Floodplain Area 0.90 (R2=0.87) | 14 African floodplains | Welcomme 1985 |
Table 5 Confidence limits of a selected number of yields predicted by models on Catch vs Area and Catch vs Number of fishermen for African lakes and reservoirs.
| Catch vs Area model | ||||||
| Area (km2) | Predicted yield (t/y) | 95% Confidence Zone (t/y) | ||||
| 1 | 8 | 2 – | 33 | |||
| 10 | 70 | 18 – | 271 | |||
| 100 | 585 | 152 – | 2,253 | |||
| 1,000 | 4,908 | 1,264 – | 19,055 | |||
| 10,000 | 41,523 | 10,441 – | 165,214 | |||
| Catch vs Number of fishermen | ||||||
| Number of fishermen | Predicted yield (t/y) | 95% Confidence Zone (t/y) | ||||
| 10 | 23 | 4 – | 129 | |||
| 100 | 244 | 46 – | 1,303 | |||
| 1,000 | 2,536 | 475 – | 13,544 | |||
| 10,000 | 26,635 | 4,829 – | 146,825 | |||
Table 6. Data set on rivers
| # RIVER | COUNTRY | LENGTH (km) | DRAINAGE AREA (km2) | CATCH (t) | PERIOD (yrs) |
| 1 SABAKI | KENYA | 560 | 300 | 60 | |
| 2 UELE | ZAIRE | 1210 | 3720 | 61 | |
| 3 BENITO | EQ.GUIN. | 365 | 300 1 | 79 | |
| 4 OTI 2 | TOGO | 300 | 450 | 76 | |
| 5 EWASO NGIRO | KENYA | 200 | 15,022 | 300 3 | 65 |
| 6 PENDJARI 4 | BENIN | 330 | 11,226 | 300 | 62,68,69,76 |
| 7 TANA | KENYA | 800 | 42,217 | 433 | 85 |
| 8 WHITE VOLTA | BURK.FASSO | 255 | 6,602 | 70 | - |
| 19 RED VOLTA | BURK.FASSO | 270 | 6,871 | 390 | - |
| 10 MONO | BENIN, TOGO | 360 | 22,000 | 533 5 | 70 |
| 11 BLACK VOLTA | BURK.F. | 650 | 45,324 | 1560 | 77 |
| 12 SASSANDRA | COTE D'IV | 650 | 75,000 | 1518 6 | - |
| 13 GAMBIA | GAMBIA | 480 | 77,000 | 2781 7 | 77–81 |
| 14 COMOE | CdI, B.F. | 1160 | 78,000 | 2142 6 | - |
| 15 BANDAMA | COTE D'IV | 950 | 97,000 | 3408 6 | - |
| 16 KASAI | ZAIRE | 1735 | 342,116 | 7750 6 | - |
| 17 UBANGI/UI | ZAIRE, CAR | 1060 | 772,800 | 4670 8 | 61,75 |
| 18 NIGER | 7 COUNTRIES | 4183 | 1,125,000 | 30000 6 | |
| 19 ZAIRE 9 | ZAIRE | 4700 | 4,014,500 | 75000 6 |
Notes:
1 including all inland catches Eq.Guinea
2 Tributary of Volta River
3 including swamp
4 Pendjari River is name of Oti River in Benin
5 Catch in Benin only
6 Welcomme pers. comm.
7 Catch in Gambia only (total length Gambia River 1120 km)
8 Catch in Zaire and Centr. Afr. Rep.
9 rough estimate of catch, main river without tributaries (# 3, 17 and 18 tributaries of Zaire River
Table 7. Data set on floodplains
| # FLOODPLAIN | AREA (km2) | CATCH (t/y) | #FSMEN | YEAR | SOURCE |
| 1 Benue (Nigeria) | 3100 | 9570 | 5140 | 1969 | Welcomme 1985 |
| 2 Niger (Nigeria) | 4800 | 14340 | 4600 | Welcomme 1985 | |
| 3 Niger (Niger) | 630 | 4700 | 1314 | 1965 | Welcomme 1985 |
| 600 | 3200 | 3200 | 1982 | Welcomme 1985 | |
| 4 Niger (Mali) | 20000 | 90000 | 54112 | Welcomme 1985 | |
| 5 Niger (Benin) | 274 | 1805 | Welcomme (pers. commm.) | ||
| 6 Oueme | 1000 | 6500 | 29800 | 1957 | Welcomme 1985 |
| 7 Rufigi | 1450 | 3589 | 3000 | Welcomme 1985 | |
| 8 Shire | 665 | 9545 | 2445 | 1970 | Welcomme 1985 |
| 665 | 7890 | 3324 | 1975 | Welcomme 1985 | |
| 9 Yaeres | 7000 | 17500 | Welcomme 1985 | ||
| 10 Senegal | 5490 | 30000 | 10400 | Welcomme 1985 | |
| 11 Pendjari | 40 | 140 | 65 | Welcomme 1985 | |
| 12 Kafue | 4340 | 8554 | 1112 | 1963 | Welcomme 1985 |
| 4340 | 6747 | 670 | 1970 | Welcomme 1985 | |
| 13 Pongolo | 104 | 400 | Welcomme 1985 | ||
| 14 Massilli | 150 | 475 | Welcomme 1985 |

![]()
![]()