Dietary Diversity
This section of the FAO/WHO GIFT platform examines dietary diversity (a key component of diet quality) at the population-level, measured using the Minimum Dietary Diversity for Women (MDD-W) indicator.
MDD-W is a food group-based indicator that estimates the proportion of non-pregnant women aged 15-49 years who consumed at least five out of ten defined food groups over the previous 24 hours, signalling better micronutrient intake. MDD-W has been validated as a proxy indicator for a minimally acceptable level of dietary adequacy for 11 micronutrients. Additional information on dietary diversity and MDD-W can be found at: https://www.fao.org/nutrition/assessment/tools/minimum-dietary-diversity-women/en/
MDD-W-related statistics are presented in three tabs (sub-sections):
1 - Minimum Dietary Diversity for Women (MDD-W)
2 - Food Group Diversity Score (FGDS)
3 - Individual food group consumption
Further information on each sub-section is provided below. The MDD-W indicator has, at present, only been validated for non-pregnant women of reproductive age (15 to 49 years old). Therefore, results are presented only for this group, while all other subjects are filtered out of the MDD-W related statistics.
In surveys with multiple days of dietary intake data, the MDD-W related statistics are computed using data from the first day only.
To ensure interpretability, a minimum sample size of 100 eligible women is applied when calculating the statistics. If after applying filters the eligible sample falls below this threshold, the results are not displayed. The minimum sample size requirement follows the sample size used in the original MDD-W validation study1.
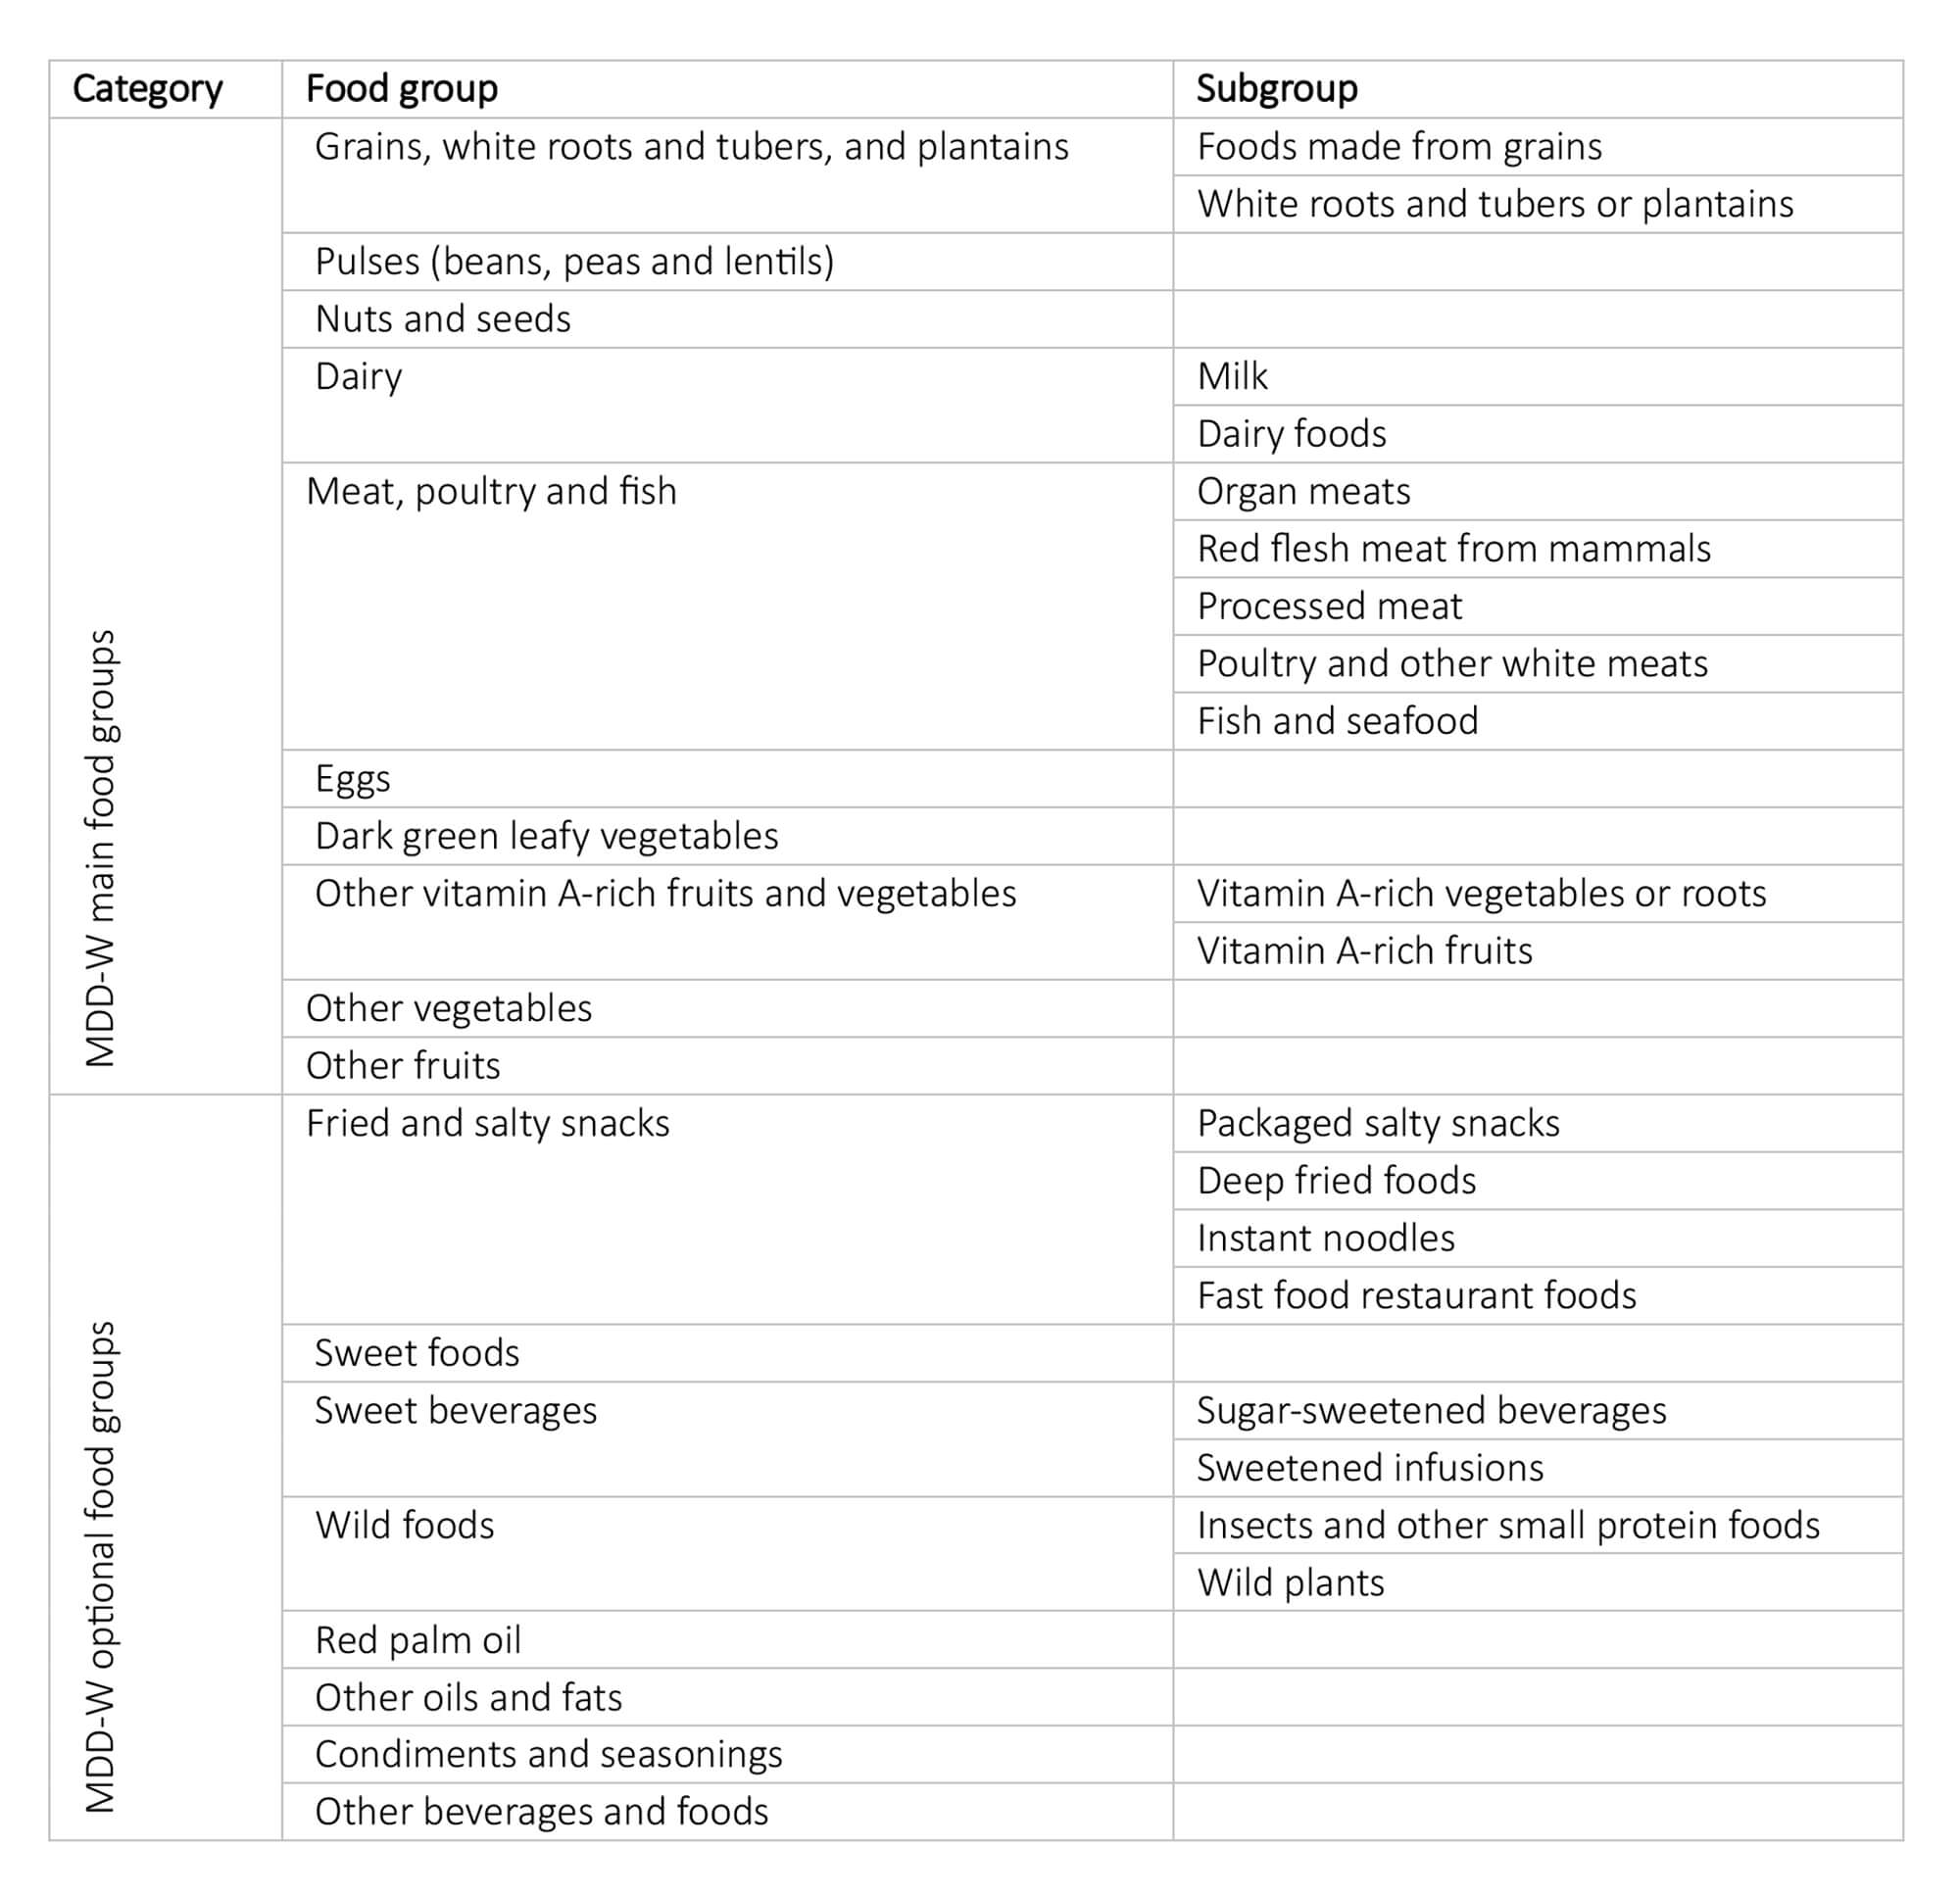
The MDD-W-related statistics are based on the food groups and subgroups outlined in Table 1. When assessing consumption of MDD-W main food groups, a minimum intake threshold of 15g per day is applied after aggregating all items belonging to the same food group (e.g., an intake of 5g/day of almonds and 5g/day walnuts, that is 10g/day of “nuts and seeds”, does not count as “nuts and seeds” being consumed). However, there is no minimum consumption threshold for the MDD-W optional food groups.
1 Women's Dietary Diversity Project (WDDP) Study Group, Development of a Dichotomous Indicator for Population-Level Assessment of Dietary Diversity in Women of Reproductive Age, Current Developments in Nutrition, Volume 1, Issue 12, December 2017, cdn.117.001701, https://doi.org/10.3945/cdn.117.001701
To determine a woman’s FGDS, one point is awarded for each of the ten MDD-W main food groups 2 consumed during the previous 24 hours. The FGDS therefore ranges from 0 (no food groups consumed) to 10 (all food groups consumed).
A histogram is used to visualize the distribution of the FGDS in the survey population, where bars represent the frequency of subjects achieving each score. Bars representing FGDS of 5 or more are displayed in green, while a bar for FGDS below 5 are shown in red.
2 The FGDS is calculated using the main food groups of MDD-W (table 1, column 2)
The percentage of women achieving MDD-W is calculated by determining the percentage of women in the survey population with a FGDS of 5 or more (see previous section).
The percentage of women not achieving MDD-W is calculated by determining the percentage of women in the survey population with a FGDS of less than 5.
The average FGDS is the mean FGDS among all eligible women in the survey. Additionally, the “average FGDS” of women achieving MDD-W is the mean FGDS calculated specifically for subjects who have achieved MDD-W (i.e., with a FGDS of 5 or more), displayed when hovering over the pie chart’s green portion. Likewise, the "average FGDS” of women not achieving MDD-W is the mean FGDS calculated specifically for subjects who did not reach MDD-W (i.e., FGDS of less than 5), displayed when hovering over the pie chart’s red portion.
This section provides statistics of the percentage of women consuming each food group and subgroup.
The bar charts present the percentage of women consuming the ten MDD-W main food groups (above) and the optional food groups (below). For some MDD-W main and optional food groups, it is possible to expand the display to show subgroups.
Each bar chart also displays numeric values representing the percentage of subjects consuming each specific food group and subgroup.
See Table 1 for more details on food groups and subgroups.