How to navigate the WaPOR portal
The FAO’s hand-in-hand (HiH) geospatial platform brings together, in one place, the geospatial data that is generated by the FAO and its partners on topics such as food security, crops and vegetation, livestock, trade and production, land, water, climate, fisheries, forestry, socio economic and demographics, COVID-19 among others. Whereas all this data was available on dispersed platforms before the initiative, now datasets can speak to each other by being overlaid and analysed together on the HiH platform, creating the possibility for more intersectional understanding of issues at hand.
The HiH geospatial platform hosts a range of smaller, more focused portals or databases, all with a similar anatomy as described further below.
WaPOR data can then, be found:
- On the wider and more comprehensive HiH geospatial platform containing all the FAO data
- On AQUASTAT’s geospatial database, AQUAMAPS that, in addition to WaPOR data, contains spatially-referenced data on water and agriculture, a big portion of which was generated by spatial modelling then calibrated and validated by AQUASTAT’s statistical information.
- On the AQUAMAPS Water Accounting portal that was developed to host spatially distributed water accounting data generated through an Asian Development Bank (ADB) project and through the WaPOR Project. The ADB water accounting project focused on basins in 6 countries: Cambodia, India,Kazakhstan, Mongolia, Philippines, and Sri Lanka, yet the portal also features data from other water accounts that were released prior to the project in Africa and the Near East. Find out more about WaPOR and water accounting here.
On the Hand-in-Hand platform, WaPOR data can be found under the Water section of the Explore Data button ( 0 ): WaPOR data is available and can be visualised in all its resolutions be it temporal or spatial.
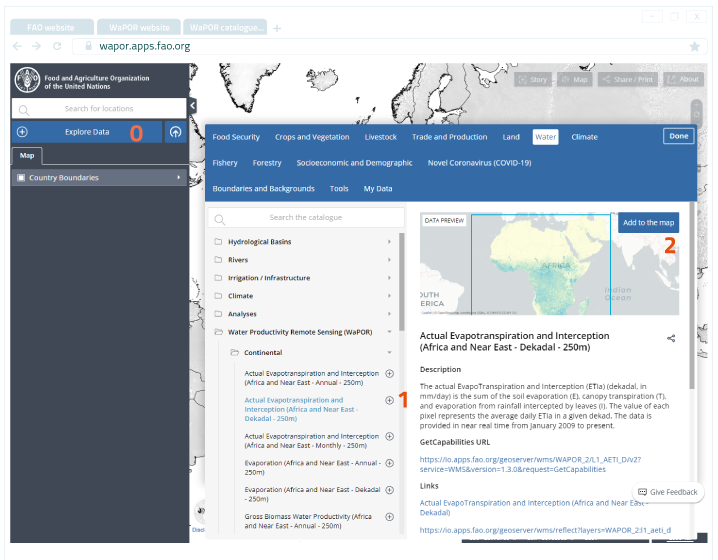
Once a layer is selected, a preview appears as well as a host of information about the data such as access links, metadata links, download links, details about the dataset and about the map service through which the layer is made available, etc…
( 1 ) Press the + button or ( 2 ) click on “add to the map” to add a data layer to the workbench and the map.
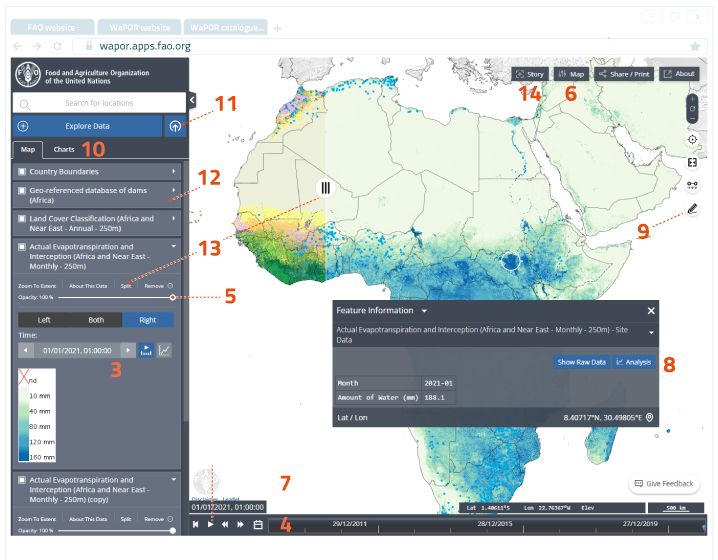
Choose the time-frame to visualise on the map from the dropdown menu ( 3 ) or by moving the cursor along the timeline ( 4 )
( 5 ) adjust the opacity of the layer
( 6 ) choose different basemaps, with the high resolution satellite basemap available, which can be particularly useful for finer 100m and 30m data contextualisation
( 7 ) animate a time series of the data by clicking the play button in a chosen layer in order to visually follow the evolution of the chosen variable in time and space. The speed of the animation can be adjusted with the forward (speeding up) and backward (slowing down) buttons.
( 8 ) run analysis on the data such as generating point and area simple and cumulative time series. This can be done from the pop up that shows information on the data once a pixel is clicked on. A similar pop up with analysis options would appear if the user decided that instead of choosing a pixel, she would draw an area of interest using the “draw polygon” tool ( 9 )
( 10 ) Compare time series that have been generated on a same layer on the charts tab where all the generated charts remain accessible
Integrating spatial data that is not native to the platform (user data) is possible through the “Load local/web data” ( 11 )
( 12 ) WaPOR data can be combined with other data that is available in the HiH catalogue. In this example, the user has chosen to overlay the database of the dams in the African continent to understand if there is any visible relationship between dam location and evapotranspiration.
( 13 ) compare layers (two different layers as is the case in the screen capture) or the same layer at two different times) by using the split feature and moving the cursor.
( 14 ) create “data stories” where the map and its apposed data become visual guides for the stories that they tell.
WaPOR data can, foremost, be accessed on the WaPOR portal that constitutes the backbone of the project and hosts the ever-expanding WaPOR database. Since its inception the portal has evolved into different versions.
Find out more about its history, here.
Currently it offers a wide range of functions:
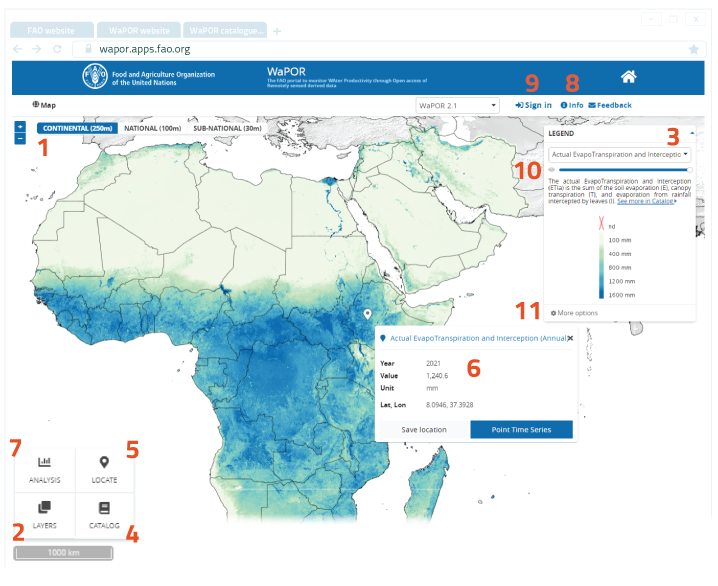
( 1 ) Choose the resolution at which to visualise the data. There are 3 different ones to choose from: the continental resolution (250m), national (100m) and sub-national (30m). Find out more about them here.
( 2 ) Explore available WaPOR layers for different time ranges: scroll down the list of layers, select one and define the temporal parameters. The layer will automatically appear on the map. A history of the opened layers will appear on the dropdown menu ( 3 ).
( 4 ) Browse the catalogue to explore all layers organised by category (water productivity, water, land, climate, ancillary) and by resolution. By selecting a layer, you can read its description and metadata. By selecting the filters of interest: temporal (year, season, dekad) and - for the national level - the country or basin of interest, the selected data can be accessed through OGC link (wms) or downloaded. Go back to the map to continue exploring WaPOR data on the zoomable map of the portal.
( 5 ) Locate a specific place on the map by typing name or geographical coordinates in lat, lon. The point will be shown on the map and a text box will appear describing the layer value for that point ( 6 ). From the text box you will be able to perform a point time series analysis. If you’re logged in, you will have the option to save the point in your "MyWaPOR" area for future reference.
( 7 ) Use the analysis tools. Note that you will have to be signed in to access these functionalities. There are currently four types of analyses supported by WaPOR:
- point and area time series,
- area water productivity and
- area raster download.
Analysis is automatically run on the layer type that is selected (and appears on the map).
Users are asked to specify the place, the time period and additional parameters to run the analysis. For area based operations, users can either draw a polygon on the map or upload a shapefile.
In this latter case, please note that the compressed file (zip) should contain at least 3 files (XXX.shp, XXX.shx, XXX.dbf) and that, if the shapefile contains more than one polygon, only the first feature will be used to run the analysis.
( 8 ) Find more About WaPOR: version number, contact email and additional resources available here.
( 9 ) Sign in using the top right "Sign in" link: you will be asked to either use your own Google account, or create a new account in the WaPOR portal. In this latter case, please type in a valid email address and create your own password for accessing the WaPOR portal. A confirmation email will be sent to you to activate your profile.
( 10 ) The transparency slider is particularly useful if you’re using a background layer (see next point).
( 11 ) Access other map options, including selection of the basemap (like OpenStreetMap) and the possibility to overlay country and hydrological basin boundaries.
For any additional clarification, send an email to [email protected]