As a consequence of the decreasing growth rates of GDP demand, supply and trade projections, generally give lower growth rates over time. This is well reflected by the theory of the product life-cycle. From innovation theory it can be argued that the product life-cycle for most commodities follow an S-shaped curve, with some saturation level. The realism of the theory has been demonstrated in several applications. Most wood related products can be classified as ‘mature’, which means that countries in Europe can be regarded as being on the top of the curve and consequently that growth rates are expected to decrease. A more pragmatic argument in favor of this standpont is the observed decreasing per capita growth of solid wood products and paper, and, with a decreasing population growth rate in Europe an increasing growth rate of demand, supply and trade of wood products is not realistic. In this particular case we find that the growth rates of the 1990s are generally lower than corresponding growth rates of the first decade of next century. The reason for this is the period of recession of the early 1990s which is observed and accounted for (Table 4). Growth rates for 2010 to 2020 are, however, lower than those of 2000 to 2010. The detailed projections are given in appendix 2, where country summary tables are presented.
| Product | 1990–2000 | 2000–2010 | 2010–2020 | 1990–2020 |
| Sawnwood | 1.0 | 1.2 | .9 | 1.0 |
| Woodbased panels | 2.0 | 2.3 | 1.9 | 2.0 |
| Paper & paperboard | 2.6 | 3.2 | 2.4 | 2.7 |
Growth rates are small for sawnwood in comparison with the other two products. Growth rates for woodbased panels are lower than in previous studies, indicating that woodbased panels is approaching ‘maturity’. The growth rates of paper is high, which to a large extent is due to the increasing demand for printing and writing papers.
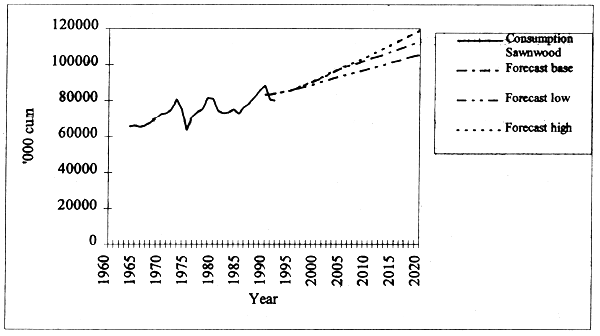
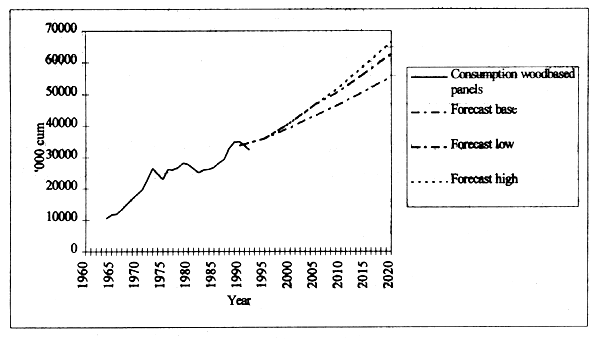
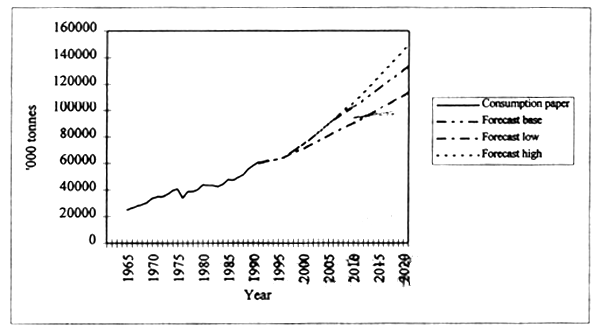
The summary projections for West Europe are given in Figures 1 – 3. The low projections are based on annual growth rates of GDP that are 1 per cent lower than the base scenario up to year 2005. After year 2005 the low projections are based on GDP growth rates that are 0.5 per cent lower than in the base scenario. In the high projections the GDP growth rates are equal to the base scenario growth rates up to year 2005 and after that growth rates are 0.5 per cent higher than in the base scenario.
Figure 1. Sawnwood consumption in West Europe. Observations 1964–1993 and projections to year 2020. 1000 cubic meters.

Figure 2. The consumption of woodbased panels in West Europe. Observations 1964–1993 and projections to year 2020. 1000 cubic meters.

Figure 3. The consumption of paper and paperboard in West Europe. Observations 1964–1993 and projections to year 2020. 1000 cubic meters.
