For a given (‘major’) country and product an estimated (domestic or import) demand model is given as
| log yt = a + b log xt + c log pt + d log yt-1 + gt | (1) |
where yt is domestic consumption (or import) in time period t
log denotes natural logarithms
xt is the end-use index (solid wood products) or real GDP (paper) time period t
pt is real product price
yt-1 is consumption lagged one period
t is a time index; t=1 for 1961, t=2 for 1962 etc and
a, b, c, d and g are estimated elasticities.
Prices, cost and GDP are given in local currencies.
| The long-term elasticity for GDP is then |  |
The projection method is outlined as follows:
With data to year 1992 a base-year value for y is given as a five-year average centered at year 1990:

The reason for using this average as a starting value is that the objective is to give long-term projections. This means that initial values for projections should not reflect short-term fluctuations (such as business cycles). A five-year average is expected to cancel out the major effects of the business cycle and is also expected to be ‘on the trend line’.
The annual growth rate of consumption from 1990 to 1995 is defined as

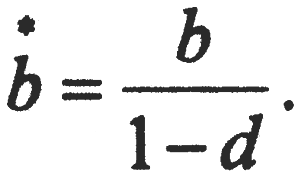
where x90–95 and p90–95 denote corresponding annual rates of growth for the end-use indicator or GDP and price, respectively. If the model is static, i e d = 0, b and c are replaced by b and c, respectively. If, furthermore, price is expected to remain constant over the projection period, which is the case in the base scenario, the factor e* p90–95 will be canceled.
The projection for 1995 is then

Projections for year 2000 are obtained as above with the 1995 projection as the starting point. The procedure after year 2000 is obvious.
Projections are given for years 1995, 2000, 2005 etc. Values for intermediate years are given by linear interpolation.
Projections of imports demand, exports supply follow the same methodology as above.
By adding import demand and domestic demand (for a given product and country) apparent consumption is obtained and by adding domestic demand and export supply total production is given.
The method given here also applies to the time series cross section demand model for the ‘minor countries’.
For ‘minor countries’ only demand models have benn estimated. It is then asumed that production is a constant share of consumption (self.-suffiency ratio) and that imports is a constant share of consumption. Export is calculated from these quantities.