![]()
![]()
![]()
For the ‘major countries’ a set of econometric models are estimated for each country and product. The estimated models are used for projections, where the historical model structure (coefficients) is assumed to remain constant over the projection period. The independent (exogenous) variables of the model system must be forecast to obtain projections for the dependent (endogenous) variables of the system. This means that forecasts - or scenarios - must be set for the end-use index (solid wood products), for GDP (paper), prices and costs (all products).
The base scenario for the independent variables is constructed from the following considerations
GDP projections are given by FAO (see chapter 3.3 in the main document). These are given as annual average growth rates up to the period 1995–2005.
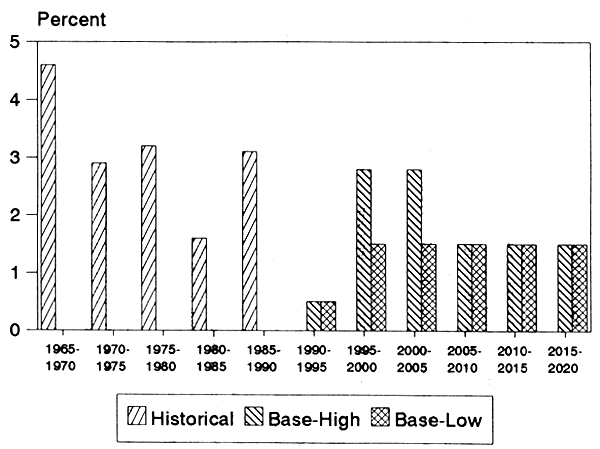
Historical evidence indicates that GDP growth rates are declining over time (see e.g. figure 3.1 in the main document). This has been accounted for in the projections: For the period 2005–2010 GDP growth rate up to year 2005 is reduced by .5 per cent and for subsequent periods reduced by 1.0 per cent. The GDP growth rate for Europe is given (Table 3):
Table 3--Growth rate projections of GDP in Europe as annual average growth rates over 5-year periods in per cent: Base scenario for projections of ETTSV.
| 1990–95 | 1995–2000 | 2000–05 | 2005–10 | 2010–15 | 2015–20 |
| .5 | 3.0 | 3.0 | 2.5 | 2.0 | 2.0 |
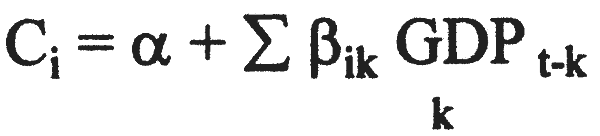
where Ci are the components of the end use index, GDP is gross domestic product (deflated), and α and βik are estimated parameters. The coefficients of the lag structure were estimated using a 5 year lag length and a second-degree polynomial form. The sum of the lag coefficients (å β ik) are reported in table 4.
European real GDP growth rates
Historical and projected
| Component | |||
|---|---|---|---|
| Country | Construction | Manufacturing | Furniture |
| France | .309 *** | .585 *** | .559 *** |
| Germany | .251 *** | .883 *** | .735 *** |
| Italy | .669 *** | .749 *** | 1.173 (b) |
| Spain | .530 * | .758 *** | .467 *** |
| Sweden | 1.020 *** | .790 | .820 |
| Finland | .140 | 1.070 *** | 1.090 |
| Norway | .300 | .420 *** | .140 |
| United Kingdom | 1.200 *** | 1.230 *** | .560 *** |
(a) Elasticity with respect to GDP.
(b) Calculated from the ratio of growth rates.
Significance of estimated elasticities:
* = .10;
** = .05;
*** = .01
In the base scenario prices and costs are set constant (zero growth) in the projection period. There is historical evidence that real prices and cost factors of wood products vary only marginally over a long period and, generally, there is no trend. Only during the oil crisis of the 70s were there any major price fluctuations but the level of the prices were on the same level both before and after this period.
According to the assumption of a stable model structure over time, estimated elasticities have been set constant in the projection period.
Estimated time trends in the models are assumed to continue in the projection period.
Alternative scenarios are obtained by changing the assumptions above.
In the model system demand is divided into two separate components; domestic demand and imports demand. Consequently consumption from domestic sources (domestic demand) can be predicted as well as imports demand. The sum of the two components give total apparent consumption. Similarly, the model system gives projections of production for the domestic market (equal to domestic demand) and for exports. The sum of these two components give total production. Projections for trade components are given directly and net trade can consequently be derived.
Projections are given for years 1995, 2000 etc, where the interpretation is that the figures are averages over five-year periods centered around the given years. For intermediate years linear interpolation is applied. Consequently, the projections reflect only long-term (trend) aspects and do not cover business cycle variation.
For the period 1990 to the year 2020 the models and the GDP-assumptions are used directly to give projections. There is, however, one major exception. For paper products proposed capacity expansions to year 2000 are available by country (and even by mill) from FAO. In countries where projected paper production increase exceeds capacity expansion for the period, production growth is set equal to capacity increase. This applies for approximately half of the cases (countries and paper products).
For ‘minor countries’, where a time series cross section approach has been applied, the production projections are given using an assumption of constant ratio of production to consumption, where the ratio used is the 5-year average centered around 1992. The same assumption also applies for imports.
![]()
![]()
![]()