Development of simple and low cost dietary feeding strategies for the culture of juvenile pearl spotted rabbitfish (Siganus canaliculatus) in floating net cages.
Eight dietary feeding regimes were evaluated:
Two in-house diets were formulated from locally available feed ingredients. The proximate chemical composition of the feed ingredients used in the 1989 feed development programme is shown in Table 1. Brown fish meal and solvent extracted soybean meal were used as the main sources of dietary protein in the diets formulated. The only difference between the formulations was the use of either wheat middlings (RD1) or rice bran (RD2) as the dietary filler; the latter being 30% cheaper than the former. Both diets were formulated to contain 31% crude protein (N ×6.25) and 8% crude lipid. The formulation, proximate chemical composition and cost of the diets tested is shown in Table 2.
Experimental diets (RD1 and RD2) were prepared in the INS/81/008 feed preparation laboratory (Figure 2). Diets were prepared by first grinding all dry feed ingredients in a disc mill to a particle size of 0.6 mm and then blending the formulated mixture (excluding the vitamin premix, choline chloride and fish oil) in a dough mixer. Water was then added to the feed mixture (equivalent to 40% by weight) and the feed dough reblended until the binder (wheat flour) had been primed (approximately 15 minutes blending period). The homogenous dough was then extruded through a 2mm diameter die plate (using the fish cutter/extruder) and the resultant moist pellets then dried at ambient temperature for 18 hours within a diet drying cabinet (Figure 3). The vitamin premix and choline chloride was then added to the diet by homogenizing the vitamins in fish oil and then coating the dry pellets with the lipid homogenate by mixing in the dough mixer. All dry diets (2mm crumble size) were stored in air-tight plastic containers at room temperature until fed.
Table 1 . Proximate chemical composition of the feed ingredient sources used in the dietary formulations
| Percent, as fed basis | ||||||||
| Ingredient | Moisture | Crude protein | Lipid | Crude fibre | Ash | Salt | Calcium | Phosphorus |
| Brown fish meal 1 | 7.8 | 62.94 | 5.78 | 6.04 | 12.61 | 0.75 | 3.71 | 1.79 |
| Shrimp head meal 1 | 10.8 | 48.36 | 0.79 | 10.18 | 24.00 | 2.88 | 8.69 | 1.77 |
| Squid liver powder 1 | 12.0 | 49.67 | 16.51 | - | 9.11 | 1.64 | 2.08 | 1.07 |
| Suehiro UGF 2 | 8.0 | 29.85 | 11.78 | 11.06 | 4.68 | 0.19 | 0.10 | 0.78 |
| Soybean meal 1 | 12.0 | 41.63 | 1.76 | 2.58 | 6.45 | 0.41 | 0.25 | 0.64 |
| Wheat middlings 1 | 9.8 | 14.00 | 3.72 | 7.79 | 3.62 | 0.10 | 0.07 | 0.57 |
| Wheat flour 1 | 13.4 | 12.34 | 0.92 | 0.14 | 0.63 | 0.04 | 0.05 | 0.10 |
| Rice bran 1 | 8.2 | 14.05 | 9.97 | 8.61 | 9.75 | 0.08 | 0.15 | 1.55 |
| Zeolite 1, 3 | - | - | - | - | - | - | 7.03 | 0.05 |
1 Ingredients supplied by P.T. Charoen Pokphand Indonesia Animal Feedmill Co. Ltd., Jakarta
2 Ingredient supplied by P.T. Astabumi Ciptadaya, Jakarta
3 Magnesium content 0.213%
Table 2 . Formulation, proximate chemical composition and cost of the rabbit fish test diets
| Formulation (%) | Diet code SGD | ||||||
| RD1 | RD2 | BS 1 | CP 2 | FF 3 | EC 4 | GL 5 | |
| Brown fish meal | 22.0 | 22.0 | Broiler starter diet | Carp starter pellet | Frozen fish | Eucheuma cottoni | Oracllaria llchenoldes |
| Soybean meal (solvent extracted) | 25.0 | 25.0 | |||||
| Wheat middlings | 38.55 | ||||||
| Rice bran | - | 40.55 | |||||
| Wheat flour | 10.0 | 10.0 | |||||
| Fish oil 6 | 2.0 | 2.0 | |||||
| Soybean oil | 2.0 | - | |||||
| Choline chloride (50%) 6 | 0.25 | 0.25 | |||||
| Vitamin premix AGJT/F1 6, 7 | 0.20 | 0.20 | |||||
| Total | 100.00 | 100.00 | |||||
| Percent national ingredients | 97.55 | 97.55 | |||||
| Percent imported ingredients | 2.45 | 2.45 | |||||
| Proximate composition (%, as fed basis) | |||||||
| Moisture | 10.60 | 10.20 | 12.00 | 10.40 | 74.54 | 91.29 | 88.13 |
| Crude protein (N × 6.25) | 31.75 | 31.32 | 22.45 | 26.92 | 17.12 | 0.42 | 1.85 |
| Crude lipid | 7.95 | 9.51 | 5.47 | 2.96 | 3.30 | 0.04 | 0.21 |
| Crude fibre | 6.05 | 6.52 | 4.32 | 2.95 | - | 0.73 | 0.78 |
| Ash | 5.76 | 7.93 | 5.60 | 5.93 | 5.65 | 3.78 | 4.36 |
| Salt (NaCl) | 0.50 | 0.32 | 0.66 | 0.53 | 0.40 | 0.26 | 0.37 |
| Calcium (Ca) | 1.00 | 0.87 | 1.12 | 1.68 | 1.58 | 0.04 | 0.09 |
| Phosphorus (P) | 0.80 | 1.21 | 0.76 | 0.73 | 0.89 | 0.01 | 0.03 |
| Proximate composition (%, dry matter basis) | |||||||
| Crude protein (N × 6.25) | 35.51 | 34.77 | 25.51 | 30.04 | 67.24 | 4.86 | 15.59 |
| Crude lipid | 8.89 | 10.59 | 6.22 | 3.30 | 12.95 | 0.44 | 1.75 |
| Crude fibre | 6.77 | 7.26 | 4.91 | 3.29 | - | 8.39 | 6.60 |
| Ash | 6.44 | 8.83 | 6.36 | 6.62 | 22.20 | 43.46 | 36.74 |
| Salt (NaCl) | 0.56 | 0.36 | 0.75 | 0.59 | 1.56 | 3.05 | 3.12 |
| Calcium (Ca) | 1.12 | 0.97 | 1.27 | 1.87 | 6.22 | 0.52 | 0.79 |
| Phosphorus (P) | 0.89 | 1.35 | 0.86 | 0.81 | 3.50 | 0.15 | 0.26 |
| Diet cost (Rupiah/kg diet, as fed basis) 8 | |||||||
| Total raw ingredient cost | 567 | 530 | 350 | 100 | 150 | ||
| National ingredient cost (%) | 89.7 | 89.0 | |||||
| Imported ingredient cost (%) | 10.3 | 11.0 | |||||
| Estimated processing/handling cost 9 | 113 | 106 | 35 | 5 | 7.5 | ||
| Total diet cost | 680 | 636 | 468 | 515 | 385 | 105 | 157.5 |
1 Broiler starter crumble No. 511 (P.T. Charoen Pokphand Indonesia Animal Feedmill Co., Jakarta)
2 Carp pellet; commercial expanded carp starter pellet No. 788 (P.T. Charoen Pokphand Indonesia Animal Feedmill Co., Jakarta)
3 Frozen fish; Splendid Pony fish Leiognathus splendens
4 Eucheuma cottoni (live)
5 Gracilaria lichenoides (live)
6 Imported feed ingredients
7 Vitamin premix AGJT/F1 supplies per kilogram of dry diet; vitamin A 2400 IU, vitamin D3 1200 IU, vitamin E 120 mg, vitamin K 9.6 mg, thiamine 19.2 mg, riboflavin 24 mg, pyridoxine 19.2 mg, pantothenic acid 72 mg, nicotinic acid 96 mg, folic acid 4.8 mg, biotin 0.24 mg, vitamin B12 0.024 mg, inositol 200 mg, vitamin C 480 mg
8 28th October 1989; Rupiah 1790 = 1 US $
9 Based on a 20% handling/processing cost for in-house produced pelleted diets (excluding, profit margin), a 10% handling/freezer storage cost for frozen fish, and a 5% handling/culture cost for live seaweeds
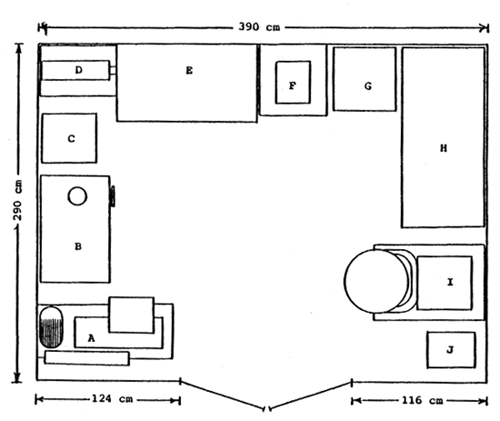 | ||
| KEY | ||
| A - | Disc mill/grinder model FFC-37, 10 HP, 3 phase, 7.5kw, capacity 210 kg/h soybean 0.6mm, screen sizes 0.6, 1.2 and 3.5 mm | |
| B - | Fish grinder/extruder model NRA 301, 3 HP, single phase, capacity 50 kg/h, 1 – 4 mm die plates | |
| C - | Plastic chemicals cabinet with drawers | |
| D - | CFG electric blower, 3 phase, 3" diam. outlet, capacity 8.5 m3/min, 0.35 kw | |
| F - | Sartorius top pan electronic balance model B6100, capacity 6100g, sensitivity 0.1g | |
| E - | Wooden diet drying cabinet, L × W × W 1200 × 60 × 2000 mm, 15 shelves, capacity 25 kg moist diet containing 25 – 30% moisture, approximate drying time at ambiant temperature 8 – 12 hrs | |
| G - | Sharp refrigerator, 50 w | |
| H - | Derby chest freezer, 2.09 kw/24h | |
| I - | Dough mixer model CH 200M with variable gears, 60 litre capacity, 2 HP, 3 phase | |
| J - | Voltage stabilizer model Stavol 5KGX, 5 kva |
Figure 2 INS/81/008 feed preparation laboratory
Freshly caught ‘food fish’ (L. splendens) was purchased from local fishermen and stored in a freezer until fed. Similarly, live seaweeds were maintained in floating net cages at the National Seafarming Development Centre until fed.
Rabbitfish varying in weight from 48 to 68g were obtained from stock fish held at Teluk Hurun; all juvenile stock fish having previously been rea red on a moist pellet from wild caught fingerlings. Experimental fish were stocked at an initial density of fifteen fish per cage, each cage measuring 1 × 1 × 1.5m (1 cubic meter water volume), having a three quarter inch net mesh size, and covered above water with bamboo matting. The aim of the bamboo cover was to 1) prevent bird predation, 2) protect fish from the harmful effects of UV radiation, 3) reduce fish stress, and 4) to minimize algal net fouling. Two cages were allocated per dietary treatment; all experimental cages being housed on a single 6 × 6m floating raft (Figure 4) anchored in 10m of water and located 300m from the jetty of the National Seafarming Development Centre at Teluk Hurun.
With the exception of the seaweeds, all experimental diets were fed by hand to satiation twice daily at 0800h and 1600h, seven days a week. Diets were transported to the cages each day within an insulated plastic storage bin; feed containers for individual cages being weighed on a top-pan balance before and after feeding so as to ascertain dietary feed intake on a daily basis. By contrast, seaweeds were fed by placing a known weight of living algal biomass (sufficient for 5 to 7 days) in a submersible plastic feeding basket at the bottom of the cage. Experimental fish required no dietary weaning period prior to the start of the feeding trial; stock and wild caught fish alike immediately being able to consume a dry diet crumble.
All fish were weighed and measured under anaesthesia at the start of the experiment and at successive monthly intervals for the duration of the 100 day feeding trial. Fish mortalities were recorded whenever apparent and on the final day of the experiment all fish were sacrificed from each cage. Fish were individually weighed and measured (total body length), their sexual status determined by hand stripping, and then frozen for subsequent proximate chemical analysis.
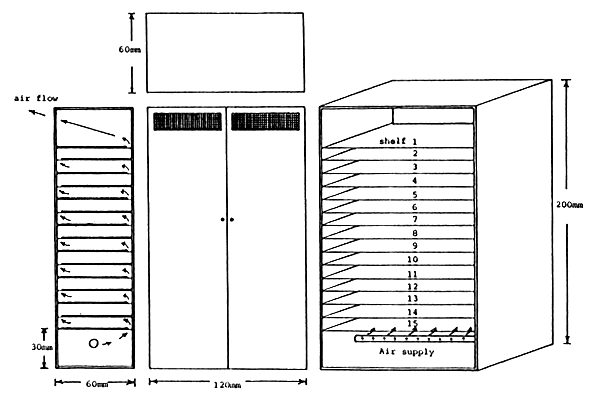
Figure 3 . INS/81/008 diet drying cabinet
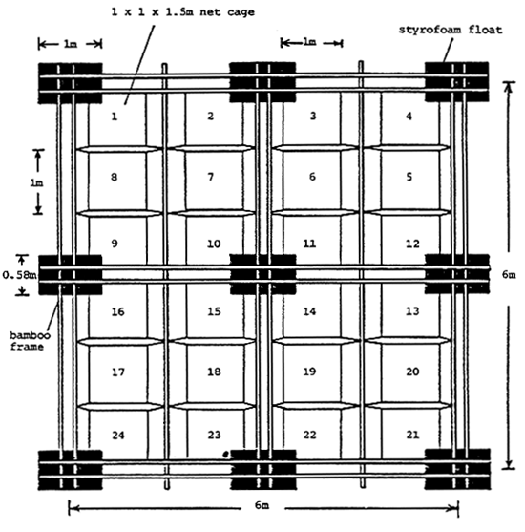
Figure 4 . Diagrammatic representation of a 6 × 6 m floating raft used for housing the experimental cages for the fish feeding trials at the National Seafarming Development Centre in Hanura, Teluk Harun, Bandar Lampung
Water temperature and salinity were determined daily at 0830h and dissolved oxygen concentration, pH and secchi disc readings measured on a weekly basis. The water quality within the experimental cages over the 100 day feeding trial is shown in Figure 5.
Fish and diet samples were first oven dried at 105°C to constant weight and then ground to a homogenous powder using a coffee grinder. Crude protein (N × 6.25), lipid, fibre, ash, calcium and phosphorus analyses were performed on the dried fish and diet samples using standard AOAC (1980) methods at the chemical laboratories of P.T. Charoen Pokphand Indonesia Animal Feedmill Co., Jakarta.
Differences in fish body measurements between dietary treatments were tested for significance (P < 0.05) by Duncan's Multiple Range Test (Duncan, 1955). Standard errors (± S.E.) were calculated to identify the range of the means.
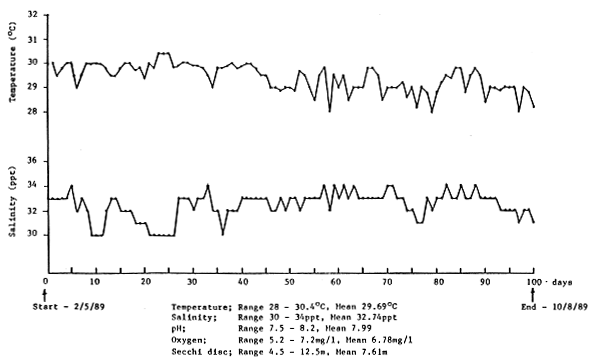
Figure 5. Water quality within the experimental cages over the 100 day feeding trial
The mean growth response of rabbitfish over the 100 day feeding trial is shown in Figure 6 and Table 3. Despite the significantly higher (p < 0.05) initial body weight of fish fed the RD2 diet there was no significant difference (p < 0.05) in the final body weight and body length of fish fed frozen fish (FF), carp starter pellet (CP), RD1 pellet (RD1) and RD2 pellet (RD2). Fish fed broiler starter crumble (BS) had a significantly lower (p < 0.05) mean final body weight than fish fed FF. By contrast, control fish receiving no exogenous feed (NF) and fish fed live seaweed (EC, GL) all displayed a negative growth response over the trial period and consequently had significantly lower (p < 0.05) mean final body measurements than the other dietary treatments. The highest percentage mean daily weight gain and specific growth rate was observed for fish fed RD1, followed by FF, CF, BS and RD2 respectively (Table 3). However, it must be pointed out that the growth response of fish fed RD1 and BS was noticeably declining during the latter stages of the feeding trial (Figure 6).
The feeding response of rabbitfish over the culture trial is shown in Figures 7 – 12 and is summarized in Table 4. With the exception of fish fed FF, all fish soon became accustomed to accepting the experimental diets; fish fed FF requiring at least 14 days before a moderate feeding response was observed (Figure 7). The daily feed intake of fish fed FF, BS, CP, RD1 and RD2 was increased markedly after 40 days by the introduction of two additional feeding opportunities per day, approximately one hour after the scheduled 0800h and 1600h feed. This observation is perhaps not surprising bearing in mind the almost continuous feeding/browsing habit of most herbivorous animal species. In general rabbitfish tended to nibble their feed by sucking rather than biting; fish preferring small round feed particles (ie. 1–2cm crumbles) rather than elongated pellets, the latter requiring precise fish orientation prior to ingestion due to their relatively small mouth size.
In-between the fixed feeding schedules all fish were actively seen to browse on the living algal biomass growing on the nets. However, on no occasion were rabbitfish seen to prey on the wild fish fry frequently entering their cages. These extraneous fish were particularly abundant within the cages during the fixed feeding periods; the extraneous fish actively competing with the resident rabbitfish for the introduced feed. This was particularly noticeable within cages fed FF and may explain the poor food conversion ratio observed for these treatments.
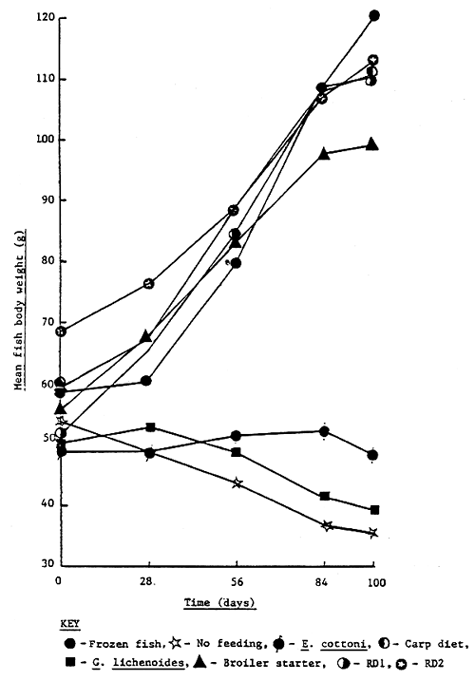
Figure 6. Growth response of rabbit fish over the 100 day feeding trial
Table 3. Growth performance of rabbit fish from day 0 to day 100
| Dietary treatment | NF | FF | EC | GL | BS | CF | RD1 | RD2 | ±SE1 | |
| Size and shape | ||||||||||
| Initial body weight (g) | a | 57.0 | 61.0 | 49.7 | 50.0 | 51.3 | 49.0 | 41.7 | 70.3 | |
| b | 50.3 | 56.0 | 48.0 | 50.3 | 59.7 | 69.3 | 61.7 | 66.3 | ||
| X | 53.6 a | 58.5 ab | 48.8 a | 50.1 a | 55.5 a | 59.1 ab | 51.7 a | 68.3 b | 4.06 | |
| Initial total body length (cm) | a | 16.7 | 16.3 | 15.7 | 15.6 | 15.9 | 15.7 | 15.3 | 17.7 | |
| b | 15.2 | 15.7 | 15.7 | 15.8 | 16.6 | 17.0 | 16.9 | 17.4 | ||
| X | 15.9 a | 16.0 a | 15.7 a | 15.7 a | 16.2 a | 16.3 a | 16.1 a | 17.5 b | 0.37 | |
| Final body weight (g) | a | 37.9 | 125.0 | 46.4 | 40.0 | 90.7 | 100.7 | 103.3 | 119.3 | |
| b | 32.7 | 114.7 | 50.0 | 37.9 | 107.3 | 120.7 | 117.3 | 106.1 | ||
| X | 35.3 a | 119.8 c | 48.2 a | 38.9 a | 99.0 b | 110.7 bc | 110.3 bc | 112.7 bc | 4.57 | |
| Final total body length (cm) | a | 15.1 | 19.5 | 15.6 | 15.0 | 18.2 | 19.1 | 19.1 | 20.1 | |
| b | 15.0 | 19.1 | 15.9 | 14.8 | 19.5 | 19.8 | 19.8 | 19.1 | ||
| X | 15.0 a | 19.3 b | 15.7 a | 14.9 a | 18.8 b | 19.4 b | 19.4 b | 19.6 b | 0.27 | |
| Fish condition factor (final) 2 | a | 10.4 | 15.5 | 11.8 | 11.5 | 14.0 | 12.8 | 13.6 | 13.5 | |
| b | 9.1 | 15.4 | 11.3 | 11.2 | 13.2 | 14.0 | 13.6 | 13.6 | ||
| X | 9.7 a | 15.4 d | 11.5 b | 11.3 b | 13.6 c | 13.4 c | 13.6 c | 13.5 c | 0.35 | |
| Growth response | ||||||||||
| Total weight gain (%) | a | - | 105 | - | - | 76.8 | 105.5 | 147.7 | 69.7 | |
| b | - | 105 | 4.2 | - | 79.7 | 74.2 | 90.1 | 60.0 | ||
| X | - | 105 | - | - | 78.2 | 89.8 | 118.9 | 64.8 | ||
| Mean weight gain (%/day) | a | - | 1.05 | - | - | 0.77 | 1.05 | 1.48 | 0.70 | |
| b | - | 1.05 | 0.04 | - | 0.80 | 0.74 | 0.90 | 0.60 | ||
| X | - | 1.05 | - | - | 0.78 | 0.90 | 1.19 | 0.65 | ||
| Mean daily weight gain (g/fish/day) | a | - | 0.64 | - | - | 0.39 | 0.52 | 0.62 | 0.49 | |
| b | - | 0.59 | 0.02 | - | 0.48 | 0.51 | 0.56 | 0.40 | ||
| X | - | 0.61 | - | - | 0.43 | 0.51 | 0.59 | 0.44 | ||
| Specific growth rate (%/day) 3 | a | - | 0.72 | - | - | 0.57 | 0.72 | 0.91 | 0.53 | |
| b | - | 0.72 | 0.04 | - | 0.59 | 0.55 | 0.64 | 0.47 | ||
| X | - | 0.72 | - | - | 0.58 | 0.63 | 0.77 | 0.50 | ||
1 Standard error, calculated from residual mean square in the analysis of variance
2 Fish condition factor = Final fish body weight (g) / Final total fish body length (cm)3, × 1000
3 Specific growth rate = Log e Final body weight (g) - Log e Initial body weight (g) / Time (days), × 100
abcd Mean values for components with the same superscripts are not significantly (p<0.05) different
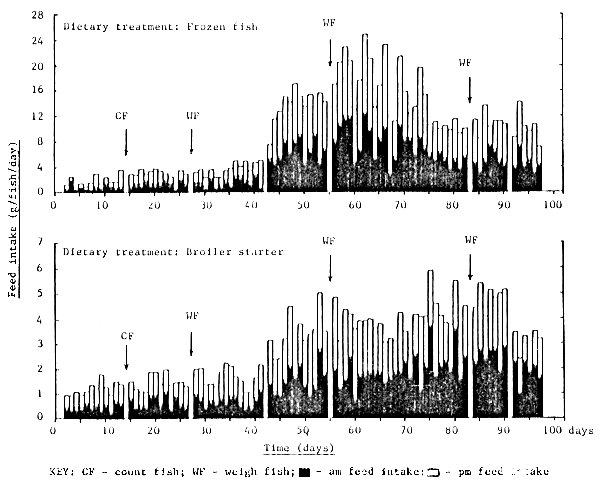
Figure 7. Daily feed intake of rabbit fish fed frozen fish and a broiler starter ration from day 0 to day 100
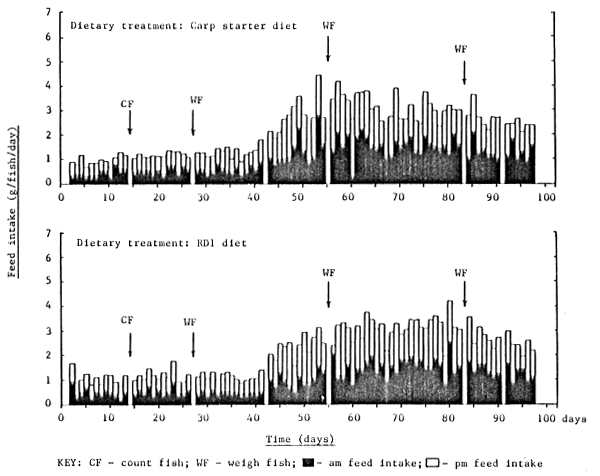
Figure 8. Daily feed intake of rabbit fish fed carp starter diet and RD1 ration from day 0 to day 100
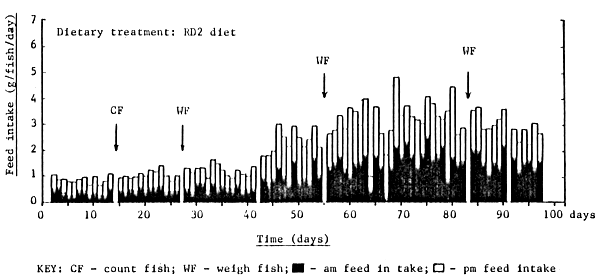
Figure 9 . Daily feed intake of rabbit fish fed the RD2 ration from day 0 to day 100
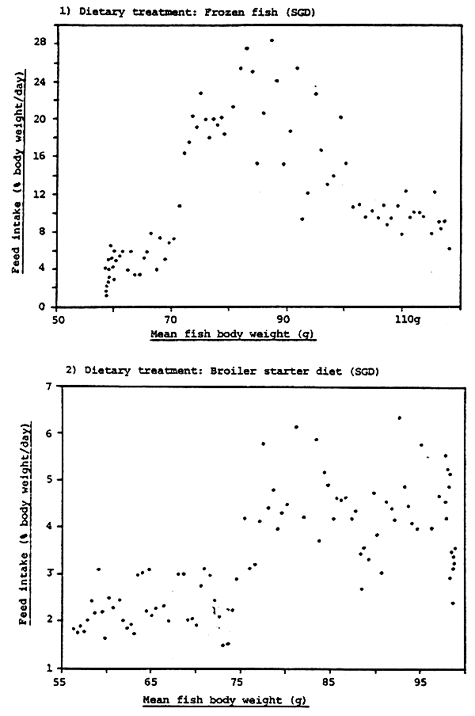
Figure 10. Relationship between percentage daily food intake and body weight of rabbit fish fed frozen fish and broiler starter diet from day 0 to day 100
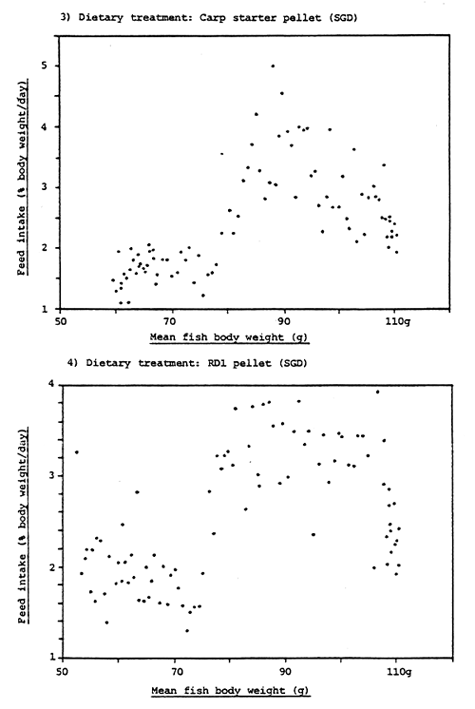
Figure 11. Relationship between percentage daily food intake and body weight of rabbit fish fed carp starter diet and RD1 pellet from day 0 to day 100
5) Dietary treatment: RD2 pellet (SGD)
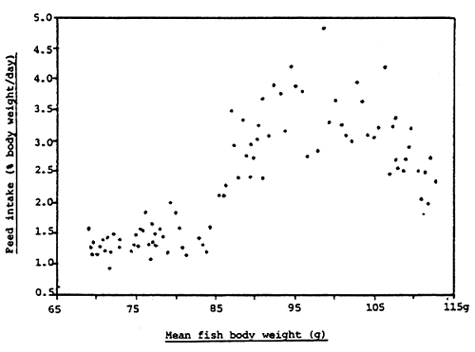
Figure 12. Relationship between percentage daily food intake and body weight of rabbit fish fed RD2 pellet from day 0 to day 100
Table 4. Feed Intake and diet utilization efficiency of rabbit fish from day 0 to day 100
| Dietary treatment | NF | FF | EC | GL | BS | CF | RD1 | RD2 | |
| Feeding response | |||||||||
| Total feed intake (as fed, g/fish) | a | - | 885 | 2383 | 1674 | 262 | 180 | 211 | 204 |
| b | - | 852 | 2183 | 1670 | 265 | 222 | 196 | 213 | |
| X | - | 868 | 2283 | 1672 | 263 | 201 | 203 | 208 | |
| Daily feed intake (as fed, g/fish/day) | a | - | 8.85 | 23.83 | 16.74 | 2.62 | 1.80 | 2.11 | 2.04 |
| b | - | 8.52 | 21.83 | 16.70 | 2.65 | 2.22 | 1.96 | 2.13 | |
| X | - | 8.68 | 22.83 | 16.72 | 2.63 | 2.01 | 2.03 | 2.08 | |
| Daily feed intake (dry matter, g/fish/day) | a | - | 2.25 | 2.08 | 1.99 | 2.31 | 1.61 | 1.89 | 1.83 |
| b | - | 2.17 | 1.90 | 1.98 | 2.33 | 1.99 | 1.75 | 1.91 | |
| X | - | 2.21 | 1.99 | 1.98 | 2.32 | 1.80 | 1.82 | 1.87 | |
| Feed utilization | |||||||||
| Food conversion ratio (as fed) 1 | |||||||||
Week 0–4 | a | - | 26.76 | - | 668 | 3.37 | 2.18 | 2.46 | 4.09 |
| b | - | 92.08 | 834 | 177 | 2.64 | 7.57 | 2.23 | 3.53 | |
| X | - | 59.42 | - | 422 | 3.00 | 4.87 | 2.34 | 3.81 | |
Week 4 – 8 | a | - | 11.26 | 258 | - | 4.49 | 2.32 | 2.38 | 3.29 |
| b | - | 12.14 | 219 | - | 4.11 | 2.61 | 2.60 | 3.86 | |
| X | - | 11.70 | 238 | - | 4.30 | 2.46 | 2.49 | 3.57 | |
Week 8 – 12 | a | - | 17.28 | 325 | - | 7.93 | 3.95 | 3.71 | 4.57 |
| b | - | 14.97 | - | - | 6.75 | 4.93 | 3.77 | 5.52 | |
| X | - | 16.12 | - | - | 7.34 | 4.44 | 3.74 | 5.04 | |
Week 12 – 100 days | a | - | 13.27 | - | - | 42.07 | 25.08 | 11.55 | 6.04 |
| b | - | 12.80 | - | - | 37.42 | 8.93 | 17.98 | 7.60 | |
| X | - | 13.03 | - | - | 40.14 | 17.00 | 14.76 | 6.82 | |
Overall food conversion ratio Week 0 – 100 days (as fed) | a | - | 13.83 | - | - | 6.72 | 3.46 | 3.40 | 4.16 |
| b | - | 14.44 | 1091 | - | 5.52 | 4.35 | 3.50 | 5.32 | |
| X | - | 14.13 | - | - | 6.12 | 3.90 | 3.45 | 4.74 | |
Overall food conversion ratio Week 0 – 100 days (dry matter) 2 | a | - | 3.52 | - | - | 5.92 | 3.10 | 3.05 | 3.73 |
| b | - | 3.68 | 95 | - | 4.85 | 3.90 | 3.12 | 4.77 | |
| X | - | 3.60 | - | - | 5.38 | 3.50 | 3.08 | 4.25 | |
| Protein efficiency ratio 3 | a | - | 0.42 | - | - | 0.66 | 1.06 | 0.92 | 0.77 |
| b | - | 0.40 | 0.43 | - | 0.81 | 0.84 | 0.90 | 0.60 | |
| X | - | 0.41 | - | - | 0.73 | 0.95 | 0.91 | 0.68 | |
| Apparent net protein utilization 4 | a | - | 7.28 | - | - | 12.65 | 10.70 | 17.44 | 13.52 |
| b | - | 7.67 | - | - | 14.14 | 16.98 | 17.60 | 10.94 | |
| X | - | 7.47 | - | - | 13.39 | 17.81 | 17.52 | 12.23 | |
1 Food conversion ratio = Feed intake (as fed basis, g) / Body weight gain (wet basis, g)
2 Food conversion ratio = Feed intake (dry matter basis, g) / Body weight gain (wet basis, g)
3 Protein efficiency ratio = Body weight gain (wet basis, g) / Crude protein dietary Intake (g)
4 Apparent net protein utilization = Tissue crude protein depoaltion (g) / Crude protein dietary Intake (g), × 100
Fish handling and routine cage maintenance activities had no negative effect on the subsequent dietary feed intake of fish during the experiment (Figure 7 – 9).
Feed utilization efficiency of fish over the culture trial is shown in Table 4. In relative terms the best overall feed efficiency was observed for fish fed RD1 and CP. However, it must be pointed out that the level of feed efficiency observed was poor, mean dry matter food conversion ratios varying from 3.08 to 5.3 for fish fed RD1 and BS respectively. The poor food conversion ratio observed for FF during the first month of the experiment was almost certainly due to the poor feeding response of fish during this period and to the consumption of FF feed particles by extraneous fish. It is important to note that the food conversion ratio of fish fed BS, CP and RD1 increased dramatically during the final two weeks of the feeding trial.
Dietary feeding regime also had a considerable effect on the gross carcass composition of fish (Table 5). Control (NF) and seaweed (EC, GL) fed fish had a markedly higher carcass moisture, ash and mineral content, and a lower carcass protein and lipid content than fish fed FF or dry formulated diets. Such a carcass composition is typical of starving fish which have exhausted their tissue energy reserves. However, there was no noticeable difference in the carcass composition of fish fed FF or dry formulated feeds. The lower carcass moisture content and higher carcass protein and lipid content of these treatments reflecting a generally healthy fish condition.
The sexual status and body weight range of rabbitfish at the end of the 100 day feeding trial is shown in Table 6 and Figure 13; sexual status of fish being ascertained by the release of eggs or milt from the body cavity on hand stripping. Fish fed FF and dry formulated feeds displayed marked sexual activity; 62 – 93% of fish yielding milt or eggs on hand stripping. It is interesting to note that during the final stages of the experiment growth was poorest in those dietary treatments displaying the highest sexual activity and vice-versa. The average body weight, length and condition factor of active males and females was 87.4g, 18.7cm, 13.2 and 122.4g, 19.6cm, 15.7 respectively. Not surprisingly, fish receiving no exogenous dietary feed input (NF) and fish fed live seaweed (EC, GL) displayed little or no sexual activity at the end of the feeding trial (Table 6).
| Composition (% wet weight) | ||||||||||
| Moisture | a | 78.91 | 74.61 | 77.70 | 78.49 | 71.60 | 72.56 | 71.48 | 72.72 | |
| b | 78.43 | 72.00 | 78.13 | 78.61 | 71.74 | 71.03 | 71.55 | 73.19 | ||
| x | 73.41 | 78.67 | 73.31 | 77.92 | 78.55 | 71.67 | 71.80 | 71.52 | 72.96 | |
| Crude protein | a | 13.94 | 17.98 | 16.99 | 15.24 | 18.82 | 18.13 | 18.89 | 18.30 | |
| b | 14.26 | 18.92 | 16.66 | 15.10 | 18.28 | 19.16 | 19.21 | 18.61 | ||
| x | 18.77 | 14.10 | 18.45 | 16.83 | 15.17 | 18.55 | 18.65 | 19.05 | 18.46 | |
| Lipid | a | 0.30 | 3.65 | 0.81 | 0.33 | 4.45 | 3.36 | 5.21 | 4.94 | |
| b | 0.34 | 3.95 | 0.96 | 0.35 | 5.49 | 3.55 | 6.17 | 3.69 | ||
| x | 2.97 | 0.32 | 3.80 | 0.89 | 0.34 | 4.97 | 3.46 | 5.69 | 4.32 | |
| Ash | a | 6.40 | 3.57 | 4.72 | 5.87 | 4.41 | 3.68 | 3.71 | 3.51 | |
| b | 6.98 | 3.32 | 4.98 | 5.97 | 3.69 | 3.44 | 3.58 | 3.72 | ||
| x | 4.17 | 6.69 | 3.45 | 4.85 | 5.92 | 4.05 | 3.56 | 3.65 | 3.62 | |
| Calcium | a | 2.21 | 1.11 | 1.53 | 2.04 | 1.16 | 1.13 | 1.19 | 1.17 | |
| b | 2.47 | 0.92 | 1.68 | 1.83 | 1.15 | 1.22 | 1.12 | 1.13 | ||
| x | 1.21 | 2.34 | 1.02 | 1.61 | 1.94 | 1.15 | 1.18 | 1.16 | 1.15 | |
| Phosphorus | a | 0.97 | 0.60 | 0.72 | 0.95 | 0.61 | 0.56 | 0.58 | 0.59 | |
| b | 1.01 | 0.64 | 0.79 | 0.86 | 0.58 | 0.60 | 0.56 | 0.58 | ||
| x | 0.62 | 0.99 | 0.62 | 0.76 | 0.91 | 0.60 | 0.58 | 0.57 | 0.58 | |
1 NF - No feeding, FF - Frozen fish, EC - E. cottoni, GL - G. lichenoides, BS - Broiler starter diet, CF - Carp feed, RD1 - RD1 pellet, RD2 - RD2 pellet
Table 6. Sexual activity of rabbit fish at the end of the 100 day feeding trial
| Dietary treatment | Status (%) 1 | |||
| Active males (%) | Active females (%) | Non-active (%) | ||
| No feeding | a | 0 | 0 | 100 |
| b | 0 | 0 | 100 | |
| x | 0 | 0 | 100 | |
| Frozen fish | a | 36 | 29 | 35 |
| b | 60 | 20 | 20 | |
| x | 48 | 24 | 28 | |
| E. cottoni | a | 31 | 15 | 54 |
| b | 0 | 7 | 93 | |
| x | 15 | 11 | 74 | |
| G. lichenoides | a | 0 | 0 | 100 |
| b | 0 | 0 | 100 | |
| x | 0 | 0 | 100 | |
| Broiler starter | a | 73 | 27 | 0 |
| b | 73 | 13 | 14 | |
| x | 73 | 20 | 7 | |
| Carp diet | a | 73 | 7 | 20 |
| b | 71 | 7 | 22 | |
| x | 72 | 7 | 21 | |
| RD1 diet | a | 60 | 20 | 20 |
| b | 87 | 13 | 0 | |
| x | 73 | 17 | 10 | |
| RD2 diet | a | 50 | 21 | 29 |
| b | 38 | 15 | 47 | |
| x | 44 | 18 | 38 | |
1 Active male or female refer to fish which readily release milt or eggs onhand stripping
Size range of active males (n = 95);
Body weight: Range 32.0 – 151.0 g, Mean 87.4 g, Standard Deviation 21.1 g
Body length: Range 14.3 – 21.7 cm, Mean 18.7 cm, Standard Deviation 1.4 cm
Condition factor: 10.9 – 17.3, Mean 13.2, Standard Deviation 1.6
Size range of active females (n = 28);
Body weight: Range 18.0 – 250.0 g, Mean 122.4 g, Standard Deviation 46.4 g
Body length: Range 11.7 – 22.6 cm, Mean 19.6 cm, Standard Deviation 2.4 cm
Condition factor: 11.2 – 21.6, Mean 15.7, Standard Deviation 2.2
Size range of non-active fish (n = 104);
Body weight: Range 20.8 – 175.0 g, Mean 60.3 g, Standard Deviation 38.5 g
Body length: Rnage 11.5 – 23.1 cm, Mean 16.6 cm, Standard Deviation 2.6 cm
Condition factor: 6.8 – 16.9, Mean 11.8, Standard Deviation 2.5
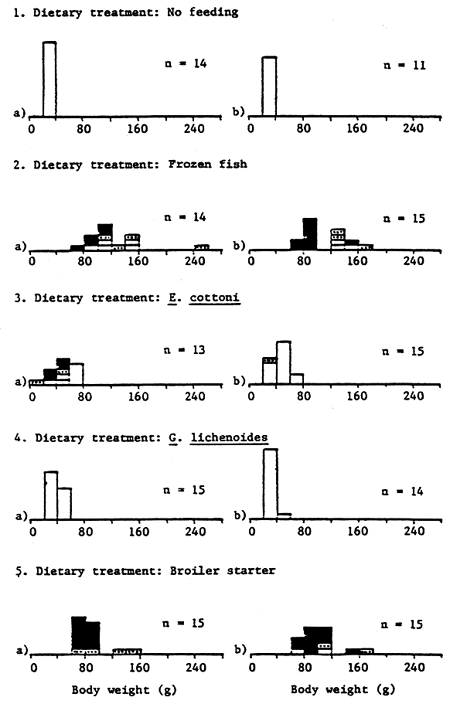
Figure 13. Body weight range of rabbit fish after 100 days
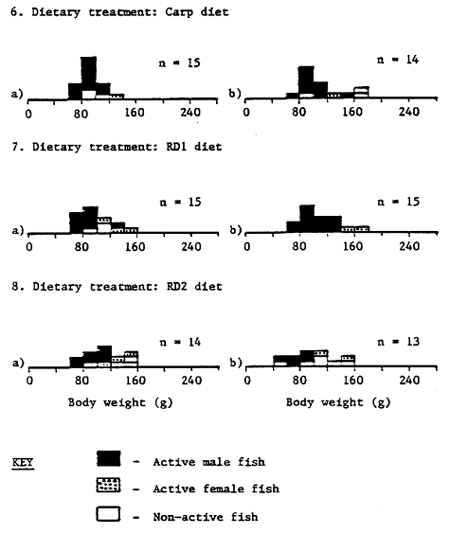
Figure 13. Body weight range of rabbit fish after 100 days
Despite the low fish production rates observed (due entirely to the under stocking of cages), all fish displayed good survival, with feed costs/kg fish biomass produced ranging from Rp 2124 for CP to Rp 5635 for FF (Table 7). The relatively high costs of production observed are a reflection of the poor food conversion efficiencies obtained with fish fed FF and dry formulated feeds.
Table 7. Overall cage production and survival of rabbit fish from day 0 to day 100
| Dietary treatment | Total fish biomass (kg/m3) | Total Survival (%) | Total food fed (kg) 1 | Cost/kg fish 2 | |||
| Initial | Final | Increase | |||||
| No feeding | a | 0.85 | 0.53 | - | 93.3 | - | - |
| b | 0.75 | 0.36 | - | 73.3 | - | - | |
| X | 0.80 | 0.44 | - | 83.3 | - | - | |
| Frozen fish | a | 0.91 | 1.75 | 0.84 | 93.3 | 12.39 | 5679 |
| b | 0.84 | 1.72 | 0.88 | 100 | 12.78 | 5591 | |
| X | 0.87 | 1.73 | 0.86 | 96.7 | 12.58 | 5635 | |
| E. cottoni | a | 0.74 | 0.65 | - | 93.3 | 33.37 | - |
| b | 0.72 | 0.75 | 0.03 | 100 | 32.75 | - | |
| X | 0.73 | 0.70 | - | 96.7 | 33.06 | - | |
| G. lichenoides | a | 0.75 | 0.60 | - | 100 | 25.10 | - |
| b | 0.75 | 0.53 | - | 93.3 | 23.39 | - | |
| X | 0.75 | 0.56 | - | 96.7 | 24.24 | - | |
| Broiler starter | a | 0.77 | 1.36 | 0.59 | 100 | 3.92 | 3109 |
| b | 0.89 | 1.61 | 0.72 | 100 | 3.97 | 2581 | |
| X | 0.83 | 1.48 | 0.65 | 100 | 3.94 | 2845 | |
| Carp diet | a | 0.73 | 1.51 | 0.78 | 100 | 2.70 | 1783 |
| b | 1.04 | 1.69 | 0.65 | 93.3 | 3.11 | 2464 | |
| X | 0.88 | 1.60 | 0.72 | 96.7 | 2.90 | 2124 | |
| RD1 diet | a | 0.62 | 1.55 | 0.93 | 100 | 3.17 | 2318 |
| b | 0.92 | 1.76 | 0.84 | 100 | 2.94 | 2380 | |
| X | 0.77 | 1.65 | 0.88 | 100 | 3.05 | 2349 | |
| RD2 diet | a | 1.05 | 1.67 | 0.62 | 93.3 | 2.85 | 2924 |
| b | 0.99 | 1.38 | 0.39 | 100 | 2.77 | 4517 | |
| X | 1.02 | 1.52 | 0.50 | 96.7 | 2.81 | 3720 | |
1 Total food fed on a ‘as fed’ basis
The best growth response and food conversion efficiency observed during the present feeding trial was for fish fed the dry RD1 crumble, closely followed by fish fed a dry commercial carp starter crumble and fish fed chopped frozen ‘food fish’. Although the observed growth response was generally below that obtained by other workers with fingerling S. canaliculatus cultured in floating net cages and fed moist pelleted diets (Horstmann, 1975; Yoshimitsu, Eda and Hiramatsu, 1986; Meyers et. al. 1989), these results are in line with previous growth studies with juvenile fish (Baga and Sacayanan, 1980). Figure 14 shows the reconstructed growth curve for rabbitfish (S. canaliculatus) based on the cage feeding trials which have been conducted at the National Seafarming Development Centre in Teluk Hurun. Although no controlled feeding studies have been carried out at Teluk Hurun with wild caught fry, Basyari and Tanaka (1988) reared S. canaliculatus fry from an initial body weight of 0.49g to a final weight of 4.26g in 50 days; animals fed to satiation four times daily on a dry commercial ‘sea bream’ crumble containing 58% crude protein. The ability of rabbitfish to feed directly on a dry formulated ration, with little or no training requirement and with no loss in growth, allows the farmer the flexibility of using commercially available animal feed lines and negates the handling problems of using fresh ‘food fish’ and preparing a moist ration on a daily basis. The current commercial feeding practice for rabbitfish in the Riau Archipelago and in the Republic of Singapore utilizes a mixture of chopped fresh fish, boiled white rice or stale bread, and live seaweed (Glude, 1982; Anon, 1986; Tiensongrusmee and Rais, 1989).
The negative growth response observed for rabbitfish fed live seaweed was surprising bearing in mind the supposedly herbivorous feeding habit of these species (Suyehiro, 1942; Gundermann, Popper and Lichatowich, 1983; Von Westernhagen, 1973, 1974). The results of recent feeding trials with S. canaliculatus have suggested that the dietary protein requirement for this species is above 30 percent; fish fed high dietary protein levels displaying faster growth than fish fed low protein diets or live seaweed (Bwathondi, 1982; Ismail, Wahyuni and Pangabean, 1986; Basyari and Tanaka, 1988; Meyers et. al. 1989). Furthermore, the fact that rabbitfish have also been reported to eat amphipods, copepods, sponges, foraminifera, crustaceans and brittle stars (Basyari, 1988; Bwathondi, 1982), suggests that these species may in fact be opportunistic omnivores.
Although the growth of S. canaliculatus is slower than that of S. guttatus and S. javus (Yoshimitsu, Eda and Hiramatsu, 1986; Figure 15), this species has the advantage (from a marketing viewpoint) that it matures earlier than the other siganid species; gravid fish being a very valuable and sought after commodity during the Chinese New Year (Anon, 1986). During the present feeding trial the minimum maturation size observed for male and female S. canaliculatus was 32g (14.3cm total length) and 18g (11.7cm total length), respectively (Table 6). By contrast, the minimum maturation size of S. guttatus is reported to be 200g for males and 250g (20 – 22cm length) for females (Soletchnik, 1984; Duray, 1987; Tanaka, Waspada and Sugama, 1989). Furthermore, Basyari (1988) and Yoshimitsu, Eda and Hiramatsu (1986) reported that the peak gonadic somatic index of this species at Teluk Banten (Serang, Indonesia) occurred during the month of September. It is perhaps not surprising therefore that the growth and feed efficiency of rabbitfish during the present culture trial deteriorated during the final month of the experiment (August) and was accompanied by a corresponding increase in the sexual activity of the fish.
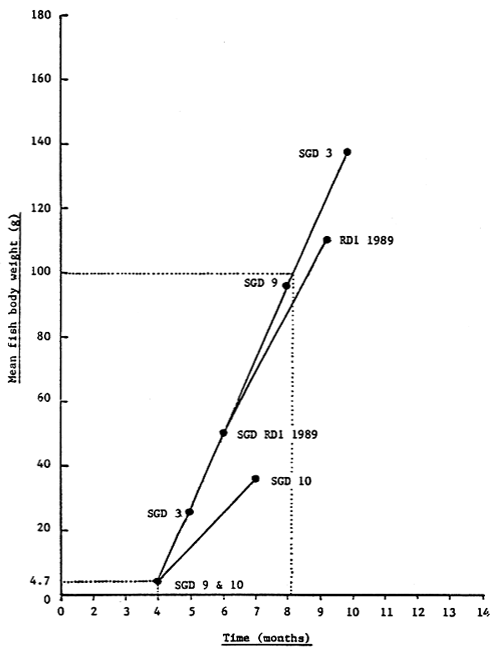
Figure 14. Reconstructed growth curve for rabbitfish (S. canaliculatus) fed artificial formulated diet within floating net cages at the National Seafarming Development Centre in Teluk Hurun based on past cage culture trials (Appendix 1)
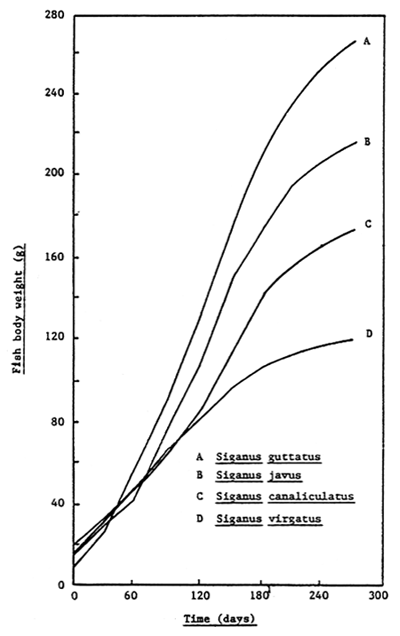
Figure 15. Growth of rabbitfish fed a moist pelleted diet (1:1, carp feed: trash fish mixture) in floating net cages at the Bojonegara Experimental Station, Serang, Indonesia (Yoshimitsu, Eda and Hiramatsu, 1986).
The market value of gravid S. canaliculatus in Singapore during the Chinese New Year is reported to be 16 to 30 Singapore dollars/kg (Rp 12,500 – 24,000/kg) and as high as 60 to 100 Singapore dollars/kg (Rp 48,000 – 80,000/kg) during Lunar New Years Eve (Anon, 1986; M. Mansar, Batam, Personal Communication, 28 September 1989). Clearly, when coupled with the relatively low feeding costs observed for this species during the present feeding trial (feeding costs ranging from Rp 2124 to 5635/kg fish produced; Table 7), the cage culture of S. canaliculatus must be considered as being potentially highly attractive. Not only can fish be reared to a market size of 100g in six to seven months from wild caught seed (Figure 14), but it can also be cultured at densities of up to 150 fish/m3 with no risk of cannibalism (Anon, 1989; Appendix 1). Furthermore, rabbitfish hold particular promise for the smallscale operator by virtue of their natural seed availability within Indonesian waters (Yoshimitsu, Eda and Hiramatsu, 1986) and ability to feed on a wide variety of low cost and locally available animal feed lines in dried form. It follows, however, that any attempt to expand the cage culture of S. canaliculatus in Indonesia must be preceded by an assessment of the size of the market for gravid fish during the Chinese New Year in Singapore and other neighboring countries, including Indonesia.