![]()
![]()
![]()
Development of economic feeding strategies for the on-growing of Asian seabass (Lates calcarifer) in floating net cages.
Six dietary feeding regimes were evaluated:
Three in-house diets were formulated from locally available feed ingredients. Brown fish meal was used as the main source of dietary protein in all diets. The main difference between the formulations was the addition of shrimp head meal, squid liver powder and suehiro UGF (prepared from dried distillers solubles) to diet RD2 as feed attractants. Both diets were formulated to contain 45% crude protein and 10% lipid. The formulation, proximate chemical composition and cost of the different diets tested is shown in Table 8.
Dry experimental diets were prepared as 2 – 3mm pellets as described previously (see section 2.2.1), with the exception that soy lecithin was also dissolved in fish oil prior to the addition of the vitamin premix. Moist pellets were prepared by blending the RD1 premix (containing vitamins and oil) with minced frozen fish, and then extruding the mixture through a 2 – 3mm diameter die plate. The resultant moist pellets were then stored in plastic containers within a freezer until fed.
Seabass fingerlings (ca. 6 – 9g in weight) were obtained from hatchery reared stock fish. Before the start of the feeding trial all stock fish had been weaned from a frozen minced fish diet to a dry diet crumble devoid of trash fish over a 30 to 40 day weaning period. Experimental fish were stocked at an initial density of thirty fish per cage, each cage measuring 1 × 1 × 1.5m ( 1 cubic meter water volume), having a half inch mesh size, and covered with bamboo matting. Two cages were allocated per dietary treatment and all cages housed on a single 6 × 6m floating raft (Figure 4).
Table 8. Formulation, proximate chemical composition and cost of the seabass/grouper test diets
| Formulation (%) | Diet code SBS/GPR | ||||
| RD1 | RD2 | MP 1 | FF 2 | SP 3 | |
| Brown fish meal | 75.0 | 66.0 | Moist pellet | Frozen fish | Shrimp pellet |
| Shrimp head meal | - | 5.0 | |||
| Squid liver powder 4 | - | 5.0 | |||
| Suehiro UGF 4 | - | 5.0 | |||
| Wheat middlings | 8.6 | 3.0 | |||
| Wheat flour | 10.0 | 10.0 | |||
| Zeolite | 0.75 | 0.75 | |||
| Fish oil 4 | 4.2 | 3.8 | |||
| Soy lecithin 4 | 0.75 | 0.75 | |||
| Choline chloride (50%) 4 | 0.40 | 0.40 | |||
| Vitamin premix AGJT/F1 4, 5 | 0.33 | 0.33 | |||
| Mineral premix AGJT/F1 4, 6 | 0.037 | 0.037 | |||
| Total | 100.067 | 100.067 | |||
| Percent national ingredients | 94.35 | 84.75 | |||
| Percent imported ingredients | 5.65 | 15.25 | |||
| Proximate composition (%, as fed basis) | |||||
| Moisture | 10.00 | 10.20 | 39.00 | 74.54 | 9.60 |
| Crude protein (N × 6.25) | 44.77 | 44.95 | 33.53 | 17.12 | 39.93 |
| Crude lipid | 9.75 | 11.79 | 5.24 | 3.30 | 4.50 |
| Crude fibre | 4.49 | 4.03 | 2.40 | - | 3.02 |
| Salt (NaCl) | 0.79 | 0.76 | 0.48 | 0.40 | 2.42 |
| Calcium (Ca) | 2.85 | 3.04 | 2.09 | 1.58 | 4.33 |
| Phosphorus (P) | 1.37 | 1.59 | 1.16 | 0.89 | 1.46 |
| Ash | 10.09 | 11.01 | 8.24 | 5.65 | 14.58 |
| Proximate composition (%, dry matter basis) | |||||
| Crude protein (N×6.25) | 49.74 | 50.05 | 54.97 | 67.24 | 44.17 |
| Crude lipid | 10.83 | 13.13 | 8.59 | 12.95 | 4.98 |
| Crude fibre | 4.99 | 4.49 | 3.93 | - | 3.34 |
| Salt (NaCl) | 0.88 | 0.85 | 0.78 | 1.56 | 2.68 |
| Calcium (Ca) | 3.17 | 3.38 | 3.43 | 6.22 | 4.79 |
| Phosphorus (P) | 1.52 | 1.77 | 1.90 | 3.50 | 1.61 |
| Ash | 11.21 | 12.26 | 13.51 | 22.20 | 16.13 |
| Diet cost (Rupiah/kg diet, as fed basis) 7 | |||||
| Total raw ingredient cost | 892 | 1073 | 675 | 350 | |
| National ingredient cost (%) | 82.7 | 64.3 | |||
| Imported ingredient cost (%) | 17.3 | 35.7 | |||
| Estimated processing/handling cost 8 | 178 | 215 | 135 | 35 | |
| Total diet cost | 1070 | 1288 | 810 | 385 | 1640 |
1 Moist pellet; frozen trash fish : diet RD1 (40:60 mixture, w/w)
2 Frozen fish; Splendid Pony fish Leiognathus splendens
3 Shrimp pellet; commercial shrimp finisher pellet No. 585 ( P.T. Agro Utama Corporation, Jakarta)
4 Imported feed ingredients
5 Vitamin premix AGJT/F1 supplies per kilogram of dry diet; vitamin A 4000 IU, vitamin D3 2000 IU, vitamin E 200 mg, vitamin K3 8 mg, thiamine 32 mg, riboflavin 40 mg, pyridoxine 32 mg, pantothenic acid 120 mg, nicotinic acid 160 mg, biotin 0.4 mg, folic acid 8 mg, vitamin B12 0.04 mg, inositol 300 mg, vitamin C 300 mg
6 Mineral premix AGJT/F1 supplies per kilogram of dry diet; iron 30 mg, zinc 50 mg, manganese 25 mg, copper 3 mg, cobalt 0.5 mg, iodine 3 mg, trivalent chromium 0.25 mg, selenium 0.10 mg
7 28th October 1989; Rupiah 1790 = 1 US $
8 Based on a 20% handling/processing cost for in-house pelleted diets (excluding profit margin) and a 10% handling/freezer storage cost for frozen fish
All experimental diets were fed by hand to satiation twice daily as described previously (section 2.2.2). Fish were weighed and measured under anaesthesia at the start of the experiment and at successive monthly intervals for the duration of the feeding trial. The feeding trial was divided into two parts; day 0 to day 100 (all dietary treatments), and day 100 to day 156 (diet Ff and MP only). Fish mortalities were recorded whenever apparent and on the final day of the experiment all fish were sacrificed from each cage as described previously (section 2.2.2). For treatments FF and MP which were continued for 156 days, five fish were sacrificed from each cage after 100 days for proximate chemical analysis.
Water quality was determined as described previously (section 2.2.2) and is shown in Figure 5 (day 0 – 100) and Figure 16 (day 0 – 156).
All chemical and statistical measurements were performed as described previously (for details see section 2.2.3 and 2.2.4).
Figure 16. Water quality within the experimental cages over the 156-day feeding trial
The mean growth response of seabass over the 100 day feeding period is shown in Figures 17–18 and Table 9. Treatments fed frozen fish (FF) and moist pellet (MP) displayed the best growth response; fish having a significantly higher (p < 0.05) final body weight and length, and a higher daily weight gain and specific growth rate than all other dietary treatments. Although there was no significant difference (p < 0.05) between the final body weight of fish fed the commercial shrimp pellet (SP) and diet RD2 (RD2), the final body weight and length of fish fed RD2 was significantly higher (p < 0.05) than that of fish fed diet RD1 (RD1, Table 9). Interestingly, the final body weight of fish receiving no exogenous dietary feed input decreased by only 18.2% over the 100 day trial period.
The feeding response of seabass over the 100 day feeding period is shown in Figures 19 – 24 and Table 10. With the exception of fish fed RD1 and RD2, all fish soon became accustomed to accepting the experimental diets and fed aggressively for the duration of the feeding trial. Due to the unintended floating properties of diet RD1 and RD2 fish fed these rations were almost always very nervous when feeding; fish hiding at the bottom of the cage and nervously darting up to the water surface in single file to ingest pellets rather than moving together in a well coordinated feeding response. Consequently, it was only during the final month of the feeding trial that fish fed RD2 and to a lesser extent RD1 displayed a moderate to good feeding response. By contrast, fish fed the high density sinking shrimp pellet (SP) displayed a good feeding response throughout the 100 day feeding period.
The highest dry matter feed intake was observed for fish fed MP and FF, and the lowest for fish fed RD1 (Table 10). Fish fed RD2 displayed a 20 – 30% higher feed intake than fish fed RD1. Interestingly, the observed correlation coefficient between dietary feed intake and fish body weight was also highest for fish fed FF and MP, and lowest for fish fed the dry compound diets (Figure 22 – 23). As expected, the percentage dietary feed intake of fish on all dietary treatments decreased with increasing fish body weight.
Fish handling and routine cage maintenance activities had a negative effect on the subsequent dietary feed intake of fish; fish usually requiring at least one day before restoring a good feeding response (Figure 19 – 21). There was no noticeable difference between the feed consumption of fish in the morning or afternoon.
Figure 17. Growth response of seabass after 100 days
Figure 18. Body weight range of seabass after 100 days
Table 9. Growth performance of seabass from day 0 to day 100
| Dietary treatment | FF | MP | NF | SP | RD1 | RD2 | ± SE 1. | |
| Size and shape | ||||||||
| Initial body weight (g) | a | 9.5 | 9.8 | 9.2 | 6.0 | 7.8 | 9.2 | |
| b | 8.3 | 7.3 | 6.3 | 7.7 | 6.7 | 8.3 | ||
| x | 8.9 | 8.5 | 7.7 | 6.8 | 7.2 | 8.7 | ||
| Initial total body length (cm) | a | 9.3 | 9.0 | 8.3 | 7.4 | 8.0 | 7.7 | |
| b | 8.7 | 7.8 | 8.0 | 8.1 | 7.4 | 8.0 | ||
| x | 9.0 | 8.4 | 8.1 | 7.7 | 7.7 | 7.8 | ||
| Final body weight (g) | a | 181.7 | 159.0 | 6.1 | 65.2 | 76.1 | 86.0 | |
| b | 172.6 | 168.1 | 6.6 | 108.9 | 70.9 | 102.5 | ||
| x | 177.1 d | 163.5 d | 6.3 a | 87.0 bc | 73.5 b | 94.2 c | 5.98 | |
| Final total body length (cm) | a | 21.6 | 20.6 | 8.3 | 16.0 | 16.9 | 17.7 | |
| b | 20.8 | 21.2 | 8.1 | 18.7 | 16.7 | 18.5 | ||
| x | 21.2 d | 20.9 d | 8.2 a | 17.3 b | 16.8 b | 18.1 c | 0.23 | |
| Fish condition factor (final) 2 | a | 16.5 | 15.1 | 10.8 | 14.8 | 14.4 | 14.3 | |
| b | 15.5 | 15.6 | 12.2 | 15.6 | 14.5 | 14.8 | ||
| x | 16.0 d | 15.3 c | 11.5 a | 15.2 c | 14.4 b | 14.5 b | 0.21 | |
| Growth response | ||||||||
| Total weight gain (%) | a | 1813 | 1522 | - | 987 | 876 | 835 | |
| b | 1979 | 2203 | - | 1314 | 958 | 1135 | ||
| x | 1896 | 1862 | - | 1150 | 917 | 985 | ||
| Mean weight gain (%/day) | a | 18.13 | 15.22 | - | 9.87 | 8.76 | 8.35 | |
| b | 19.79 | 22.03 | - | 13.14 | 9.58 | 11.35 | ||
| x | 18.96 | 18.62 | - | 11.50 | 9.17 | 9.85 | ||
| Mean daily weight gain (g/fish/day) | a | 1.72 | 1.49 | - | 0.59 | 0.68 | 0.77 | |
| b | 1.64 | 1.61 | - | 1.01 | 0.64 | 0.94 | ||
| x | 1.68 | 1.55 | - | 0.80 | 0.66 | 0.85 | ||
| Specific growth rate (%/day) 3 | a | 2.95 | 2.79 | - | 2.39 | 2.28 | 2.23 | |
| b | 3.03 | 3.14 | - | 2.65 | 2.36 | 2.51 | ||
| x | 2.99 | 2.96 | - | 2.52 | 2.32 | 2.37 | ||
1 Standard error, calculated from residual mean square in the analysis of variance
2 Condition factor = Final fish body weight (g) / Final fish total body length (cm)3, x 1000
3 Specific growth rate = Log e Final fish body weight (g) - Log e Initial fish body weight (g) /Time (days), x 100
abc Mean values for components with the same superscripts are not significantly (p<0.05) different
Figure 19. Daily feed intake of seabass fed frozen fish and a moist pellet ration from day 0 to day 100
Figure 20. Daily feed intake of seabass fed shrimp finisher pellet and RD1 pellet from day 0 to day 100
Figure 21. Daily feed intake of seabass fed RD2 pellet from day 0 to day 100
1) Dietary treatment: Frozen fish (SBS)
Figure 22. Relationship between percentage daily food intake and body weight of seabass from day 0 to day 100
Figure 23 Relationship between percentage daily food intake and body weight of seabass from day 0 to day 100
5) Dietary treatment: RD2 pellet (SBS)
Figure 24 Relationship between percentage daily food intake and body weight of seabass from day 0 to day 100
Table 10. Feed intake and diet utilization efficiency of seabass from day 0 to day 100
| Dietary treatment | FF | MP | NF | SP | RD1 | RD2 | |
| Feeding response | |||||||
| Total feed intake (as fed, g/fish) | a | 635 | 285 | - | 113 | 126 | 138 |
| b | 632 | 301 | - | 157 | 122 | 154 | |
| X | 633 | 293 | - | 135 | 124 | 146 | |
| Daily feed intake (as fed, g/fish) | a | 6.35 | 2.85 | - | 1.13 | 1.26 | 1.38 |
| b | 6.32 | 3.01 | - | 1.57 | 1.22 | 1.54 | |
| X | 6.33 | 2.93 | - | 1.35 | 1.24 | 1.46 | |
| Daily feed intake (dry matter, g/fish) | a | 1.62 | 1.74 | - | 1.02 | 1.13 | 1.24 |
| b | 1.61 | 1.84 | - | 1.42 | 1.10 | 1.38 | |
| X | 1.61 | 1.79 | - | 1.22 | 1.11 | 1.31 | |
| Feed utilization | |||||||
| Food conversion ratio (as fed) 1 | |||||||
Week 0 – 4 | a | 2.95 | 1.55 | - | 1.72 | 1.71 | 1.49 |
| b | 3.51 | 1.66 | - | 1.32 | 1.91 | 1.67 | |
| X | 3.23 | 1.61 | - | 1.52 | 1.81 | 1.58 | |
Week 4 – 8 | a | 3.39 | 1.68 | - | 1.60 | 1.72 | 1.77 |
| b | 3.46 | 1.55 | - | 1.33 | 1.80 | 1.49 | |
| X | 3.42 | 1.61 | - | 1.46 | 1.76 | 1.63 | |
Week 8 – 12 | a | 3.67 | 1.84 | - | 1.92 | 1.96 | 2.01 |
| b | 3.52 | 1.98 | - | 1.63 | 1.87 | 1.76 | |
| X | 3.59 | 1.91 | - | 1.77 | 1.91 | 1.88 | |
Week 12 – 100 days | a | 4.92 | 2.92 | - | 2.35 | 1.86 | 2.31 |
| b | 6.71 | 2.25 | - | 1.86 | 2.11 | 1.61 | |
| X | 5.81 | 2.58 | - | 2.10 | 1.98 | 1.96 | |
| Overall food conversion ratio | |||||||
Week 0 – 100 days (as fed) | a | 3.69 | 1.91 | - | 1.91 | 1.85 | 1.79 |
| b | 3.85 | 1.87 | - | 1.87 | 1.91 | 1.64 | |
| X | 3.77 | 1.89 | - | 1.73 | 1.88 | 1.71 | |
| Overall food conversion ratio | |||||||
Week 0 – 100 days (dry matter) 2 | a | 0.94 | 1.17 | - | 1.73 | 1.66 | 1.61 |
| b | 0.98 | 1.14 | - | 1.41 | 1.72 | 1.47 | |
| X | 0.96 | 1.15 | - | 1.57 | 1.69 | 1.54 | |
| Protein efficiency ratio 3 | a | 1.58 | 1.55 | - | 1.31 | 1.20 | 1.24 |
| b | 1.52 | 1.59 | - | 1.61 | 1.16 | 1.36 | |
| X | 1.55 | 1.57 | - | 1.46 | 1.18 | 1.30 | |
| Apparent net protein utilization 4 | a | 30.40 | 30.96 | - | 24.20 | 22.30 | 23.65 |
| b | 30.27 | 30.78 | - | 28.89 | 21.64 | 25.58 | |
| X | 30.33 | 30.87 | - | 26.54 | 21.97 | 24.61 | |
1 Food conversion ratio (as fed) = Feed intake (as fed basis, g) / Live weight gain (wet basis, g)
2 Food conversion ratio (dry matter basis) = Feed intake (dry matter basis, g) / Live weight gain(wet basis, g)
3 Protein efficiency ratio = Live weight gain (wet basis, g) / Dietary crude protein intake (g)
4 Apparent net protein utilization = Fish tissue crude protein deposition (g) / Dietary crude proteinintake (g), × 100
The feed utilization efficiency of fish over the 100 day period is shown in Table 10. As expected the best feed utilization efficiency was observed for fish fed FF and MP, and the lowest for fish fed RD1. Of particular interest was the steady deterioration in the food conversion ratio of fish as the experiment progressed, irrespective of dietary treatement (Table 10).
With the exception of fish receiving no exogenous dietary feed input (NF), there was no noticeable difference between treatments on the basis of their proximate carcass composition at the end of the 100 day feeding period (Table 11). The carcass composition of NF fish was typical of a starving animal, with elevated carcass moisture content and decreased carcass lipid and protein content. The fact that the initial carcass composition of fish was similar to that of the NF treatment indicates that the nutritional status and overall condition of the ‘weaned’ fish at the start of the feeding trial was poor.
The mortality record and survival of fish over the 100 day feeding period is shown in Table 12 and Figure 25. As expected, fish fed FF and MP displayed the highest survival rate (mean of 93.3%) and NF the lowest (mean 11.6%). The survival rate of fish fed dry pelleted feeds was generally poor, ranging from 73.3% (RD2) to 85.0% (SP).
Total cage biomass increase for fish fed FF and MP (4.32 – 4.70kg/m3) was more than double that of fish fed the dry pelleted diets (1.48 – 2.07) over the 100 day feeding period (Table 13). Similarly, feed costs/kg of fish produced were lowest for FF (Rp 1456), followed by MP (Rp 1537), RD1 (Rp 2076), RD2 (Rp 2304) and SP (Rp 2898; Table 13).
Table 11 Carcass composition of seabass at the start and end of the 100 day feeding trial
| Treatment 1 | Initial | After 100 days | ||||||
| FF | MP | NF | SP | RD1 | RD2 | |||
| Composition (% wet weight) | ||||||||
| Moisture | a | 69.58 | 69.60 | 70.86 | 70.96 | 72.24 | ||
| b | 68.71 | 69.84 | 70.50 | 70.69 | 70.68 | |||
| X | 76.64 | 69.15 | 69.72 | 77.96 2 | 70.68 | 70.83 | 71.46 | |
| Crude protein | a | 19.02 | 19.59 | 18.21 | 18.16 | 18.76 | ||
| b | 19.74 | 19.17 | 17.76 | 18.18 | 18.57 | |||
| x | 15.92 | 19.38 | 19.38 | 14.41 2 | 17.99 | 18.17 | 18.67 | |
| Lipid | a | 6.85 | 6.09 | 5.20 | 4.71 | 2.90 | ||
| b | 5.06 | 5.37 | 6.29 | 5.27 | 5.07 | |||
| X | 2.03 | 5.96 | 5.73 | 0.58 2 | 5.75 | 4.99 | 3.99 | |
| Ash | a | 5.34 | 5.35 | 4.77 | 5.58 | 5.62 | ||
| b | 5.61 | 5.24 | 4.64 | 5.46 | 5.56 | |||
| X | 4.92 | 5.48 | 5.30 | 6.16 2 | 4.71 | 5.52 | 5.59 | |
| Calcium | a | 1.90 | 2.02 | 1.72 | 2.01 | 1.97 | ||
| b | 2.04 | 1.82 | 1.74 | 1.82 | 1.87 | |||
| X | 1.56 | 1.92 | 1.97 | 2.19 2 | 1.73 | 1.92 | 1.92 | |
| Phosphorus | a | 0.92 | 1.00 | 0.83 | 1.08 | 0.96 | ||
| b | 0.97 | 0.91 | 0.83 | 1.02 | 0.94 | |||
| X | 0.82 | 0.94 | 0.95 | 1.00 2 | 0.83 | 1.05 | 0.95 | |
1 FF - Frozen fish, MP - Moist pellet, NF - No feeding, BP - Shrimp pellet, RD1 - RD1 pellet, RD2 - RD2 pellet
2 Pooled sample due to small quantity of fish biomass available
Table 12. Mortality record and survival of seabass from day 0 to day 100
| Dietary treatment | Mortality record (fish No./cage) 1 | Survival (%) | ||||
| Total | Observed | Cannibalism | ||||
| Frozen fish | a | 1 | 0 | 1 | 96.7 | |
| b | 3 | 0 | 3 | 90.0 | ||
| X | 93.3 | |||||
| Moist pellet | a | 1 | 1 | 0 | 96.7 | |
| b | 3 | 2 | 1 | 90.0 | ||
| X | 93.3 | |||||
| No feeding | a | 26 | 20 | 6 | 13.3 | |
| b | 27 | 10 | 17 | 10.0 | ||
| X | 11.6 | |||||
| Shrimp pellet | a | 7 | 5 | 2 | 76.7 | |
| b | 2 | 2 | 0 | 93.3 | ||
| X | 85.0 | |||||
| RD1 pellet | a | 7 | 6 | 1 | 76.7 | |
| b | 7 | 5 | 2 | 76.7 | ||
| X | 76.7 | |||||
| RD2 pellet | a | 10 | 1 | 9 | 66.7 | |
| b | 6 | 4 | 2 | 80.0 | ||
| X | 73.3 | |||||
Figure 25. Survival curve of seabass from day 0 to day 100
Table 13. Overall cage production of seabass from day 0 to day 100
| Dietary treatment | Total fish biomass (kg/m3) | Total food fed (kg) 1 | Cost/kg fish 2 | |||
| Initial | Final | Increase | ||||
| Frozen fish | a | 0.28 | 5.27 | 4.99 | 18.42 | 1421 |
| b | 0.25 | 4.66 | 4.41 | 17.08 | 1491 | |
| X | 0.26 | 4.96 | 4.70 | 17.75 | 1456 | |
| Moist pellet | a | 0.29 | 4.61 | 4.32 | 8.26 | 1549 |
| b | 0.22 | 4.54 | 4.32 | 8.14 | 1526 | |
| X | 0.25 | 4.57 | 4.32 | 8.20 | 1537 | |
| No feeding | a | 0.27 | 0.02 | - | - | |
| b | 0.19 | 0.02 | - | - | ||
| X | 0.23 | 0.02 | - | - | ||
| Shrimp pellet | a | 0.18 | 1.50 | 1.32 | 2.60 | 3230 |
| b | 0.23 | 3.05 | 2.82 | 4.41 | 2565 | |
| X | 0.20 | 2.27 | 2.07 | 3.50 | 2898 | |
| RD1 pellet | a | 0.23 | 1.75 | 1.52 | 2.91 | 2048 |
| b | 0.20 | 1.63 | 1.43 | 2.81 | 2103 | |
| X | 0.21 | 1.69 | 1.48 | 2.86 | 2076 | |
| RD2 pellet | a | 0.27 | 1.72 | 1.45 | 2.76 | 2452 |
| b | 0.25 | 2.46 | 2.21 | 3.70 | 2156 | |
| X | 0.26 | 2.09 | 1.83 | 3.23 | 2304 | |
1 Total food fed on a ‘as fed’ basis
2 Cost in Rupiah (Rp) of feed per kg of fish produced:
Trash fish - total diet cost Rp 385/kg
Moist pellet - total diet cost Rp 810/kg
Shrimp pellet - total diet cost Rp 1640/kg
RD1 pellet - total diet cost Rp 1070/kg
RD2 pellet - total diet cost Rp 1288/kg
Conversion factor: 1 US $ = 1790 Rp (28 October 1989)
The growth response and final body weight range of fish fed FF and MP is shown in Tables 14 – 15 and Figure 26 and 31. Although there was no significant difference (p < 0.05) between treatments on the basis of mean final body weight and lenght, fish fed FF had a significantly higher final body condition factor (Table 14).
The feed intake of fish for the remainder of the feeding trial and over the whole 156 day experiment is shown in Table 16 and Figures 27 to 30, respectively. All fish in both treatments exhibited signs of nervousness during the final 56 day feeding period; fish on certain days eating very well and on other days being extremely nervous and consequently eating little or not at all (Figure 27 – 28). Although it is not known why fish displayed this erratic nervous behavior, it was not thought to be diet related. Interestingly, the dry matter feed intake of both treatments was of the same order of magnitude with increasing fish body weight, although the dry matter feed intake of fish fed MP was always consistently higher than that of fish fed FF (Figure 30).
The feed utilization efficiency of both treatments was noticeably poorer over the final 56 days of the feeding trial (Table 16). Of particular importance was the gradual deterioration in food conversion efficiency of both treatments over the course of the 156 day culture period (Figure 32).
As expected, there was no noticeable difference between treatments on the basis of their proximate carcass composition at the end of the 156 day feeding trial (Table 17). In view of the observed deterioration in feed efficiency, feed cost/kg fish produced increased significantly for both treatments during the final 56 day feeding period; feeding costs increasing to Rp 2584 for MP and Rp 1964 for FF (Table 18). No fish mortalities were observed over the final 56 day reporting period.
Figure 26. Growth performance of seabass after 156 days
Table 14. Growth performance of seabass from day 100 to day 156
| Dietary treatment | Frozen fish | Moist pellet | ± SE 1 | |
| Size and shape | ||||
| Initial body weight (g) | a | 184.8 | 164.4 | |
| b | 180.0 | 172.4 | ||
| X | 182.4 a | 168.4 a | 6.80 | |
| Final body weight (g) | a | 292.9 | 230.0 | |
| b | 278.2 | 285.0 | ||
| X | 285.5 a | 257.5 a | 11.27 | |
| Final total body length (cm) | a | 27.1 | 25.5 | |
| b | 26.2 | 27.2 | ||
| X | 26.7 a | 26.3 a | 0.36 | |
| Fish condition factor (final) 2 | a | 14.3 | 13.7 | |
| b | 15.0 | 13.9 | ||
| X | 14.6 b | 13.8 a | 0.11 | |
| Growth response | ||||
| Total weight gain (%) | a | 58.5 | 39.9 | |
| b | 54.5 | 65.3 | ||
| X | 56.5 | 52.6 | ||
| Mean weight gain (%/day) | a | 1.04 | 0.71 | |
| b | 0.97 | 1.17 | ||
| X | 1.00 | 0.94 | ||
| Mean daily weight gain (g/fish/day) | a | 1.93 | 1.17 | |
| b | 1.75 | 2.01 | ||
| X | 1.84 | 1.59 | ||
| Specific growth rate (%/day) 3 | a | 0.82 | 0.60 | |
| b | 0.78 | 0.90 | ||
| X | 0.80 | 0.75 | ||
1 Standard error, calculated from residual mean square in the analysis of variance
2 Condition factor = Final fish body weight (g) / Final fish total body length (cm)3,× 1000
abc Mean values for components with the same superscripts are not significantly(p<0.05) different
Table 15. Overall growth response of seabass from day 0 to day 156
| Dietary treatment | Frozen fish | Moist pellet | ± SE 1 | |
| Initial body weight (g) | a | 9.5 | 9.8 | |
| b | 8.3 | 7.3 | ||
| X | 8.9 | 8.5 | ||
| Final body weight (g) | a | 292.9 | 230.0 | |
| b | 278.2 | 285.0 | ||
| X | 285.5 a | 257.5 a | 11.27 | |
| Total weight gain (%) | a | 2983 | 2247 | |
| b | 3252 | 3804 | ||
| X | 3117 | 3025 | ||
| Mean weight gain (%/day) | a | 19.12 | 14.40 | |
| b | 20.84 | 24.38 | ||
| X | 19.98 | 19.39 | ||
| Mean weight gain (g/fish/day) | a | 1.82 | 1.41 | |
| b | 1.78 | 1.78 | ||
| X | 1.80 | 1.59 | ||
| Specific growth rate (%/day) 2 | a | 2.20 | 2.02 | |
| b | 2.25 | 2.35 | ||
| X | 2.22 | 2.18 |
1 Standard error, calculated from residual mean square in the analysis of variance
2 Specific growth rate = Log e Final body weight - Log e Initial body weight / Time(days), × 100
abc Mean values for components with the same superscripts are not significantly(p<0.05) different
Table 16. Feed intake and diet utilization efficiency of seabass from day 100 to day 156
| Dietary treatment | Frozen fish | Moist pellet | |
| Feeding response | |||
| Total feed intake (as fed, g/fish) | a | 551 | 225 |
| b | 500 | 334 | |
| X | 525 | 279 | |
| Daily feed intake (as fed, g/fish) | a | 9.84 | 4.01 |
| b | 8.93 | 5.97 | |
| X | 9.38 | 4.99 | |
| Daily feed intake (dry matter, g/fish) | a | 2.51 | 2.45 |
| b | 2.27 | 3.64 | |
| X | 2.39 | 3.04 | |
| Feed utilization | |||
| Food conversion ratio (as fed basis) 1 | |||
Day 100 – 128 | a | 4.70 | 3.38 |
| b | 5.95 | 2.67 | |
| x | 5.32 | 3.02 | |
Day 128 – 156 | a | 5.63 | 3.43 |
| b | 4.48 | 3.38 | |
| x | 5.05 | 3.43 | |
| Overall food conversion ratio | |||
Day 100 – 156 (as fed basis) | a | 5.10 | 3.43 |
| b | 5.10 | 2.97 | |
| X | 5.10 | 3.20 | |
| Overall food conversion ratio | |||
Day 100 – 156 (dry matter basis) 2 | a | 1.30 | 2.09 |
| b | 1.30 | 1.81 | |
| X | 1.30 | 1.95 | |
| Protein efficiency ratio 3 | a | 1.14 | 0.87 |
| b | 1.15 | 1.00 | |
| X | 1.14 | 0.93 | |
| Apparent net protein utilization 4 | a | 26.27 | 17.15 |
| b | 23.13 | 20.09 | |
| X | 24.70 | 18.62 | |
1 Food conversion ratio (as fed) = Feed intake (as fed basis, g) / Live weight gain (g)
2 Food conversion ratio (dry matter) = Feed intake (dry matter basis, g) / Live weightgain (wet weight basis, g)
3 Protein efficiency ratio = Live weight gain (wet basis, g) / Dietary protein intake (g)
4 Apparent net protein utilization = Fish tissue crude protein deposition (g) / Dietarycrude protein intake (g), × 100
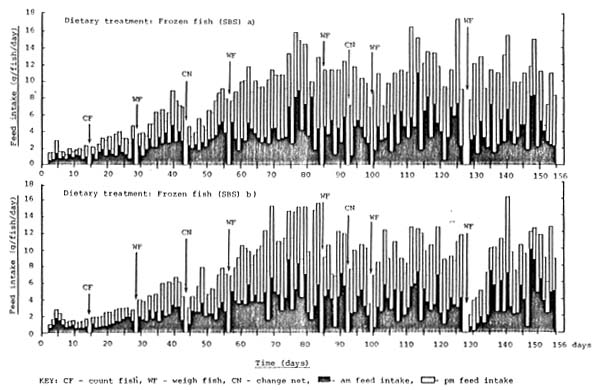
Figure 27 . Daily feed intake of seabass fed a frozen fish diet from day 0 to day 156
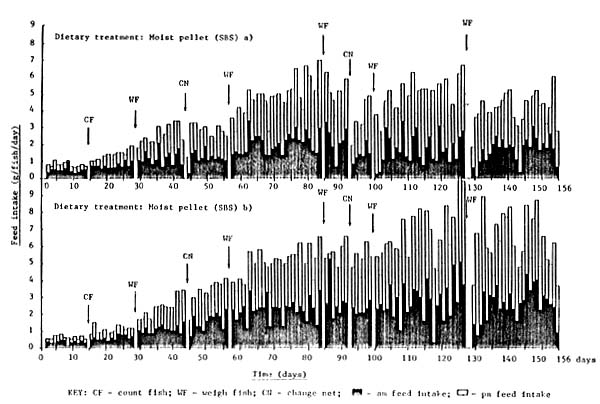
Figure 28 . Daily feed intake of seabass fed a moist pellet ration from day 0 to day 156
Figure 29 . Relationship between percentage daily food intake (as fed basis) and body weight of seabass from day 0 to day 156
Figure 30 . Relationship between percentage daily dry matter food intake and body weight of seabass from day 0 to day 156
Table 17 . Carcass composition of seabass fed frozen fish and moist pellet after 0, 100 and 156 days
| Component | Initial | Frozen fish | Moist pellet | |||
| Day 100 | Day 156 | Day 100 | Day 156 | |||
| Composition (% wet weight) | ||||||
| Moisture | a | 69.58 | 70.24 | 69.60 | 68.93 | |
| b | 68.71 | 69.98 | 69.84 | 68.12 | ||
| x | 76.64 | 69.15 | 70.11 | 69.72 | 68.53 | |
| Crude protein | a | 19.02 | 20.46 | 19.59 | 19.63 | |
| b | 19.74 | 19.89 | 19.17 | 19.49 | ||
| x | 15.92 | 19.38 | 20.18 | 19.38 | 19.56 | |
| Lipid | a | 6.85 | 3.78 | 6.09 | 2.43 | |
| b | 5.06 | 5.27 | 5.37 | 7.21 | ||
| x | 2.03 | 5.96 | 4.53 | 5.73 | 4.82 | |
| Ash | a | 5.34 | 5.40 | 5.35 | 6.26 | |
| b | 5.61 | 5.34 | 5.24 | 5.09 | ||
| x | 4.92 | 5.48 | 5.37 | 5.30 | 5.68 | |
| Calcium | a | 1.90 | 1.83 | 2.02 | 2.55 | |
| b | 2.04 | 1.91 | 1.82 | 1.95 | ||
| x | 1.56 | 1.97 | 1.87 | 1.92 | 2.25 | |
| Phosphorus | a | 0.92 | 0.92 | 1.00 | 1.03 | |
| b | 0.97 | 0.91 | 0.91 | 0.89 | ||
| x | 0.82 | 0.94 | 0.91 | 0.95 | 0.96 | |
Table 18. Overall cage production of seabass from day 100 to day 156 1
| Dietary treatment | Total fish biomass (kg/m3) | Total food fed (kg) 2 | Cost/kg fish 3 | |||
| Initial | Final | Increase | ||||
| Frozen fish | a | 4.44 | 7.03 | 2.59 | 13.23 | 1967 |
| b | 3.96 | 6.12 | 2.16 | 11.00 | 1961 | |
| x | 4.20 | 6.57 | 2.37 | 12.11 | 1964 | |
| Moist pellet | a | 3.94 | 5.52 | 1.58 | 5.39 | 2763 |
| b | 3.79 | 6.27 | 2.48 | 7.36 | 2404 | |
| x | 3.86 | 5.89 | 2.03 | 6.37 | 2584 | |
1 No fish mortalities observed over the 56 day reporting period
2 Total food fed on a ‘as fed’ basis
3 Cost in Rupiah (Rp) of feed per kg of fish produced:
Frozen fish - total diet cost Rp 385/kg
Moist pellet - total diet cost Rp 810/kg
Conversion factor: 1 US S = 1790 Rp ( 28 October, 1989)
Dietary treatment: Frozen fish (SBS)
Figure 31 . Body weight range of seabass after 156 days
Figure 32 . Food conversion ratio of seabass over the course of the 156 day feeding trial
The best growth response and feed efficiency was observed for seabass fed the frozen fish (FF) and moist pellet diet (MP). Fish fed FF and MP grew from an initial weight of 8.9g and 8.5g to a final weight of 285.5g and 257.5g in 156 days, with a food conversion ratio of 3.77 – 5.10 (dry matter basis 0.96 – 1.30) and 1.89 – 3.20 (dry matter basis 1.15 – 1.95), and with a survival of 93.3% and 93.3%, respectively. These results are in line with previous cage feeding studies with juvenile seabass fed ‘trash fish’ (Eng, Hooi and Wang, 1985; New, 1986; Yoshimitsu, Eda and Hiramatsu, 1986; Sakaras, 1987; Chou, 1988; Tookwinas and Charearnrid, 1988; Wong and Chou, 1989) and artificial moist diets (New, 1986; Chou, Wong and Lee, 1987, Chou, 1988). The food conversion efficiencies observed during the current feeding trial are a considerable improvement on those recorded previously at Teluk Hurun; past food conversion ratios for seabass fed frozen fish or a moist pellet ranging from 7.6 to 11.2 and 15 to 20, respectively (Anon, 1989; Appendix 1). This improvement was due almost entirely to the introduction of new feed management techniques; the success of a dietary feeding regime depending more often than not on the handling and feeding of the finished feed to the fish on the farm.
Figure 33 shows the reconstructed growth curve for seabass fed a frozen fish ration based on the cage culture trials which have been conducted at the National Seafarming Development Centre at Teluk Hurun. On the basis of this growth curve it would take 6.4 months or 10.3 months to rear seabass fingerlings from an initial weight of 8.9g to a market size of 500g or 1000g, respectively. Since no published information exists on the growth response of 250g fish fed a moist pelleted feed , it is not possible at the present time to construct a similar growth curve for seabass fed a moist pelleted ration. From an economic viewpoint the use of frozen fish and to a lesser extent a moist pellet would appear to be a highly attractive proposition for the cage operator. During the present cage trial the estimated feeding cost/kg fish produced ranged from Rp 1458 to Rp 1964 and Rp 1537 to Rp 2584 for fish fed frozen fish and moist pellet, respectively. The market value of live and fresh seabass in Singapore is reported to be approximately 11 Sing.$/kg (Rp 10,175) and 7 Sing.$/kg (Rp 6475), respectively (P. Gaiger, Personal Communication, Singapore, 24 April 1989). However, the apparent gradual deterioration in feed efficiency observed for fish fed frozen fish or moist pellet over the course of the present feeding trial (Figure 32) is considerable cause for concern and could have a profound effect on the economic viability of the cage culture system; feeding cost/kg fish produced increasing with increasing fish size. Although this observation remains to be confirmed (it may only have been due to poor feed management during the final stages of the feeding trial), a similar deterioration in feed efficiency with age has also been reported in poultry (Dr. K. Hazen, P.T. Charoen Pokphand Indonesia Animal Feedmill Co., Personal Communication, Jakarta, 27 October 1989). At present, the preferred market size for farmed seabass in South East Asia is between 500g and 800g (Cheong, 1989).
Figure 33 . Reconstructed growth curve for seabass fed a frozen fish ration within floating net cages at the National Seafarming Development Centre in Teluk Hurun based on past cage culture trials (SBS 1 – 6; Appendix 1) and the present culture trial (SBS 1989).
Although most commercial cage operators in S.E. Asia still employ a ‘food fish’ or ‘trash fish’ feeding regime (Indonesia -Tiensongrusmee and Rais, 1989; Thailand - Tookwinas and Charearnrid, 1988; Malaysia - Eng, Hooi and Wang, 1985; Singapore -Cheong and Yeng, 1987), some farmers in Singapore have started to produce their own in-house moist pelleted feed with encouraging results (Chou, 1988). Of particular interest, however, has been the exciting results obtained with the use of dry pelleted diets by researchers in Singapore (Chou, 1984, 1985; Chou, Wong and Lee, 1987), Tahiti (Fuchs, 1987) and Australia (MacKinnon, 1987). For example, Fuchs (1987) reports seabass growing from 30.6g to 633g after 180 days in floating cages at a density of 60 fish/m3 with a survival exceeding 85%, a final total fish biomass of 36.4kg/m3, and with a final food conversion ratio of 1.5 (as fed basis; pellet containing 55% crude protein and 12% lipid; estimated diet cost of 1.74 US $/kg - Dr. G. Cuzon, Personal Communication, Tahiti, 30 June 1989). During the present feeding trial the fastest growth with in-house dry pelleted feed was observed with fish fed diet RD2; fish growing from 8.7g to 94.2g in 100 days with a food conversion of 1.71 (as fed basis). The relatively poor growth response observed was primarily due to the nervous feeding behavior of the fish and their consequent low feed intake (see section 3.3.2). Similarly, Chou, Wong and Lee (1987) reported that non weaned seabass fingerlings (10cm, 13g) fed directly with dry pellets took 42 days to accustom themselves to the feed. However, these difficulties can be overcome if fish can be weaned directly on a dry feed crumble as early as 11–30 days after hatching (Pechmanee, Ugkayanon and Tattanon, 1984; MacKinnon, 1987; Tiensongrusmee et. al. 1989).
Clearly, detailed information will be required on the dietary nutrient requirements of seabass if commercial dry feed lines are to compete on an economic basis with ‘trash fish’ and surpass its current nutritional advantage (Wong and Chou, 1989). At present scant information is available concerning the dietary nutrient requirements of juvenile seabass (New, 1986a; Boonyaratpalin, 1988; AQUACOP, Cuzon, Chou and Fuchs, 1989), and even less concerning the dietary nutrient requirements of larvae (Dhert et. al. 1989; Rimmer and Reed, 1989) and fish under practical cage farming conditions.
![]()
![]()
![]()