Development of economic feeding strategies for the on-growing of the estuarine grouper (Epinephelus tauvina) in floating net cages.
Six dietary feeding regimes were evaluated:
The formulation, proximate chemical composition and cost of the different diets tested is shown in Table 19. All experimental diets were prepared as described previously (see section 2.2.1 and 3.2.1).
Grouper fingerlings (ca. 23 – 31g in weight) were obtained from wild stock fish in Serang. Before the start of the feeding trial all stock fish had been weaned from a frozen minced fish diet to a dry pellet devoid of trash fish over a 30 to 40 day weaning period. Experimental fish were stocked at an initial density of thirty fish per cage, each cage measuring 1 × 1 × 1.5m (1 cubic meter water volume), having a half inch mesh size, and covered with bamboo matting. Two cages were allocated per dietary treatment and all cages housed on a single 6 × 6m floating raft (Figure 4).
Experimental fish were fed and weighed as described previously (section 2.2.2). As with seabass, the feeding trial was divided into two parts; day 0 to day 100 (all dietary treatments), and day 100 to day 156 (diet FF and MP only).
Table 19. Formulation, proximate chemical composition and cost of the seabass/grouper test diets
| Formulation (%) | Diet code SBS/GPR | ||||
| RD1 | RD2 | MP 1 | FF 2 | SP 3 | |
| Brown fish meal | 75.0 | 66.0 | Moist pellet | Frozen fish | Shrimp pellet |
| Shrimp head meal | - | 5.0 | |||
| Squid liver powder 4 | - | 5.0 | |||
| Suehiro UGF 4 | - | 5.0 | |||
| Wheat middlings | 8.6 | 3.0 | |||
| Wheat flour | 10.0 | 10.0 | |||
| Zeolite | 0.75 | 0.75 | |||
| Fish oil 4 | 4.2 | 3.8 | |||
| Soy lecithin 4 | 0.75 | 0.75 | |||
| Choline chloride (50%) 4 | 0.40 | 0.40 | |||
| Vitamin premix AGJT/F1 4, 5 | 0.33 | 0.33 | |||
| Mineral premix AGJT/F1 4, 6 | 0.037 | 0.037 | |||
| Total | 100.067 | 100.067 | |||
| Percent national ingredients | 94.35 | 84.75 | |||
| Percent imported ingredients | 5.65 | 15.25 | |||
| Proximate composition (%, as fed basis) | |||||
| Moisture | 10.00 | 10.20 | 39.00 | 74.54 | 9.60 |
| Crude protein (N × 6.25) | 44.77 | 44.95 | 33.53 | 17.12 | 39.93 |
| Crude lipid | 9.75 | 11.79 | 5.24 | 3.30 | 4.50 |
| Crude fibre | 4.49 | 4.03 | 2.40 | - | 3.02 |
| Salt (NaC1) | 0.79 | 0.76 | 0.48 | 0.40 | 2.42 |
| Calcium (Ca) | 2.85 | 3.04 | 2.09 | 1.58 | 4.33 |
| Phosphorus (P) | 1.37 | 1.59 | 1.16 | 0.89 | 1.46 |
| Ash | 10.09 | 11.01 | 8.24 | 5.65 | 14.58 |
| Proximate composition (%, dry matter basis) | |||||
| Crude protein (N × 6.25) | 49.74 | 50.05 | 54.97 | 67.24 | 44.17 |
| Crude lipid | 10.83 | 13.13 | 8.59 | 12.95 | 4.98 |
| Crude fibre | 4.99 | 4.49 | 3.93 | - | 3.34 |
| Salt (NaC1) | 0.88 | 0.85 | 0.78 | 1.56 | 2.68 |
| Calcium (Ca) | 3.17 | 3.38 | 3.43 | 6.22 | 4.79 |
| Phosphorus (P) | 1.52 | 1.77 | 1.90 | 3.50 | 1.61 |
| Ash | 11.21 | 12.26 | 13.51 | 22.20 | 16.13 |
| Diet cost (Rupiah/kg diet, as fed basis) 7 | |||||
| Total raw ingredient cost | 892 | 1073 | 675 | 350 | |
National ingredient cost (%) | 82.7 | 64.3 | |||
Imported ingredient cost (%) | 17.3 | 35.7 | |||
| Estimated processing/handling cost 8 | 178 | 215 | 135 | 35 | |
| Total diet cost | 1070 | 1288 | 810 | 385 | 1640 |
1 Moist pellet; frozen trash fish : diet RD1 (40:60 mixture, w/w)
2 Frozen fish; Splendid Pony fish Leiognathus splendens
3 Shrimp pellet; commercial shrimp finisher pellet No. 585 ( P.T. Agro Utama Corporation, Jakarta)
4 Imported feed ingredients
5 Vitamin premix AGJT/F1 supplies per kilogram of dry diet; vitamin A 4000 IU, vitamin D3 2000 IU, vitamin E 200 mg, vitamin K3 8 mg, thiamine 32 mg, riboflavin 40 mg, pyridoxine 32 mg, pantothenic acid 120 mg, nicotinic acid 160 mg, biotin 0.4 mg, folic acid 8 mg, vitamin B12 0.04 mg, inositol 300 mg, vitamin C 800 mg
6 Mineral premix AGJT/F1 supplies per kilogram of dry diet; iron 30 mg, zinc 50 mg, manganese 25 mg, copper 3 mg, cobalt 0.5 mg, iodine 3 mg, trivalent chromium 0.25 mg, selenium 0.10 mg
7 28th October 1989; Rupiah 1790 = 1 US $
8 Based on a 20% handling/processing cost for in-house pelleted diets (excluding profit margin) and a 10% handling/freezer storage cost for frozen fish
Water quality was determined as described previously (section 2.2.2) and is shown in Figure 5 (day 0 – 100) and Figure 16 (day 0 – 156).
All chemical and statistical measurements were performed as described previously (for details see section 2.2.3 and 2.2.4).
The mean growth response of grouper over the first 100 day feeding period is shown in Figures 34 – 35 and Table 20. Treatments fed frozen fish (FF) and moist pellet (MP) displayed the best growth response; fish having a significantly higher (p < 0.05) final body weight, length and condition factor, and a higher daily weight gain and specific growth rate than fish fed the dry compound diets. However, fish fed the commercial shrimp pellet (SP) had a significantly higher (p < 0.05) final body weight than fish fed diet RD1 (RD1) and diet RD2 (RD2). Surprisingly, the final mean body weight of fish receiving no exogenous dietary feed input increased by 8.36% over the 100 day trial period (Table 20). Clearly, these fish must have been surviving on the wild exogenous fish fry frequently entering their cages.
The feeding response of grouper over the 100 day feeding period is shown in Figures 36 – 41 and Table 21. With the exception of fish fed RD1 and RD2, all fish soon became accustomed to accepting the experimental diets and fed aggressively for the duration of the experiment. Due to the unintended floating properties of diet RD1 and RD2 fish fed these rations were always nervous when feeding; fish resting at the bottom of the cage and being very loath to swim up to the water surface to consume the floating feed.
The highest dry matter feed intake was observed for fish fed MP and FF, and the lowest for fish fed Rd1; the dry matter feed intake of fish fed RD1 being half that of fish fed MP (Table 21). Interestingly, whilst a good linear correlation was observed between dietary feed intake and body weight for fish fed FF and MP, no such correlation existed for fish fed SP, RD1 and RD2 (Figure 39 – 41).
In contrast to seabass, there was little effect of fish handling and cage maintenance activities on the subsequent dietary feed intake of fish fed FF and MP. However, all dietary treatments (particularly FF) displayed a higher feeding activity during the late afternoon; the feed intake of fish during the morning being only about one third of that consumed during the afternoon between 4 – 5pm (Figure 36 – 38).
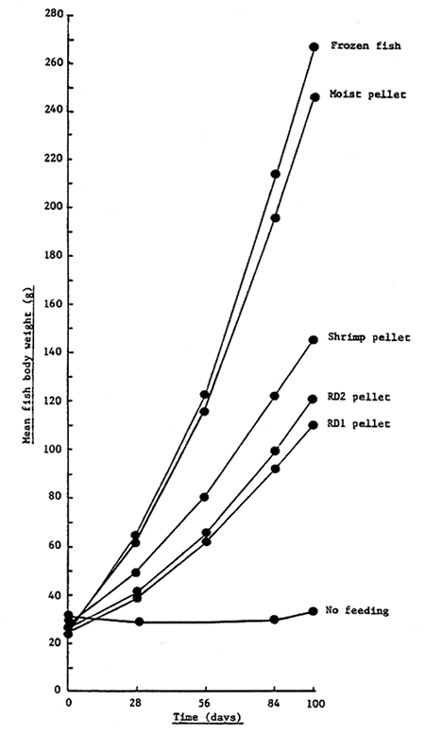
Figure 34. Growth response of grouper after 100 days
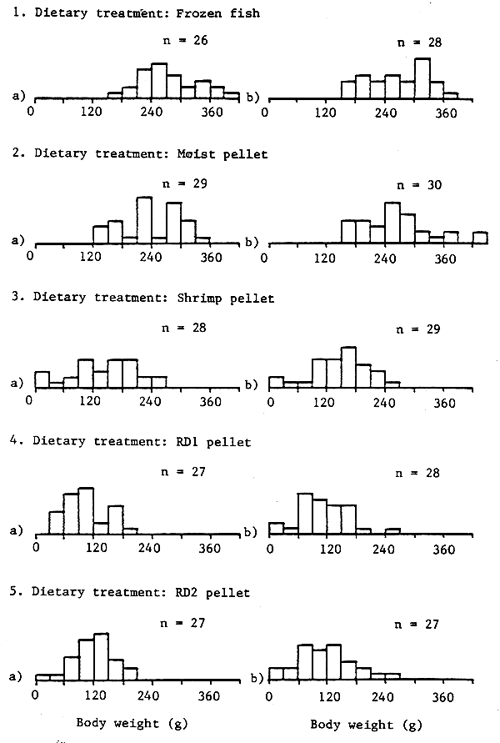
Figure 35. Body weight range of grouper after 100 days
Table 20. Growth performance of grouper from day 0 to day 100
| Dietary treatment | FF | MP | NF | SP | RD1 | RD2 | ± SE 1 | |
| Size and shape | ||||||||
| Initial body weight (g) | a | 23.0 | 25.2 | 31.7 | 27.7 | 22.2 | 25.2 | |
| b | 24.7 | 26.5 | 30.5 | 27.2 | 25.5 | 26.2 | ||
| X | 23.8 | 25.8 | 31.1 | 27.4 | 23.8 | 25.7 | ||
| Initial total body length (cm) | a | 13.0 | 11.8 | 14.1 | 12.9 | 12.7 | 13.0 | |
| b | 12.9 | 14.3 | 14.0 | 13.1 | 12.5 | 12.8 | ||
| X | 12.9 | 13.0 | 14.0 | 13.0 | 12.6 | 12.9 | ||
| Final body weight (g) | a | 271.5 | 235.2 | 28.6 | 142.1 | 108.1 | 128.1 | |
| b | 261.4 | 257.7 | 38.9 | 149.0 | 108.9 | 114.4 | ||
| X | 266.4d | 246.4 d | 33.7 a | 145.6 c | 108.5 b | 121.2 b | 8.19 | |
| Final total body length (cm) | a | 24.2 | 22.3 | 13.2 | 19.7 | 18.5 | 19.0 | |
| b | 21.9 | 23.8 | 14.2 | 19.7 | 18.8 | 18.6 | ||
| X | 23.0c | 23.0 c | 13.7 a | 19.7 b | 18.6b | 18.8 b | 0.44 | |
| Fish condition factor (final) 2 | a | 18.3 | 18.2 | 10.6 | 16.1 | 16.0 | 16.2 | |
| b | 17.6 | 17.3 | 11.9 | 16.5 | 16.0 | 15.7 | ||
| X | 17.9c | 17.7 c | 11.2 a | 16.3 b | 16.0 b | 15.9 b | 0.27 | |
| Growth response | ||||||||
| Total weight gain (%) | a | 1080 | 833 | - | 413 | 387 | 408 | |
| b | 958 | 872 | 27.5 | 448 | 327 | 337 | ||
| X | 1019 | 852 | - | 430 | 357 | 372 | ||
| Mean weight gain (%/day) | a | 10.80 | 8.33 | - | 4.13 | 3.87 | 4.08 | |
| b | 9.58 | 8.72 | 0.27 | 4.48 | 3.27 | 3.37 | ||
| X | 10.19 | 8.52 | - | 4.30 | 3.57 | 3.72 | ||
| Mean daily weight gain (g/fish/day) | a | 2.48 | 2.10 | - | 1.14 | 0.86 | 1.03 | |
| b | 2.37 | 2.31 | 0.13 | 1.22 | 0.83 | 0.88 | ||
| X | 2.42 | 2.20 | - | 1.18 | 0.84 | 0.96 | ||
| Specific growth rate (%/day) 3 | a | 2.47 | 2.23 | - | 1.63 | 1.58 | 1.63 | |
| b | 2.36 | 2.27 | 0.24 | 1.70 | 1.45 | 1.47 | ||
| X | 2.41 | 2.25 | - | 1.66 | 1.51 | 1.55 | ||
1 Standard error, calculated from residual mean square in the analysis of variance
2 Condition factor = Final fish body weight (g) / Final fish total body length (cm)3, × 1000
3 Specific growth rate = Log e Final fish body weight (g) - Log e Initial fish body weight (g) /Time (days), × 100
abc Mean values for components with the same superscripts are not significantly (p<0.05) different
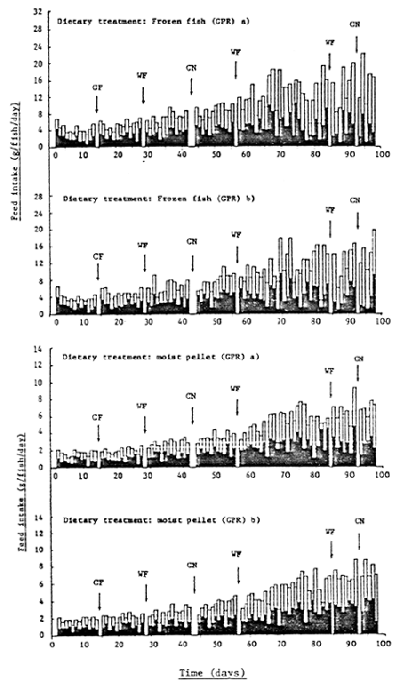
Figure 36 . Daily feed intake of grouper fed frozen fish and a moist pellet ration from day 0 to day 100
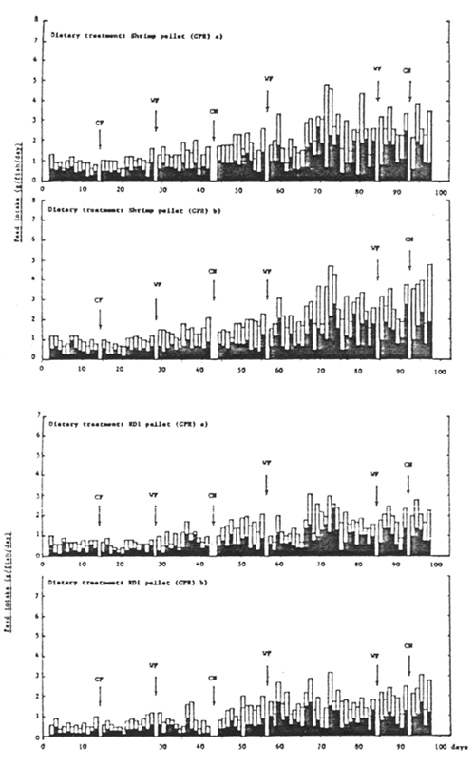
Figure 37 . Daily feed intake of grouper fed shrimp finisher pellet and RD1 pellet from day 0 to day 100
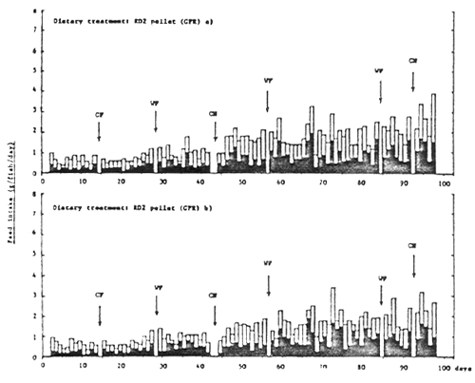
Figure 38 . Daily feed intake of grouper fed RD2 pellet from day 0 to day 100
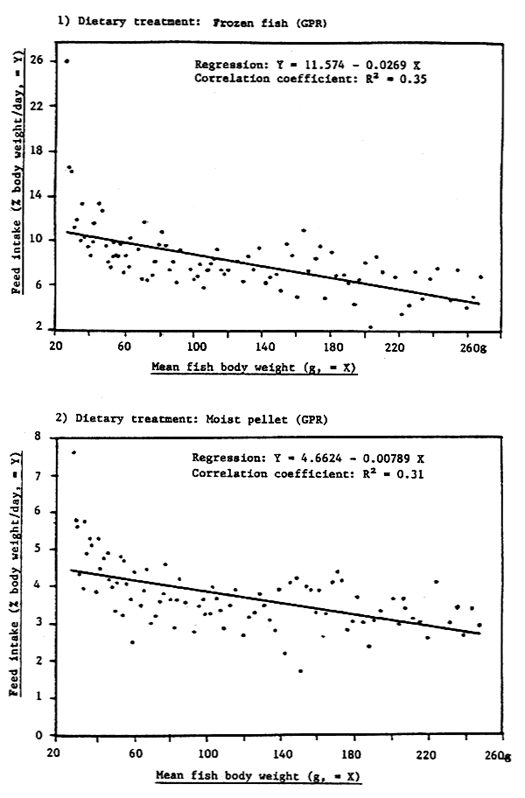
Figure 39 . Relationship between percentage daily food intake and body weight of grouper from day 0 to day 100
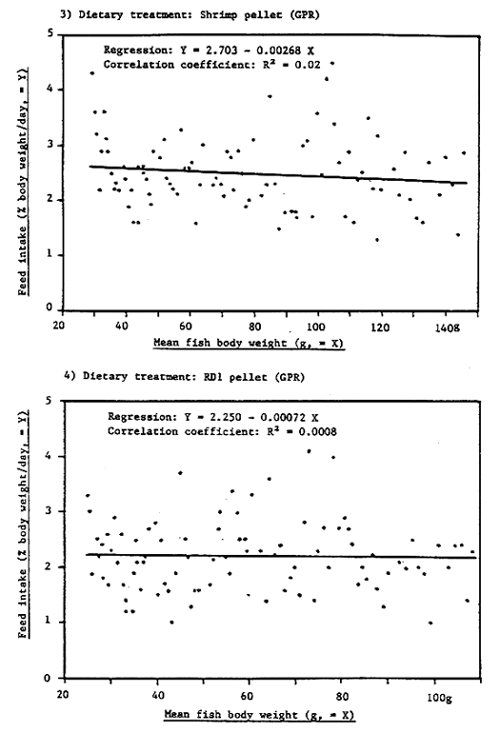
Figure 40 . Relationship between percentage daily food intake and body weight of grouper from day 0 to day 100
5) Dietary treatment: RD2 pellet (Gpr)
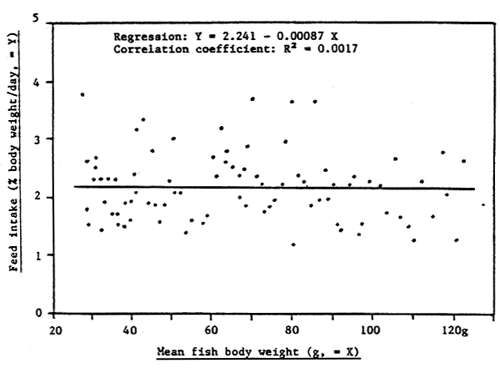
Figure 41 . Relationship between percentage food intake and body weight of grouper from day 0 to day 100
Table 21. Feed intake and diet utilization efficiency of grouper from day 0 to day 100
| Dietary treatment | FF | MP | NF | SP | RD1 | RD2 | |
| Feeding response | |||||||
| Total feed intake (as fed, g/fish) | a | 893 | 377 | - | 182 | 126 | 142 |
| b | 820 | 389 | - | 179 | 130 | 132 | |
| X | 856 | 383 | - | 180 | 128 | 137 | |
| Daily feed intake (as fed, g/fish) | a | 8.93 | 3.77 | - | 1.82 | 1.26 | 1.42 |
| b | 8.20 | 3.89 | - | 1.79 | 1.30 | 1.32 | |
| X | 8.56 | 3.83 | - | 1.80 | 1.28 | 1.37 | |
| Daily feed intake (dry matter, g/fish) | a | 2.27 | 2.30 | - | 1.64 | 1.13 | 1.27 |
| b | 2.09 | 2.37 | - | 1.62 | 1.17 | 1.18 | |
| X | 2.18 | 2.33 | - | 1.63 | 1.15 | 1.23 | |
| Feed utilization | |||||||
| Food conversion ratio (as fed) 1 | |||||||
Week 0 – 4 | a | 3.16 | 1.40 | - | 1.26 | 1.22 | 1.43 |
| b | 3.05 | 1.41 | - | 1.25 | 1.31 | 1.21 | |
| X | 3.10 | 1.40 | - | 1.25 | 1.26 | 1.32 | |
Week 4 – 8 | a | 3.76 | 1.56 | - | 1.38 | 1.45 | 1.38 |
| b | 3.78 | 1.55 | - | 1.33 | 1.40 | 1.37 | |
| X | 3.77 | 1.55 | - | 1.35 | 1.42 | 1.37 | |
Week 8 – 12 | a | 3.70 | 1.96 | - | 1.98 | 1.54 | 1.43 |
| b | 3.55 | 1.73 | - | 1.63 | 1.56 | 1.82 | |
| X | 3.62 | 1.84 | - | 1.80 | 1.55 | 1.62 | |
Week 12 – 100 days | a | 3.62 | 1.88 | - | 1.76 | 1.75 | 1.72 |
| b | 3.45 | 1.95 | - | 1.60 | 1.89 | 1.65 | |
| X | 3.53 | 1.91 | - | 1.68 | 1.82 | 1.68 | |
| Overall food conversion ratio | |||||||
Week 0 – 100 days (as fed) | a | 3.60 | 1.79 | - | 1.60 | 1.46 | 1.38 |
| b | 3.46 | 1.68 | - | 1.47 | 1.57 | 1.50 | |
| X | 3.53 | 1.73 | - | 1.53 | 1.51 | 1.44 | |
| Overall food conversion ratio | |||||||
Week 0 – 100 days (dry matter)2 | a | 0.91 | 1.09 | - | 1.44 | 1.31 | 1.23 |
| b | 0.88 | 1.03 | - | 1.33 | 1.41 | 1.34 | |
| X | 0.89 | 1.06 | - | 1.38 | 1.36 | 1.28 | |
| Protein efficiency ratio 3 | a | 1.62 | 1.67 | - | 1.58 | 1.54 | 1.61 |
| b | 1.69 | 1.78 | - | 1.69 | 1.43 | 1.49 | |
| x | 1.65 | 1.72 | - | 1.63 | 1.48 | 1.55 | |
| Apparent net protein utilization 4 | a | 30.40 | 30.38 | - | 28.66 | 27.30 | 29.17 |
| b | 31.51 | 35.11 | - | 33.30 | 25.70 | 27.24 | |
| X | 30.95 | 32.74 | - | 30.98 | 26.50 | 28.20 | |
1 Food conversion ratio (as fed) = Feed intake (as fed basis, g) / Live weight gain (wet basis, g)
2 Food conversion ratio (dry matter basis) = Feed intake (dry matter basis, g) / Live weight gain(wet basis, g)
3 Protein efficiency ratio = Live weight gain (wet basis, g) / Dietary crude protein intake (g)
4 Apparent net protein utilization = Fish tissue crude protein deposition (g) / Dietary crude proteinintake (g), × 100
The lowest (ie. best) dry matter food conversion ratio was observed for fish fed FF, followed by fish fed MP, RD2, RD1 and SP, respectively (Table 21). By contrast, the highest protein efficiency ratio and apparent net protein utilization efficiency was observed for fish fed MP, followed by fish fed FF, SP, RD2 and RD1, respectively.
The proximate carcass composition of fish at the start and end of the 100 day feeding period is shown in Table 22. With the exception of fish receiving no exogenous dietary feed input (NF), there was no noticeable difference between treatments on the basis of their proximate chemical composition. As expected, the carcass composition of NF fish was typical of a starving animal utilizing its own body lipid and protein reserves. As observed with seabass, the fact that the initial carcass composition of fish was similar to that of the NF treatment indicates that the nutritional status and overall condition of the ‘weaned’ fish at the start of the experiment was poor.
With the exception of NF fish, all treatments displayed good survival over the 100 day trial period; fish survival ranging between 90 and 98.3% for fish fed FF and compound diets (Figure 42 and Table 23).
As observed with seabass, total cage biomass increase for fish fed FF and MP (6.48 – 6.50kg/m3) was more than double that of fish fed the dry pelleted diets (2.27 – 3.33kg/m3) over the 100 day feeding period (Table 24). Similarly, feeding costs/kg fish produced were lowest for FF (Rp 1342), followed by MP (Rp 1382), RD1 (Rp 1609), RD2 (Rp 1915) and SP (Rp 2513; Table 24).
Table 22. Carcass composition of grouper at the start and end of the 100 day feeding trial
| Treatment 1 | Initial | After 100 days | ||||||
| FF | MP | NF | SP | RD1 | RD2 | |||
| Composition (% wet weight) | ||||||||
| Moisture | a | 71.37 | 69.61 | 77.10 | 70.88 | 71.13 | 72.19 | |
| b | 71.47 | 69.09 | 76.35 | 69.99 | 71.23 | 70.76 | ||
| x | 77.11 | 71.42 | 69.35 | 76.73 | 70.44 | 71.18 | 71.48 | |
| Crude protein | a | 18.45 | 18.02 | 14.74 | 17.73 | 17.48 | 17.64 | |
| b | 18.41 | 19.39 | 15.78 | 18.85 | 17.43 | 17.74 | ||
| x | 15.76 | 18.43 | 18.71 | 15.26 | 18.29 | 17.46 | 17.69 | |
| Lipid | a | 4.60 | 7.01 | 0.93 | 6.47 | 5.12 | 4.37 | |
| b | 4.91 | 7.65 | 1.13 | 5.40 | 5.28 | 4.73 | ||
| x | 0.82 | 4.76 | 7.33 | 1.03 | 5.94 | 5.20 | 4.55 | |
| Ash | a | 5.50 | 4.66 | 8.23 | 4.84 | 4.93 | 5.16 | |
| b | 7.85 | 4.32 | 7.24 | 5.14 | 5.88 | 5.43 | ||
| x | 6.97 | 6.68 | 4.49 | 7.74 | 4.99 | 5.41 | 5.30 | |
| Calcium | a | 1.75 | 1.58 | 2.94 | 1.59 | 1.72 | 1.81 | |
| b | 1.76 | 2.10 | 2.49 | 1.90 | 2.73 | 1.82 | ||
| x | 2.35 | 1.75 | 1.84 | 2.72 | 1.75 | 2.23 | 1.81 | |
| Phosphorus | a | 0.99 | 0.90 | 1.33 | 0.84 | 0.96 | 0.92 | |
| b | 0.93 | 1.15 | 1.26 | 1.01 | 1.04 | 0.91 | ||
| x | 1.13 | 0.96 | 1.03 | 1.30 | 0.93 | 1.00 | 0.91 | |
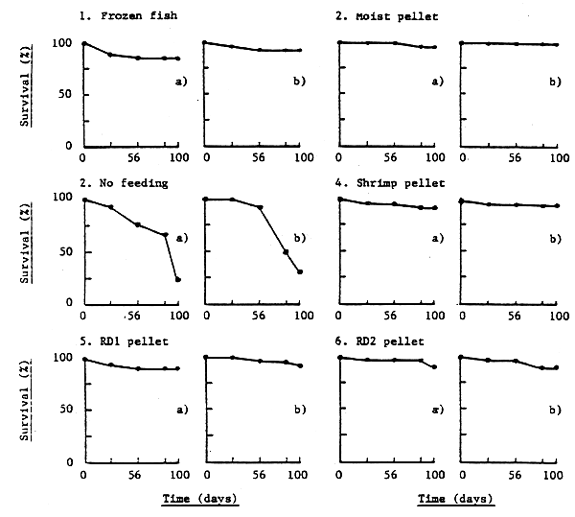
Figure 42 . Survival curve of grouper from day 0 to day 100
Table 23. Mortality record and survival of grouper from day 0 to day 100
| Dietary treatment | Mortality record (fish No./cage) 1 | Survival (%) | ||||
| Total | Observed | Cannibalism | ||||
| Frozen fish | a | 4 | 2 | 2 | 86.7 | |
| b | 2 | 0 | 2 | 93.3 | ||
| X | 90.0 | |||||
| Moist pellet | a | 1 | I * | 0 | 96.7 | |
| b | 0 | 0 | 0 | 100.0 | ||
| X | 98.3 | |||||
| No feeding | a | 23 | II | 12 | 23.3 | |
| b | 21 | 2 | 19 | 30.0 | ||
| X | 26.6 | |||||
| Shrimp pellet | a | 2 | 0 | 2 | 93.3 | |
| b | 1 | 0 | 1 | 96.7 | ||
| x | 95.0 | |||||
| RD1 pellet | a | 3 | 1 | 2 | 90.0 | |
| b | 2 | 0 | 2 | 93.3 | ||
| X | 91.6 | |||||
| RD2 pellet | a | 3 | 0 | 3 | 90.0 | |
| b | 3 | 0 | 3 | 90.0 | ||
| X | 90.0 | |||||
1 30 fish stocked per cage at day 0 (2 May 1989)
Observed fish mortality - mortalities observed by field staff within experimental cages (ie. dead fish physically removed from cages and individually weighed)
Cannibalism - difference between observed fish mortalities and total fish mortalities obtained by counting individual fish at the end ofthe 100 day feeding period (ie. missing fish)
* Fish death due to crab wounds (8 July 1989; fish weight 190.6g)
Table 24. Overall cage production of grouper from day 0 to day 100
| Dietary treatment | Total fish biomass (kg/m3) | Total food fed (kg) 1 | Cost/kg fish 2 | |||
| Initial | Final | Increase | ||||
| Frozen fish | a | 0.69 | 7.06 | 6.37 | 22.85 | 1358 |
| b | 0.74 | 7.32 | 6.58 | 22.68 | 1327 | |
| X | 0.71 | 7.19 | 6.48 | 22.76 | 1342 | |
| Moist pellet | a | 0.75 | 6.82 | 6.07 | 10.73 | 1432 |
| b | 0.79 | 7.73 | 6.94 | 11.41 | 1332 | |
| X | 0.77 | 7.27 | 6.50 | 11.07 | 1382 | |
| No feeding | a | 0.95 | 0.20 | - | - | |
| b | 0.91 | 0.35 | - | - | ||
| X | 0.93 | 0.27 | - | - | ||
| Shrimp pellet | a | 0.83 | 3.98 | 3.15 | 5.05 | 2629 |
| b | 0.81 | 4.32 | 3.51 | 5.13 | 2397 | |
| X | 0.82 | 4.15 | 3.33 | 5.09 | 2513 | |
| RD1 pellet | a | 0.66 | 2.92 | 2.26 | 3.37 | 1596 |
| b | 0.76 | 3.05 | 2.29 | 3.47 | 1621 | |
| x | 0.71 | 2.98 | 2.27 | 3.42 | 1609 | |
| RD2 pellet | a | 0.75 | 3.46 | 2.71 | 3.94 | 1873 |
| b | 0.78 | 3.09 | 2.31 | 3.51 | 1957 | |
| X | 0.76 | 3.27 | 2.51 | 3.72 | 1915 | |
1 Total food fed on a ‘as fed’ basis
2 Cost in Rupiah (Rp) of feed per kg of fish produced:
Frozen fish - total diet cost Rp 385/kg
Moist pellet - total diet cost Rp 810/kg
Shrimp pellet - total diet cost Rp 1640/kg
RD1 pellet - total diet cost Rp 1070/kg
RD2 pellet - total diet cost Rp 1288/kg
Conversion factor: 1 US $ = 1790 Rp (28 October, 1989)
The growth response, final body weight range, and feed intake of grouper fed FF and MP is shown in Tables 25 – 27 and Figures 43 – 48. Fish fed FF had a significantly higher (p < 0.05) final body weight (which was also significantly higher at day 100 after the removal of five fish for carcass analysis) and displayed a noticeably better growth response than fish fed MP over the final 56 days of the feeding trial (Table 25). As expected, the dry matter feed intake of fish fed FF and MP (expressed as % body weight/day) decreased at the same rate with increasing fish body weight (Figure 48). As before, the highest feeding activity and feed intake occurred during the late afternoon for all treatments (Figure 45 – 46). The preferred late afternoon feeding of grouper has also been reported by Teng and Chua, (1978).
It is not known why the feed efficiency of fish fed MP decreased during the final 56 days of the feeding trial (Table 27). By contrast, the feed efficiency of fish fed FF remained relatively constant throughout the 156 feeding trial (Figure 49).
Fish fed MP had a noticeably lower carcass protein content and a higher carcass ash content at the end of the 156 feeding trial than fish fed FF (Table 28). In view of the observed deterioration in feed efficiency during the last 56 days of the feeding trial, feeding costs/kg fish produced increased to Rp 1603 and Rp 2396 for FF and MP, respectively (Table 29).
Table 25 . Growth performance of grouper from day 100 to day 156
| Dietary treatment | Frozen fish | Moist pellet | ± SE 1 | |
| Size and shape | ||||
| Initial body weight (g) | a | 276.5 | 241.0 | |
| b | 280.0 | 261.8 | ||
| X | 278.2 b | 251.4 a | 9.41 | |
| Final body weight (g) | a | 477.0 | 394.6 | |
| b | 466.4 | 382.8 | ||
| X | 471.7 b | 388.7 a | 12.89 | |
| Final total body length (cm) | a | 30.9 | 29.4 | |
| b | 30.8 | 29.0 | ||
| X | 30.8 b | 29.2 a | 0.31 | |
| Fish condition factor (final) 2 | a | 16.0 | 15.5 | |
| b | 15.9 | 15.3 | ||
| X | 15.9 a | 15.4 a | 0.18 | |
| Growth response | ||||
| Total weight gain (%) | a | 72.5 | 63.7 | |
| b | 66.6 | 46.2 | ||
| X | 69.5 | 54.9 | ||
| Mean weight gain (%/day) | a | 1.29 | 1.14 | |
| b | 1.19 | 0.82 | ||
| X | 1.24 | 0.98 | ||
| Mean daily weight gain (g/fish/day) | a | 3.58 | 2.74 | |
| b | 3.33 | 2.16 | ||
| X | 3.45 | 2.45 | ||
| Specific growth rate (%/day) 3 | a | 0.97 | 0.73 | |
| b | 0.91 | 0.68 | ||
| X | 0.94 | 0.70 | ||
1 Standard error, calculated from residual mean square in the analysis of variance
2 Condition factor = Final fish body weight (g) / Final fish total body length (cm)3,× 1000
3 Specific growth rate = Log e Final fish body weight (g) - Log e Initial fish bodyweight (g) / Time (days), × 100
abc Mean values for components with the same superscripts are not significantly(p<0.05) different
Table 26 . Overall growth response of grouper from day 0 to day 156
| Dietary treatment | Frozen fish | Moist pellet | ± SE 1 | |
| Initial body weight (g) | a | 23.0 | 25.2 | |
| b | 24.7 | 26.5 | ||
| X | 23.8 | 25.8 | ||
| Final body weight (g) | a | 477.0 | 394.6 | |
| b | 466.4 | 382.8 | ||
| X | 471.7b | 388.7a | 12.89 | |
| Total weight gain (%) | a | 1974 | 1466 | |
| b | 1788 | 1344 | ||
| X | 1881 | 1405 | ||
| Mean weight gain (%/day) | a | 12.65 | 9.40 | |
| b | 11.46 | 8.61 | ||
| X | 12.05 | 9.00 | ||
| Mean weight gain (g/fish/day) | a | 2.91 | 2.37 | |
| b | 2.83 | 2.28 | ||
| X | 2.87 | 2.32 | ||
| Specific growth rate (%/day) 2 | a | 1.94 | 1.76 | |
| b | 1.88 | 1.71 | ||
| X | 1.91 | 1.73 | ||
1 Standard error, calculated from residual mean square in the analysis of variance
2 Specific growth rate = Log e Final body weight (g) - Log e Initial body weight (g) /Time (days), × 100
abc Mean values for components with the same superscripts are not significantly(p<0.05) different
Table 27 . Feed intake and diet utilization efficiency of grouper from day 100 to day 156
| Dietary treatment | Frozen fish | Moist pellet | |
| Feeding response | |||
| Total feed intake (as fed, g/fish) | a | 795 | 426 |
| b | 812 | 381 | |
| X | 803 | 403 | |
| Daily feed intake (as fed, g/fish) | a | 14.20 | 7.60 |
| b | 14.50 | 6.80 | |
| X | 14.35 | 7.20 | |
| Daily feed intake (dry matter, g/fish) | a | 3.62 | 4.64 |
| b | 3.69 | 4.15 | |
| X | 3.65 | 4.39 | |
| Feed utilization | |||
| Food conversion ratio (as fed basis) 1 | |||
| Day 100 – 128 | a | 3.95 | 3.08 |
| b | 3.94 | 2.93 | |
| X | 3.94 | 3.00 | |
| Day 128 – 156 | a | 3.98 | 2.55 |
| b | 5.88 | 3.39 | |
| X | 4.93 | 2.97 | |
| Overall food conversion ratio | |||
| Day 100 – 156 (as fed basis) | a | 3.97 | 2.77 |
| b | 4.35 | 3.15 | |
| x | 4.16 | 2.96 | |
| Overall food conversion ratio | |||
| Day 100 – 156 (dry matter basis) 2 | a | 1.01 | 1.69 |
| b | 1.11 | 1.92 | |
| X | 1.06 | 1.80 | |
| Protein efficiency ratio 3 | a | 1.47 | 1.07 |
| b | 1.34 | 0.95 | |
| X | 1.40 | 1.01 | |
| Apparent net protein utilization 4 | a | 30.05 | 20.34 |
| b | 27.10 | 15.30 | |
| X | 28.57 | 17.82 | |
1 Food conversion ratio (as fed) = Feed intake (as fed basis, g) / Live weight gain (g)
2 Food conversion ratio (dry matter) = Feed intake (dry matter basis, g) / Live weightgain (wet weight basis, g)
3 Protein efficiency ratio = Live weight gain (wet basis, g) / Dietary protein intake (g)
4 Apparent net protein utilization = Fish tissue crude protein deposition (g) / Dietarycrude protein intake (g), × 100
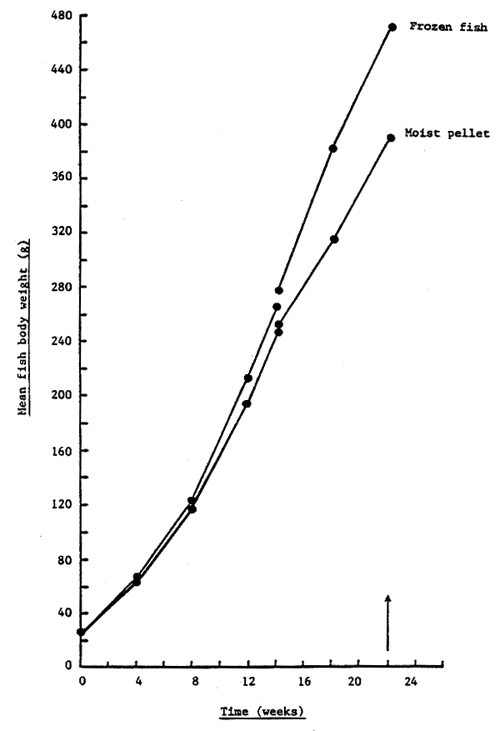
Figure 43 . Growth performance of grouper after 156 days
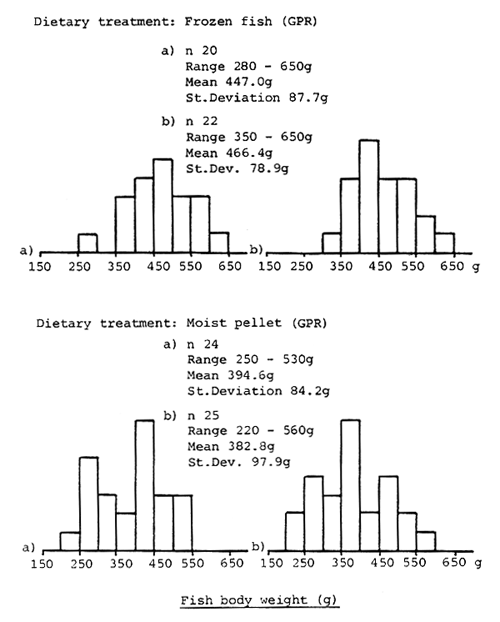
Figure 44 . Body weight range of grouper after 156 days
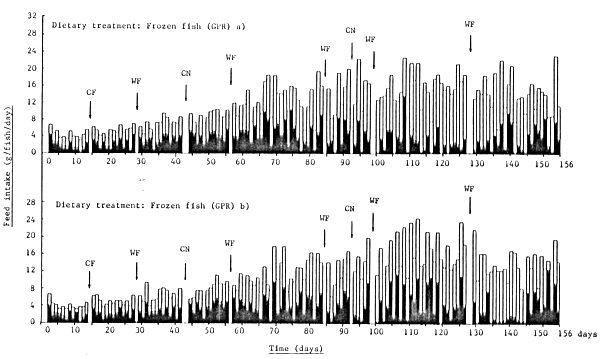
KEY: CF - count fish; WF - weigh fish; CN - change net; - am feed intake; - pm feed intake
Figure 45 . Daily feed intake of grouper fed a frozen fish diet from day 0 to day 156
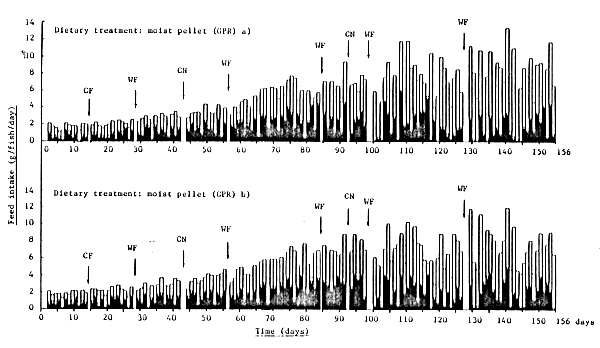
KEY: CF - count fish; WF - weigh fish; CN - change net; - am feed intake; - pm feed intake
Figure 46 . Daily feed intake of grouper fed a moist pellet ration from day 0 to day 156
1) Dietary treatment: Frozen fish (GPR)
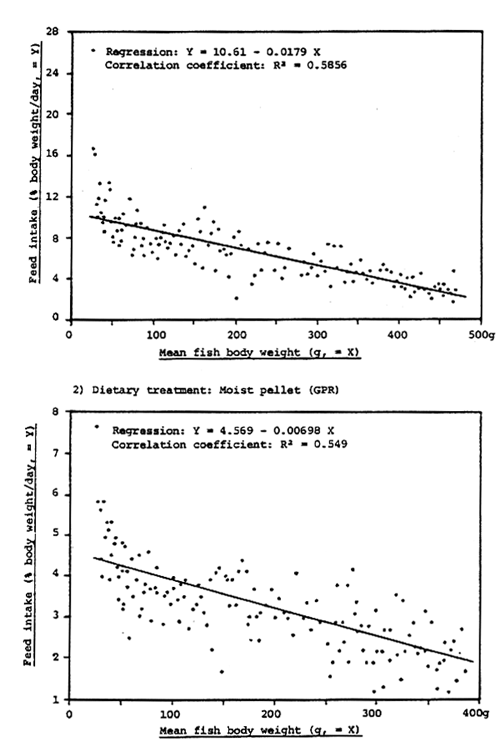
Figure 47 . Relationship between percentage daily food intake (as fed basis) and body weight of grouper from day 0 to day 156
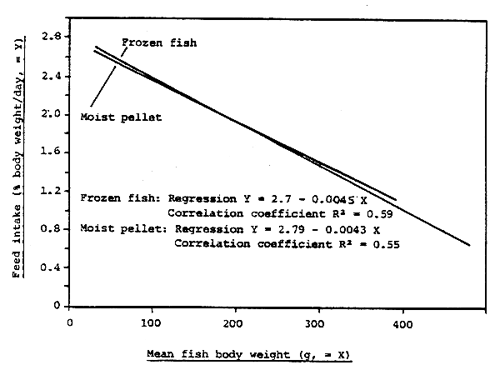
Figure 48. Relationship between percentage daily dry matter food intake and body weight of grouper from day 0 to day 156
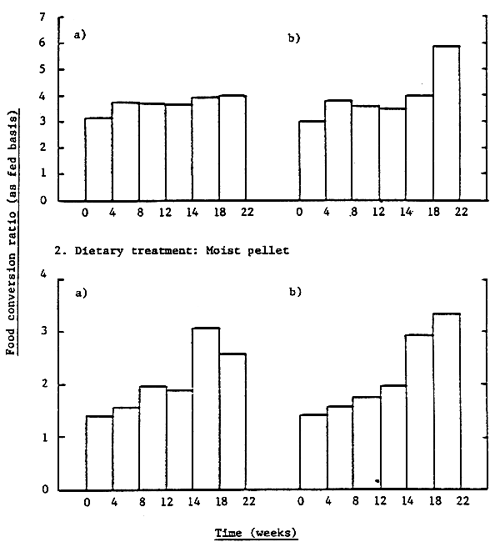
Figure 49. Food conversion ratio of grouper over the course of the 156 day feeding trial
Table 28. Carcass composition of grouper fed frozen fish and moist pellet after 0, 100 and 156 days
| Component | Initial | Frozen fish | Moist pellet | |||
| Day 100 | Day 156 | Day 100 | Day 156 | |||
| Composition (% wet weight) | ||||||
| Moisture | a | 71.37 | 68.21 | 69.61 | 68.50 | |
| b | 71.47 | 69.25 | 69.09 | 69.23 | ||
| x | 77.11 | 71.42 | 68.73 | 69.35 | 68.87 | |
| Crude protein | a | 18.45 | 19.27 | 18.02 | 17.83 | |
| b | 18.41 | 19.13 | 19.39 | 18.37 | ||
| x | 15.76 | 18.43 | 19.20 | 18.71 | 18.10 | |
| Lipid | a | 4.60 | 5.88 | 7.01 | 7.70 | |
| b | 4.91 | 6.56 | 7.65 | 5.25 | ||
| x | 0.82 | 4.76 | 6.22 | 7.33 | 6.48 | |
| Ash | a | 5.50 | 4.98 | 4.66 | 5.75 | |
| b | 7.85 | 5.23 | 4.32 | 7.57 | ||
| x | 6.97 | 6.68 | 5.11 | 4.49 | 6.66 | |
| Calcium | a | 1.75 | 1.42 | 1.58 | 1.98 | |
| b | 1.76 | 1.64 | 2.10 | 1.87 | ||
| x | 2.35 | 1.75 | 1.53 | 1.84 | 1.93 | |
| Phosphorus | a | 0.99 | 0.77 | 0.90 | 1.05 | |
| b | 0.93 | 0.79 | 1.15 | 0.93 | ||
| x | 1.13 | 0.96 | 0.78 | 1.03 | 0.99 | |
Table 29. Overall cage production of grouper from day 100 to day 156 1
| Dietary treatment | Total fish biomass (kg/m3) | Total food fed (kg) 2 | Cost/kg fish 3 | |||
| Initial | Final | Increase | ||||
| Frozen fish | a | 5.53 | 9.54 | 4.01 | 15.91 | 1528 |
| b | 6.16 | 10.26 | 4.10 | 17.86 | 1677 | |
| x | 5.84 | 9.90 | 4.05 | 16.88 | 1603 | |
| Moist pellet | a | 5.78 | 9.47 | 3.69 | 10.22 | 2243 |
| b | 6.54 | 9.57 | 3.03 | 9.53 | 2548 | |
| x | 6.16 | 9.52 | 3.36 | 9.84 | 2396 | |
1 No fish mortalities observed over the 56 day reporting period
2 Total food fed on a ‘as fed’ basis
3 Cost in Rupiah (Rp) of feed per kg of fish produced:
Frozen fish - total diet cost Rp 385/kg
Moist pellet - total diet cost Rp 810/kg
Conversion factor: 1 US $ = 1790 Rp (28 October, 1989)
The best growth response and feed efficiency was observed for grouper fed frozen fish (FF) and to a lesser extent moist pellet (MP). Fish fed FF and MP grew from an initial weight of 23.8g and 25.3g to a final weight of 471.7g and 388.7g in 156 days, with a food conversion ratio of 3.53 – 4.16 (dry matter basis 0.89 – 1.06) and 1.73 – 2.96 (dry matter basis 1.06 – 1.80), and with a survival of 90% and 98.3%, respectively. These results are in line with previous cage feeding studies with juvenile grouper (E. tauvina) fed ‘trash fish’ (Chua and Teng, 1978; Sakares and Sukbanteang, 1985; Eng, Hooi and Wang, 1985; Yoshimitsu, Eda and Hiramatsu, 1986) and artificial moist diets ( Wongsomnuk, Parnichsuka and Danayadol, 1978; Chou, Wong and Lee, 1987; E. salmoides - Teng and Chua, 1979). As with seabass, the food conversion efficiencies observed during the present feeding trial are a considerable improvement on those recorded previously at Teluk Hurun; past food conversion ratios for grouper fed frozen fish ranged from 7 to 8.9 (Anon, 1989; Appendix 1).
Figure 50 shows the reconstructed growth curve for grouper fed a frozen fish ration based on the cage culture trials which have been conducted at the National Seafarming Development Centre. On the basis of this growth curve it would take 4.1 months or 7.9 months to rear grouper juveniles from an initial weight of 23.8g to a market size of 500g or 1000g, respectively. As with seabass, the feeding cost/kg fish produced was very low, ranging from Rp 1342 to 1603 and Rp 1382 to 2396 for fish fed frozen fish and moist pellet, respectively. The market value of live E. tauvina at the farm gate is reported to be Rp 12,000/kg (retail price of 15 Sing.S/kg; Tiensongrusmee and Rais, 1989).
The disappointing results obtained with grouper fed the dry in-house pelleted rations was a reflection of the dislike of the experimental fish to take a floating feed (ie. the fish had been ‘weaned’ to take a dry sinking pellet). By contrast, although feed intake was not a problem with fish fed the sinking commercial shrimp pellet, the 40% crude protein content of the diet was almost certainly too low for the fish. Experimental feeding trials have indicated that the dietary protein requirement of juvenile grouper is between 45 and 50% of the dry diet (Sukhawongs, Tanakumcheep and Chungyampin, 1978; Teng, Chua and Lim, 1978; El Dakour and George, 1982; New, 1986a; Hu and Lin, 1985; Tanomkiat and Pimoljinda, 1986;. Although commercial dry feeds for grouper are not currently available within S.E. Asia, excellent results have been obtained by researchers in Kuwait (Jafri, Al Judaimi and George, 1980; Abdullah, Wuan and Kawahara, 1987) and Singapore (Chou and Wong, 1985) with grouper fed sinking dry pelleted diets.
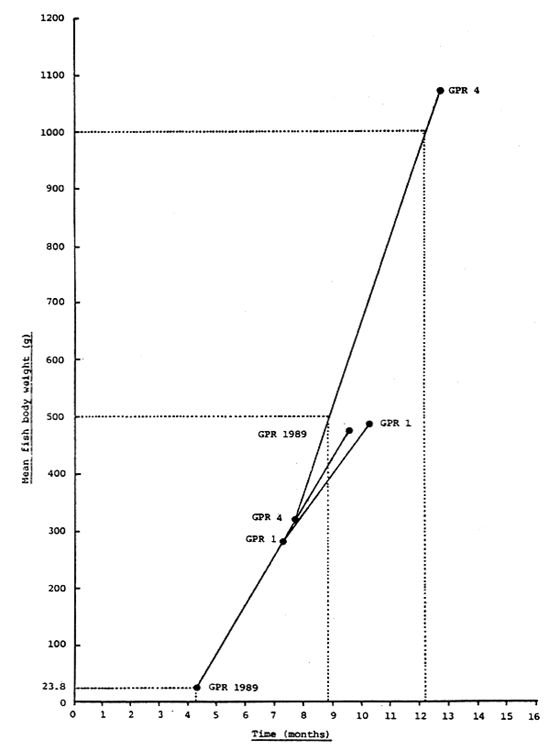
Figure 50 . Reconstructed growth curve for grouper (E. tauvina) fed a frozen fish ration within floating net cages at the National Seafarming Development Centre in Teluk Hurun based on past cage culture trials (Appendix 1)