![]()
![]()
![]()
by
W.L.Chan, B. Tiensongrusmee, S. Pontjoprawiro and I. Soedjarwo1
I. INTRODUCTION
1. Seafarming as a New Fishery Production Subsector
The prescribed activities of the FAO/UNDP Seafarming Development Project, may serve as a mechanism to establish seafarming as a new fishery production subsector in Indonesia. As for other Aquaculture practices, seafarming would tend to emphasize on medium-high to high value product lines primarily as a means to sustain viability of the adopted production practices. The inclusion of low-production cost tax with high bulk turnover would also be considered in production programmes.
The future success of the establishment of a seafarming production subsector in the Indonesian fisheries is thus directly dependent upon the level of profit of the recommended production systems as a means to attract new entrants and to maintain the interest of stayers.
Production economics, management and development are vital considerations in this regard. At the same time, postharvest factors also present key dependent and independent variables which may vitally affect the purposes of Repelita IV seafarming development undertakings.
Many, if not all, of the chosen products are already established commercial marine commodities in fresh or processed state, or both. Their present production is, in a manner of speaking, incidental to the existing multispecies fisheries production of the capture sector. The postharvest problems of these products are therefore, akin to those specific to the current capture fisheries and the existing postharvest facilities and practices.
If seafarming is to be established on a firm footing, the anticipated production and postharvest problems must be examined critically with a view to establishing new practices and renovating old, unrealistic situations by learning from the mistakes of the capture sector. Existing services and guidance must therefore, be examined, to which disposal of seafarmed products do not necessarily have to oblige in view of the differing methods of product utilisation.
2. Seafarming vs Fishing
Analogous to hunting on land, fishing at sea exploits the natural animal and plant stocks whose survival and propagation are bound by inexorable laws of the living world. The fish, for example, transform about 10 % of what they eat into their own flesh, while the rest is expended in the chores of living, respirating, swimming and other essential living tasks of the like. They are constantly in pursuit of their survival essentials, and they congregate and disperse for biologiacal dan environmental reasons. In the associltion of their kinds, there is also diverse variety of causes that bring about such natural phenomena. To the exploitor of the sea his captures are never consistent, and his average cropping rate from the wild is often very low, as the natural stock is beyond his control. In long-established fishing grounds, the cost-effectiveness in exploitation has in fact been on the decline in most of the seas of the world.
1 FAO/UNDP Seafarming Developopment Project, INS/81/008
The farming of the sea, is much similar to the farming of animal ( or animal husbandry ) on land. Through domestication, a species of sea organism is grown in a confined space for as high a yield rate as situations allow under the constant control and care of the grower. Domestication is however, still incomplete in this early phase of development as seafarming continues to remain in a state where artificial reproduction and genetical improvements of the species ( on growth rate, disease resistance, ect.) still await development break-throughs. Despite such limitations domestication of sea organisms has proven to be a realistic business proposition, making it possible to create considerable alternative engagement opportunity to absorb the otherwise redundant small-scale fishing and rural coastal resources dwindle and the cost of capture fishery production increases.
3. Species
3.1 Selection of Species
The choice of species for seafarming depends on a number of factors. Specifically, the demand, value and manage-ability in culture of the species, as well as other considerations should be of note. The final selection however, is the subjective decision of the operator, which in most cases is one for convenience.
It is prudent on the part of an operator not to adopt fixedly or rigidly subjective, and especially misled, views. While it is necessary to select the species for culture, it is equally important that additional species should also be taken into consideration. This is to recognise that supply-and-demand trends of a species may change thereby affecting its exfarm value; that in meeting with new demands a farm may choose to adopt a broader range of product lines to meet the ever changing need of buyers and to take over such buyers from other production farms; that when the supply of seeds for one species is suddenly reduced, the production capasity of a farm can then be absorbed by alternative species, making it possible to ensure the cost-effectiveness of the invested culture facility.
Irrespective of the strategy and tactical alternatives a thorough understanding of the target market outlets with respect to characteristics, sensitivity, supply-and demand trends, and other important considerations should be attempted.
Fig. 2 summarises dependent and independent variables to be considered in selecting finfishes for culture. For mollusc and Eucheuma seaweed, the problem of selection of species is considerable less complicated. It is the design of annual output which is important not to give rise to oversupplying. Undersupplying is as a rule of thumb a good tactical move to maintain, at least, the level of the value of the species. The other factors considered are a matter of making realistic forecast of eventual level of products.
The following list of species are of seafarming potential :
3.1.1 Finfishes (Figs. 4 and 5)
3.1.2 Molluscs (Fig. 6)
3.1.3 Seaweeds (Fig. 7)
| a. Euchema spinosum | (iota carrageenan “spinosum” types) |
| b. E. isiforme | |
| c. E. uncinatum | |
| d. E. cottonii | (kappa carrageenan “cottonii” types) |
| e. E. striatum | |
| f. E. procrusteanum | |
| g. E. speciosum |
4. Present Utilisation of Species
4.1 Finfish. All of the listed species are incidental to the multispecies fisheries
of Indonesia. As such they are utilized as for the other kinds of gillnetted, purse-seined,
lined fishes.
It is difficult to rate their overall value as food fishes other than that they are mostly
above medium to medium-high value taxa. This value so generalised depends also upon
the state of freshness of the stock concerned.
4.2 Mollusc. Other than cockle which are widely consumed in certain areas and which are also exported, the green mussel and oyster are not yet established as food species. There has yet much to be done before these bivalves receives acceptance of the general public. The green mussel had once been promoted, but due to claimed levels of heavy metals its potential rapidly declined.
4.3 Seaweeds. Seaweed of the genus Euchema have been an important fishery export item. The situations of this group of commodity are described in Sunyoto (1983).
II. SEAFARMING PRODUCTION
1. Production Targets
Table 1 shows the attainable average annual gross yield rates for the different groups of sea organisms having seafarming development potential.
1.1 Finfish
There are two groups of finfishes, viz. , carnivorous fishes as represented by the serranids, lutjanids and carangids, and herbivorous and omnivorous as for the siganids. The former tends to have a considerably faster weight increment rate though requiring higher feed costs; whereas, the latter, though growing comparatively much slower could thrive on natural vegetations of little or no costs to the operator.
Table 2 shows an objective approach to the selection of the species for culture (Chan, 1981), suggesting viability as the principal criterion.
Based on these data, it is possible to plan production and set production targets as situations allow.
1.2 Mollusc.
From table 1, it can be seen that average annual gross yield rates estimated for each of the organism groups each falls within a wide range. This is due to the adopted culture method, the inherent environmental conditions and also stock management efforts primarily in thinning out of high density stocks.
1.3 Seaweed
The estimated annual gross yield for Eucheuma seaweed is based on the experience of the American Marine Colloid Company in the Phillipines, using the monofilament netting method.
2. Meeting Production Targets
2.1 In principle, the Repelita IV seafarming production targets could be met by using the average annual gross yield rates in the planning of investment. The yield rate sited are those experienced by small-scale and commercial operators in the region having similar environmental setting. The species cultured are also similar. Using the techniques and methodologies presently practiced in these countries it is expected that the performance of seafarming systems in Indonesia should fall within the ranges of production capabilities.
2.2 There are foreseeable factors however, which may upset these targets. These are invariably one of production management abilities. In particular, the following lines of undertakings are essential to overcome adverse factors.
2.3 These and other factors are summarised in Fig. 2 of WBL/85/WP-1, appended to this paper also as Fig. 2.
3. Production Programme Planning
Supported by sound management schemes, production programmes can be realistically planned for differing circumstances and needs.
3.1 Finfish
Using a one floating raft four cage production unit with a unit cage size of 3m × 3m × 3m or 27 cu.m., or a total of 108 cu.m. of impounded seawater, a growout operation starting with 150 - gm fingerling size and using an average daily weight increment of 4 gm per day (Fig. 3) could anticipate the following annual production performance :
Annual production performance thus depends on two practices, one cropping per year, and second full use of facility time to enable more than one harvest. This performance estimate is also dependent upon the stocking density at the time of harvest. In the case presented above, 8 numbers of fish per cu.m of impounded water are used. This figure may however, be raised up to and much beyond 15 kg fish per cu.m. Using this higher stocking density the estimate at (a) above may become 1.6 tons/crop and at (b) 2.86 tons/annum.
The cash turnover in these two cases is at once and twice per year, respectively.
The dependence of natural fish seeds often means that the stocking materials invariably come in different sizes ranging from fingerling to any sub-optimum value sizes. If advantage is taken to utilize these varying sizes, a flexible fattening programme can be used as indicated in Fig. 4. In the case presented, it was assumed that stocking materials at sizes of 150 gm, 270 gm, 390 gm, and 510 gm were used in seperate cages. If a daily weight increment of 4 gm, and re-stocking was also carried out after harvest, then the thick lines show the pattern of cashflow. The annual gross production under such a scheme, using 8 to 15 fish per cu.m., would then also be more attractive.
The limitations in the planning of production programmes of these kinds would depend upon :
3.2 Mollusc
The growth of molluscs, with the exception of the green mussel, would appear to be slow as these bivalves have to utilize calcium contents in the seawater for the growth of their shells. From spat to 6 – 7 cm shell length, the green mussel may take about 8 or more months depending on a number of factors. On the other hand, cockle grows to a shell length of 3 cm in 1 – 1.5 years, while Crassostrea species of oysters attain their marketable sizes 2 to 3 years after spat-fall in new areas (considerably slower growth in “old” grounds).
The production programmes for these bivalves depends very much upon the method of culture. As a rule of thumb, bottom culture method tend to yield less and off-bottom methods produce considerably more. This is particularly so with oyster.
Generally speaking, the following annual gross yield estimates could be used for the three groups of molluscs:
3.3 Seaweed
For Eucheuma seaweed, commercial prospecting by a renounced Euchema seaweed company has shown an average of about 97 wet tons per ha per year using netting device for off-bottom culture. This tonnage is the result of two-monthly cropping of the hanging clusters of Euchema. If 7.5 tons of wet Euchema makes one dry ton, then each ha yields around 13 dry tons of Euchema annually.
III. UTILISATION OF SEAFARMED PRODUCTS
As a potential fishery production subsector, its creation has much to depend upon the lessons learned from existing fisheries especially those concerned with the economics in production and the closely associated postharvest problems. While the former may perhaps be assured through thorough planning of investments, the later are direct and indirect variables arising from the fact that fish are in fact a highly perishable commodity.
In seafarming advantage should be taken of the fact that many of the postharvest problems of the capture sector could in fact be avoided, thereby cutting down on the cost of infrastructural supports. Under this line of thinking, then the utilisation of seafarmed products must be well-planned ahead before investments and harvests are made to control spoilage, to ensure freshness and to maintain consistent edible standards.
Seafarming investments should thus emphasize controlled harvest and product disposal based upon known supply-and-demand trend and committed small bulk buyers. Given the backing of management know-how and forward planning, well-planned utilisation of seafarmed products could in fact provide some practical answers to the anticipated post-harvest problems of this new fishery production subsector.
1. Live Product
In many countries of the region the demand for live fish and mollusc would appear
to be on an increase. This is particularly so in societies where affluence in the ways of life of
the people is increasing. Wherever there are such markets, advantage must be taken of their
demand for live sea products.
There are several good reasons for it. First, in a live state, there is no fear of perisability. Second,
delivery is made only on the understanding that the demand will absorb the supply. Third,
mortality enrout to market, if any, would still remain fairly fresh to be sold at a fairly reasonable
cost. Fourth, economic return on a per unit weight basis would be comperatively high.
Some generalisation regarding the relay of live seafarmed products could be made :
| Taxon | Delivery | Time | Mortality |
|---|---|---|---|
| Groupers | Special live fish boat of ca. 12 m | 48 hrs + | ca. 30% |
| l.o.a carrying 8 – 10 tons live fish while cruising; electric pumps used when boat stationery. | 24 hrs + | ca. 15 % | |
| 12 hrs + | ca. 10 % | ||
| 8 hrs + | ca. 8 % | ||
| 4 hrs + | ca. 4 % | ||
| Other Perch like fishes | Estimated at 80 % of the weight for groupers | Same delivery timing | Depending on the species, in most cases, some 10 – 15 % higher. |
| Oyster | Freshly harvested and immediate delivery under cover by wet papers, tarps, etc. and away from direct sunlight | 48 hrs + | High |
| 24 hrs | ca. 5 – 10 % | ||
| 12 hrs + | 0% | ||
| 8 hrs + | 0% | ||
| 4 hrs + | 0% | ||
| Cockle | (as for oyster) | (As for oyster) | (As for oyster) |
| Green mussel | Difficult to assess as damages caused at harvest could cause immediate death of the bivalve. | (Difficult to assess) | ( Difficult to assess) |
Bulk delivery of small and large fish and mollusc are also practiced. In generalisation the larger the organism the higher the mortality; and the higher the water temperature, the greater the adverse effects of shipment on the live organisms. In these undertaking priorities are therefore given to using seawater that can sustain a high level of dissolved oxygen for a longer period of time. In so doing, seawaters to be used for transport are removed of organic elements and other harmful solids, and their temperatures and sometimes also salinities brought down to more helpful level to allow higher amounts of dissolved oxygen. In an actual shipment of 1.5 million seabass fry average mortalities were lowered to less than 2 % by decreasing water temperatures and reconditioning the fish to free them from pathogens and food in the stomach.
2. Fresh Products
In relaying fresh products, delivery time should again be effectively controled. Live products should be washed to free them from slime and other obvious debris which may be infested by bacteria before packing them in clean, insulated containers with ice. The best temperatures should be lowered to above 0°C but below 2°C at which the flesh of the products remain the way the markets prefer, and before dehydration takes place.
All boxed up produce should again be protected from the sun to make sure that the conditions established inside the containers could last for 8 – 10 hours, or whatever time period is required for the scheduled delivery.
3. Processed Products
Seafarmed products having bulk turnover significance should be considered for processing into a variety of products for wider distribution and prolonged period of utilisation. Processing traditionally may include various types of curing, such as salting, smoking, etc. It may also involve modern technology of canning. Again, the final choice is one of economic consideration.
In general, the processing of seafarmed products especially for quick turnover markets is considered vital to the future of the seafarming production subsector serving as a buffer in sustaining the value of the products in question.
All mollusc are suitable products for canning, as an excellent protein source in feed preparations, and other apllocations. Eucheuma seaweed has a worldwide demand for industrial use. These are therefore, worhtwile postharvest aspects that warrant our immediate attention.
VI. DISCUSSION
It would appear seafarming production could be a money-earning practise in Indonesia as in other countries of the region where social and economic settings are fairly similar. What remains to be seen is the effect of the enormity of the country on the distribution of the seafarmed products. This is specially important since new entrants to this new system must find it profitable so that they become stayers but not leavers.
The development problems in seafarming are thus focussed upon the postharvest of this new subsector. Unlike other fisheries, seafarming could probably help cut short many step in the tedious chain of postharvest activities as we understand them today, by being able to be in a position to keep the products alive before they receive buyers or orders before they are delivered to the markets.
At this early stage it is however, vital that some reliable understanding of the incountry markets should be made especially their sensitivity to fluctuations in supply, demand-and-supply trend and other inter-related social, economic and other human factors which collective make up the market.
V. REFERENCE
Sunyoto Darmoredjo, 1983. Seaweed resources in Indonesia with special emphasize on production, value and utilization. FAO/UNDP Preparatory Assistance in Seafarming Development Project INS/81/008.
| End of month | Weight of stock (kg) | |||||||
| 150-gm size | 270-gm size | 390-gm size | 510-gm size | 530-gm size | 750-gm size | 870-gm size | 990-gm size | |
| 1st | 233.3 | |||||||
| 2nd | 337.0 | |||||||
| 3rd | 440.6 | |||||||
| 4th | 457.9 | |||||||
| 5th | 648.0 | |||||||
| 6th | 751.7 | |||||||
| 7th | 855.4 | |||||||
| 8th | 959.1 | |||||||
| 9th | 233.3 | |||||||
| 10th | 337.0 | |||||||
| 11th | 440.6 | |||||||
| 12th | 457.9 | |||||||
Fig. 1. Envisaged annual yield of a 4 cage small-scale farm with each cage at ( 3 × 3 × 3)m3 and using fingerlings of Epinephelus tauvina at 150 gm size only.
Fig. 2 : The inter-relationships of key factors governing the eventual realisation of positive or negative annual gross profit in seafarming production investments.
| Mean starting Weight of fish | Weight of stock in kg at end of each month | |||||||||||||
| 1 | 2 | 3 | 4 | 5 | 6 | 7 | 8 | 9 | 10 | 11 | 12 | 13 | 14 | |
| 150 gm | 233.2 | 336.8 | 440.4 | 544.0 | 647.6 | 751.6 | 855.6 | 233.2 | 336.8 | 440.4 | 544.0 | 647.6 | 751,6 | 855.6 |
| 270 gm | 336.8 | 440.4 | 544.0 | 647.6 | 751.6 | 855.6 | 336.8 | 440.4 | 544.0 | 647.6 | 751.6 | 855.6 | ||
| 390 gm | 440.4 | 544.0 | 647.6 | 751.6 | 855.6 | 440.4 | 544.0 | 647.6 | 751.6 | 855.6 | ||||
| 510 gm | 544.0 | 647.6 | 751.6 | 855.6 | 544.0 | 647.6 | 751.6 | 855.6 | 544.0 | 647.6 | 751.6 | 855.6 | ||
Fig. 3. Production programme for a 4 - cage small scale fish farm fattening Epinephelus tauvina of 4 starting weights at 150 gm, 270 gm, 390 and 510 gm size fish, and with each size group occupying a single cage.
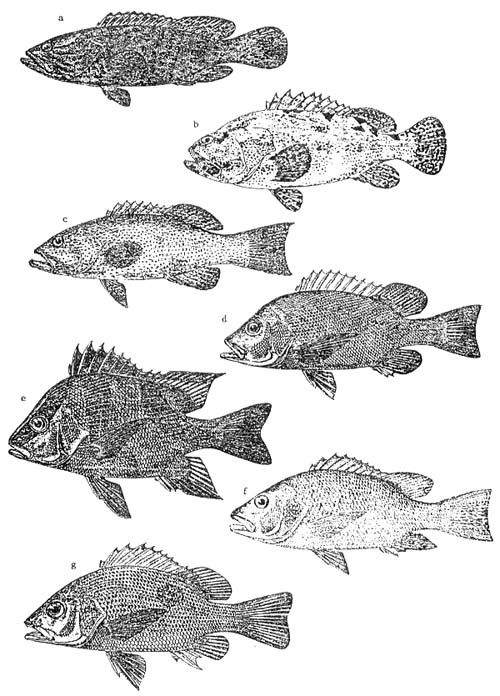
Fig. 4. a, Epinephelus tauvina; b, E. fuscoguttatus; c, Plectropomus leopardus; Lutjanus sanguineus; L. sebae; L. argentimaculatus; and L. johni.
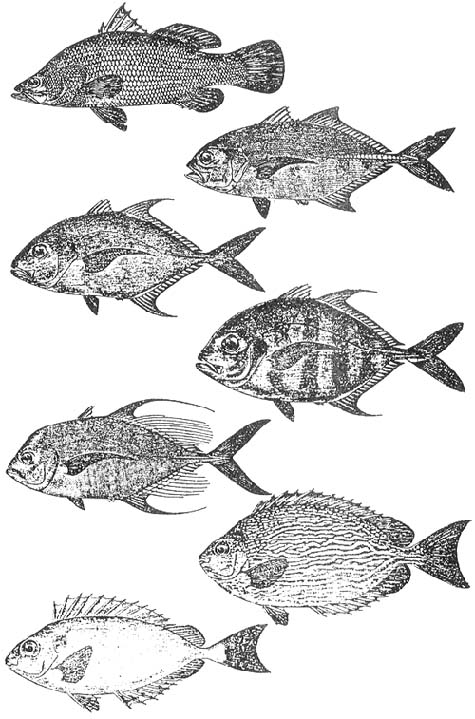
Fig. 5. a, Lates calcarifer; b, Caranx sexfasciatus; c. Carangoides chrysophrys; d, C. malabaricus; e, C. armatus; f, Siganus javus; and g. canaliculatus.
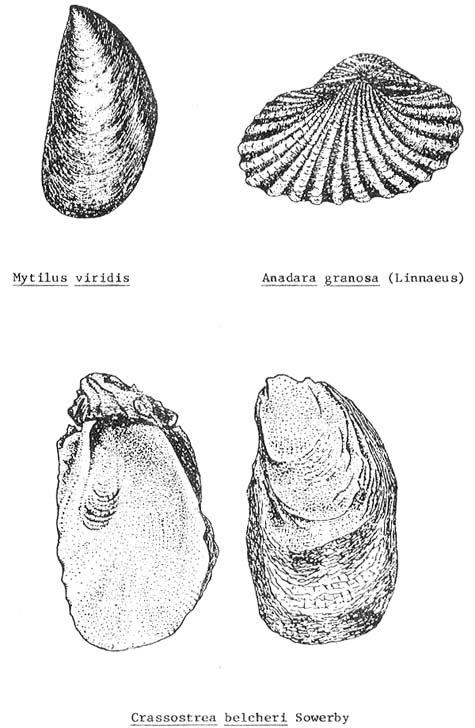
Fig. 6. a, Perna viridis; b, Anadara granosa; and c, Crassostrea belcheri.
Fig. 7. a, Euchema spinosum; and b, E. cottonii.
| Organism | Culture method | Average annual gross yield |
| Finfish | Floating netcage | 8 to 15 kg/cu.m.; or 216 to 405 kg/ netcage of 3 m × 3 m × 3 m ( 27 cu.m., or 9 sq.m. surface area) |
| Cockle | Bottom | 5 tons/ha (shell on) |
| Mussel | Pole or stick | 150 – 400 tons/ha (shell on) |
| Oyster | Pole | 10 tons/ha (shell on) |
| Basket hanging drop | 100 tons/ha (C. gigas, shell on) | |
| Eucheuma seaweed | Net | 97 wet tons/ha (Philippines experience) |
| Species (1) | Value (Rp) at 605 gm) (2) | Weight at 1st stocking (gm) (3) | Av. daily weight increment (gm) (4) | No. of days required to attain 605 gm | No. of crops per year (5) | Biomass at harvest (no. of 605 gm fish per m3) | Annual value of harvested fish/m3 (Rp) (6) | Natural habitats (7) | ||
|---|---|---|---|---|---|---|---|---|---|---|
| Brackish (above 15‰ | Marine | Coral reef | ||||||||
| Epinephelus tauvina | 2 400 | 105–150 (125) | 4 | 120 | 2–3 (2.5) | 17–25 (21) | 126 000 | Fry | Juv./adult | Juv./adult |
| E. malabaricus | 2 400 | " | 4 | 120 | 2–3 (2.5) | 17–25 (21) | 126 000 | - | All sizes | All sizes |
| E. fuscoguttatus | 1 800 | " | 4 | 120 | 2–3 (2.5) | 17–25 (21) | 94 500 | - | - | All sizes |
| Lutjanus argentimaculatus | 1 800 | " | 4 | 120 | 2–3 (15) | 13–17 (15) | 67 500 | Fry/juv | Juv./adult | - |
| Lutjanus sanguineus | 1 800 | " | 3 | 160 | 2 (2) | 13–17 (15) | 54.000 | - | All sizes | All sizes |
| Lutjanus johni | 1 800 | " | 3 | 160 | 3 (2) | 13–17 (15) | 54.000 | Fry | Juv./adult | (less common) |
| Lates culcarifer(8) | 2 400 | " | 6–7 (6.5) | 74 | 4–5 (4.5) | 6– 8 ( 7) | 75 600 | All sizes | Adult | - |
| P samoperca waigiensis | 1 500 | " | 1.5 | 320 | 1 (1) | 7– 9 ( 8) | 12 000 | - | - | - |
| Plectropomus maculata | 2 400 | " | 4 | 120 | 2–3 (2.5) | 17–25 (21) | 126 000 | - | (less common) | All sizes |
| P. leopardus | 2 400 | " | 3 | 120 | 2–3 (2.5) | 17–25 (21) | 126 000 | - | (less common) | All sizes |
| Siganus spp. other than S. fucescens and oramin | 6 000 | " | 1.5 | 320 | 1 (1) | 17–25 (21) | 126 000 | - | - | All sizes |
(3) A size, from which optimal growth begins, based on serranids and lutjanids.
(4) Attainable through good, effective management.
![]()
![]()
![]()