![]()
![]()
![]()
4.1. SUPPLY OF SHRIMPS
4.1.1. The development of shrimp production in Indonesia, during the period of 1971–1975, shows an increasing trend, namely from 46,797 tons in the year 1971 to 75,795 tons in the year 1975 (an average increase of 12.81 pct. per year). (See Appendix IV.1.).
In the period of 1973–1975, the greatest part of shrimp production in Indonesia (approximately 77.2 pct.), is from marine catch, whereas the rest are from inland shrimp catch (9.1 pct) and from brackish water pond culture (approximately 13.7 pct) (See Appendix IV.2.).
The production of giant freshwater prawn (macrobrachium rosenbargii at present is from inland open water-/river catch. The production of giant freshwater prawn shows a declining trend, with an average of 24 pct. a year (See Appendix IV.4.).
In the year 1976/1977 freshwater pond culture undertaking for giant freshwater prawn was started to be developed, among others in the Central Java region. Up till now it is still in the construction stage of pilot ponds and trial production, designed to be further developed by freshwater pond farmers.
4.1.2. Unlike the nasional figures, shrimp production in the Lampung region, during the period of 1971–1975, shows a declining trend with an average of 35 pct per year.
Shrimp production in the Lampung region is averaged only 1.9 pct. of the total production of Indonesia during the period of 1971–1975 (See Appendix IV.1).
In Lampung, the greatest part of shrimp production is from marine catch (approximately 59 pct). The rest are from inland open water catch (approximately 39 pct) and from brackish water pond culture (approximately 2 pct.) (See Appendix IV.2.).
The production of giant freshwater prawn in the Lampung region, constituting inland open water catch, decreases from 210 tons in 1973 to 80 tons in 1975 (an average decline of 38 pct. per year). In the same period, the production of giant freshwater prawn in Lampung was only approximately 4.1. pct. of the overall giant freshwater prawn production in Indonesia, and approximately 10 pct. of the giant freshwater prawn production in Sumatra (See Appendix IV.4.).
4.2. DEMAND OF SHRIMPS
4.2.1. Figures for 1971–1975 indicates that shrimp production in Indonesia is still relatively small (approximately 5%), compared to the total fishery production (See Appendix IV.5.).
However, as indicated earlier shrimp has succeeded in rapidly becoming the principal export commodity in the fishery sector in Indonesia. The production of fresh shrimp export shows an ever - increasing trend, from 12 pct. in the year 1968 to 59 pct. in the year 1975 (See Appendix IV.6.).
The greatest part of the shrimp production in Indonesia (approximately 81 pct.) is exported as fresh shrimp (See Appendix IV.7). The export volume of fresh shrimp from Indonesia during the period of 1968–1975 has increased from 3,461 tons in the year 1968 to 33,278 tons in the year 1975 (an average increase of approximately 45.07 pct. per year).
Export of shrimp from Indonesia, also includes processed shrimp (dried shrimp). Although the export of processed shrimp is relatively small, the trend during the period of 1971–1975 indicates a significant increase, namely from 333 tons in the year 1971 to 969 ton in the year 1975 (See Appendix IV.8).
During the period of 1970–1975 the greatest part (approximately 82 pct) of the export of fresh shrimp from Indonesia, went to Japan, whereas the rest went to the USA (approximately 4.7 pct), Hongkong (approximately 4.5 pct), Singapore (approximately 3.5 pct) and the BENELUX countries (approximately 1 pct) (See Appendix IV.9).
4.2.2. Concerning demand for fresh shrimp, the greatest demand potential are from Japan and the U.S.A.
During the period of 1970 through 1974, the fresh shrimp import of Japan has increased from 122,800 tons in the year 1970 to 253,700 tons in the year 1974 (an average increase of 19.89 pct. per year). During the same period the imports of the U.S.A. have increased from 129,500 tons in the year 1970 to 133,700 tons in the year 1974 (an average increase of 0.8 pct. per year). Whereas the fresh shrimp import volume of Hongkong has increased from 15,300 tons in the year 1970 to 22,200 tons in the year 1974 (an average increase of 9.75 pct per year). The shrimp import volume of Singapore during the same period has increased from 13,600 tons to 20,400 tons (an average of 10.67 pct. per year) (See Appendix IV.10).
4.2.3. Viewed from the export share of Indonesia in the imports of the abovementioned countries, it appears, that there is a significant increasing trend during the period of 1970 through 1974.
If in the year 1970 the share of Indonesia in the import of the U.S.A. was 0.66 pct., it has increased to 2.27 pct. in the year 1974. With respect to Japan, in the year 1970 the share of Indonesia was 4.27 pct. and in the year 1974 it has increased to 10.04 pct. Likewise, with respect to other countries, such as Hongkong and Singapore, significant increases can be observed (See Appendix IV.10).
4.2.4. The domestic demand for shrimp, is approached by calculating the difference between shrimp production and shrimp export. The figure is then divided by the population of Indonesia, to obtain the shrimp production per capita (as a residual). In this way, an estimate is obtained of the shrimp consumption per capita in Indonesia. The figures of 1971–1975 showed a declining trend, namely from approximately 52 grams/capita in the year 1971 to approximately 28 grams/capita in the year 1975. In the average, the domestic consumption of shrimp per capita is estimated to be 40 grams per year. (See Appendix IV.11).
4.3. MARKETING CHANNELS
4.3.1. Shrimp, like other kinds of fishery products, is an easily deteriorating (perishable) good.
Shrimp should be protected from deteriorating during the whole production process until it is received by the consumers. As most of the shrimp production of Indonesia is exported, special measures in shrimp preservation should be taken, modern shrimp marketing system should be incorporated, using the cold chain system, namely by installing refrigeration equipments at each marketing link.
The current marketing chain of shrimps in Lampung can be presented as follows :
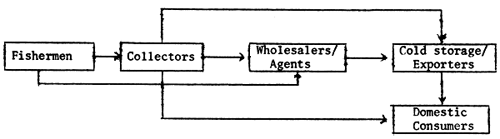
4.3.2. The Purchaser- and Seller Groups of shrimps consist of Fishermen, Traders/Wholesalers and Exporters.
Fishermen as sellers of shrimp catch, consist of :
Individual/independent fishermen, who are not committed to collectors.
Those who already have fixed customers, namely several collectors or agents of cold storage companies in Jakarta.
Those who are also acting as collectors, in the sense, that several collectors conduct their own catching/possess their own fishing vessels fleet.
Traders/Wholesalers as purchasers of shrimps from fishermen can be grouped/categorized in :
Independent collectors, in the sense, that they conduct shrimp processing and sent it to a cold storage in Jakarta by sea or by air.
Traders acting as representatives of a cold storage in Jakarta and already have fixed fishermen customers. They provide certain facilities, such as iceboxes and credits for catching equipments, to their fishermen customers.
Traders acting as purchasing agents for household- and hotel requirements in the Lampung region.
Exporters are the last chain-link before the shrimps are exported. They own cold storages in Jakarta and conduct sortation, cutting of the heads, refrigeration and packing.
4.4. PRICE STRUCTURE AND MARGINS
4.4.1. The price differences of shrimp are determined, among others, by the kinds, quality/size, head on - or headless condition.
The kinds of shrimps, which are commercially exploited in Indonesia consist of five kinds, namely marine shrimp consisting of banana shrimp, tiger shrimp, spiny lobster and inland open water shrimp, namely giant freshwater prawn. At present the price of marine shrimp is relatively more expensive in comparison with inland open water shrimp. This is caused by consumer taste abroad, preferring marine shrimps/brackish water pond shrimps.1
On the basis of Check Prices determined by the Department of Trade for Indonesian shrimps a distinction is made between shell-on headless shrimp for this kind there are check prices in 5 (five) sizes and peeled-headless shrimp, of which the check prices are determined for 4 (four) sizes.
These check prices are determined 4 (four) times a year. The higher the quality, the higher the prices. The quantities, which are acceptable for export, are generally limited to qualities A, B and C (see Appendix IV.12).
Due to the highly perishable nature of shrimp, the export of shrimps should first be preceded by a preservation process, namely by cutting-off the heads and then frozen. The method of processing will determine the relative price of shrimp. The average shrimp prices at auction halls, fishermen, collectors and at cold storages, can be observed in Table IV.1.
1 Result from an interview with a cold storage company : P.T. CEJAMP, Semarang, End January 1977.
| Kind of Shrimp | Fishermen Selling-Price in Lampung (Rp/kg)1) | Cost-Price and Selling-Price of Collectors until arrival in Jakarta | Selling-Price of Collectors in in consumer markets in Lampung (Rp/Kg)3) | |
| Cost Price until arrival in Jakarta (Rp/kg)2) | Selling Price in Jakarta (Rp/kg)2) | |||
| 1. Babana Prawn/ Jerbung Prawn | 1500–1600 | 2725–2900 | 2900–3100 | 1000–1800 |
| 2. Giant Fresh water Prawn | 1100–1300 | 2300–2550 | 2500–2600 | - |
Source : Survey by the Management Institute of the Economic Faculty of the University of Indonesia in Lampung, February 1977.
1) Prices with head-on.
2) Ex-Buyer's Warehouse in Jakarta, including 5 pct. tax, depreciation, sortation-/cutting offheads, air transportation, other costs in headless condition for export-quality with standard of 15–24 pieces shrimps per kilogram.
3) Selling Price of shrimp below standard at the Tanjung Karang market.
4.4.2. The margins (net profits) gained by each intermediary institution/ middleman are around Rp.175.-- up to Rp.200.-- per kilogram. The margins obtained by exporters are around Rp. 500.-- up to Rp. 700.--. This is caused, among others, by the difference between realized export price and government determined check price.
4.5. CONSUMER PREFERENCES
4.5.1. Consumer preference for a certain commodity will be influenced by several factors, among others taste, price of the respective commodity, prices of substitutes, availability on the market, local customs, and income level.
As most of shrimp production in Indonesia is for export, the tastes of consumers abroad should be taken into consideration.
A taste test conducted at the University of Hawaii shows, that for consumers in the USA the taste of giant freshwater prawn is more declicious in comparison with salt water/marine shrimp.1
The study gave some indication, that in comparison with marine shrimp the potential demand of giant freshwater prawn has a good prospect.
4.5.2. For Indonesia we can observe several consumer preference indicators. The comparison between shrimp prices and prices of other animal protein foodstuffs can be observed in Table IV.2. The price of shrimp is relatively high. Therefore, the domestic consumption of export quality shrimp is still limited to the high income group.
| Foodstuff | Unit | Market Price Rp. | |
| 1. Banana Prawn | Rp./Kg. | 1,400 | 1,800 |
| 2. Giant Freshwater Prawn | " | 1,200 | 1,300 |
| 3. Chicken | " | 600 | 700 |
| 4. Beef | " | 800 | 1,000 |
| 5. Marine fish: 1st Class*) | " | 300 | 400 |
| 2nd " **) | " | 250 | 300 |
| 3rd " ***) | " | 150 | 200 |
| 6. River fish | " | 200 | 350 |
| 7. Salted Fish | " | 450 | 600 |
Source: Market Survey by the Management Institute of the Economic Faculty
of the University of Indonesia at the Market of Tanjung Karang,
Lampung, in February 1977.
*) Kinds : Tuna, squid.
**) Kinds : Little tuna, selar, chub mackerel, small shrimps
***) Kinds : Kurusi fish, coral fish.
Due to the limited availability of giant fresh water prawn on the domestic market, the knowledge on consumer preference for giant freshwater prawn other than in terms of prices is also very limited.
4.6. SHRIMP MARKETING FACILITIES
Due to its perishable character, the transportation and storage of shrimp in the marketing process requires special handling. To preserve its freshness, shrimp should immediately be frozen right after its catch.
In some cases, the deterioration process can be reduced by cutting-off the shrimp heads, as these are the parts which deteriorate rapidly.
Therefore, the most important marketing facilities are refrigeration equipments, such as freezers, coolrooms and cold storage.
Likewise, the transportation means should be equipped with refrigeration facilities such as insulated/refrigerated trucks. These transportation facilities can be complemented or connected with retail market facilities such as ice-boxes and show-cases.
At present, the refrigeration facilities in the Lampung region are conducted with ice. In Lampung there are seven ice plants with the locations and capacities specification as presented in Table IV.3.
The nearest ice plant to the commercial ponds location is at Metro with a distance of approximately 60 kilometres. This ice plant has a small capacity, namely of 150 tons per year.
| No. | L o c a t i o n | Unit | Capacity |
| I. | South Lampung | ||
| - Panjang | ton/year | 2,250 | |
| - Kalianda | ton/year | 150 | |
| - Gedong Tataan | ton/year | 150 | |
| II. | Central Lampung | ||
| - Metro | ton/year | 150 | |
| - Kuala Siputih | ton/year | 10,800 | |
| III. | North Lampung | ||
| - Kotabumi | ton/year | 4,500 | |
| IV. | Municipality of Tanjung Karang-Teluk Betung | ||
| - Teluk Betung | ton/year | 12,960 | |
Source : Industrial Service of Lampung-Teluk Betung.
From the above situation, it is obvious, that shrimp marketing facilities in Lampung are still very limited.
4.7. PROJECTION OF SHRIMP SUPPLY
During the period of 1971–1975 shrimp production in Indonesia has constantly increased (see Appendix IV.1.). On this basis, by using the time series method, shrimp supply in Indonesia is projected to increase from 84,380 tons in the year 1976 to 117,580 tons in the year 1981 (See Appendix IV.13).
In the preceding review, it was stated, that the proportion of marine shrimp in respect to the shrimp production during the period of 1973–1975, is approximately 77.2 pct. Whereas the rest are inland open water shrimps (approximately 9.1 pct) and brackish water pond culture shrimps (approximately 13.7 pct).
On this basis, the estimated shrimp production development for the period of 1976–1981 by kinds of catch, is as presented in Table IV.4.
| Year | Marine catch 1) | Inland open water catch 1) | Brackish water pond culture catch 1) | T o t a l 2) |
| 1976 | 65.14 | 7.68 | 11.56 | 84.38 |
| 1977 | 70.27 | 8.28 | 12.47 | 91.02 |
| 1978 | 75.39 | 8.89 | 13.38 | 97.66 |
| 1979 | 80.52 | 9.49 | 14.29 | 104.30 |
| 1980 | 85.65 | 10.10 | 15.20 | 110.94 |
| 1981 | 90.77 | 10.70 | 16.11 | 117.58 |
Source : Calculation of the Management Institute of the Economic Faculty of the University of Indonesia, based on Appendices IV.13 and IV.14.
1). Based on Appendix IV.14.
2). Based on Appendix IV.13.
4.8. PROJECTION OF SHRIMP DEMAND
4.8.1. By using the export data series during the period of 1968–1975, it is projected, that the fresh shrimp export potential of Indonesia in the future will increase, namely from 40,934 in the year 1976 to 65,655 tons in the year 1981 (See Appendix IV.15).
4.8.2. In addition to the export of fresh shrimp, there is also export processed/dried shrimp, which is also projected to increase from 997 tons in the year 1976 to 1,543 tons in the year 1981 (See Appendix IV.16).
4.8.3. Apart from that, on the basis of the calculation in Appendix IV.9, the domestic shrimp consumption is projected to increase from 5,408 tons in the year 1976 to 6,076 tons in the year 1981 (See Appendix IV.17).
4.8.4. From the above three projections, the demand of shrimp in Indonesia for the period of 1976 – 1981 can be estimated as presented in Table IV.5.
| Year | Projection of Fresh Shrimp Exports (ton) 1) | Projection of Processed Shrimp Exports (ton) 2) | Projection of Domestic Shrimp Consumption (ton) 3) | Projection of Shrimp demand (ton) 4) |
| 1976 | 40,934 | 997 | 5,408 | 47,339 |
| 1977 | 45,938 | 1,106 | 5,534 | 52,578 |
| 1978 | 50,942 | 1,215 | 5,663 | 57,820 |
| 1979 | 55,947 | 1,324 | 5,796 | 63,067 |
| 1980 | 60,951 | 1,433 | 5,936 | 68,318 |
| 1981 | 65,955 | 1,543 | 6,076 | 73,574 |
Source : Calculations by the Management Institute of the Economic Faculty of the University of Indonesia, based on Appendices IV.15, IV.16, IV.17.
1). Calculation based on Appendix IV.15.
2). Calculation based on Appendix IV.16.
3). Calculation based on Appendix IV.17.
4). (1) + (2) + (3).
4.9. MARKET SPACE
4.9.1. On the basis of the preceding projections of shrimp supply and demand, the market space for Indonesian shrimp is as presented in Table IV.6.
| Item | Unit | 1976 | 1977 | 1978 | 1979 | 1980 | 1981 |
| A. Projection Supply of Shrimp: | |||||||
- head on 1) | m.ton | 84,380 | 91,020 | 97,660 | 104,300 | 10,940 | 117,580 |
- headless 2) | m.ton | 42,190 | 45,510 | 48,830 | 52,150 | 55,470 | 58,790 |
| B. Projection Demand of Shrimp: | |||||||
- Headless 3) | m.ton | 47,339 | 52,578 | 57,820 | 63,067 | 68,318 | 73,576 |
| C. Estimate Market Space of Shrimp: | |||||||
- headless 4) | m.ton | 5,149 | 7,068 | 8,990 | 10,917 | 12,848 | 14,784 |
- head on 5) | m.ton | 10,298 | 14,136 | 17,980 | 21,834 | 25,696 | 29,568 |
Source : Processed on the basis of Appendix IV.10 and Table IV.5.
1). See Appendix IV.14.
2). Estimated Proportion of Body : head = 50 : 50
3). See Table IV.5.
4). C = B - A
5). Estimated proportion of body : head = 50 : 50
From Table IV.6. it can be observed, that the market space of shrimp will increase from 10,298 tons in the year 1976 to 29,568 tons in the year 1981, or an average increase of 23.48 pct. of the preceding year.
4.9.2. Increase of marine shrimp catching operations can be achieved by intensification. However, marine products potential is limited and in order to ensure the conversion of marine products, the increase of marine shrimp catch by intensification is limited.
Increase of inland open water shrimp catch can be achieved by extensification efforts. However, the locations where giant freshwater prawns can be found, are limited. Furthermore, the qualities of inland open water shrimps are difficult to standardize. For the increase of brackish water pond culture shrimps, there are various difficulties. Researches conducted by the Shrimp Research and Development Institute (LPPU) at Jepara, as well as at the brackish water test pond in Pekawatan (Lampung), show that there are various shrimp difficulties, among others in respect to provision of marine shrimp seedlingstock and breeding system, so that at present the increase potential of brackish water pond culture is still relatively small.
4.9.3. Considering the various limitations, as mentioned above, the development of shrimp supply in the future should be stressed by developing freshwater pond culture.
4.10. SALES PROGRAM OF P. T. SUMATRA FISHERIES DEVELOPMENT PROJECT
On the basis of the market space review, it can be observed that the demand potential of shrimp in the future is estimated as still sufficiently large. Based on this market space estimate, the Directorate General of Fisheries plans to establish a Giant Freshwater Prawn Culture undertaking in the Lampung region. The planned areal extent of the commercial ponds is 90 hectares with two alternatives production capacities, namely 121.5 tons and 180 tons per year. The scheduled sales program is as follows :
| 1st Alternative | 2nd Alternative | |
| Year I | 36.45 tons | 54.00 tons |
| Year II | 72.90 tons | 108.00 tons |
| Year III | 85.05 tons | 126.00 tons |
| Year IV | 97.20 tons | 144.00 tons |
| Year V | 109.35 tons | 162.00 tons |
| Year VI | 121.50 tons | 180.00 tons |
In order to support this sales program, it is necessary to develop a proper and effective marketing program, covering marketing channels- and agencies, pricing and marketing facilities.
4.11. PROPOSED MARKETING CHANNELS & AGENCIES
There are two alternatives for the marketing channels of the project, which can be adopted, depending on the planned marketing agencies. The first is, whether the marketing agencies will constitute an activity of the project itself, in which case it is planned to be managed by the Primary Fisheries Cooperative; the second is, if the marketing agencies will be conducted by private agents outside the project. Consideration of marketing channels should be based on the positive and negative aspects of these two alternative marketing agencies.
If the marketing agencies are conducted by the Primary Fisheries Cooperative, then in this case the Primary Fisheries Cooperative will act as collector and distributor of giant freshwater prawns from the farmers and despatch them to exporters in Jakarta.
The positive aspects of this alternative are, that an integration of over-all operation can be asured and coordination between production and marketing, so that the marketing/distribution chain is not too long and the distribution margins can be enjoyed by the Primary Fisheries Cooperative and the freshwater pond farmers. The negative aspects are, among others, the necessity of additional capital investment for the preparation of various marketing facilities and preparation of skilled and experienced personnel for the management of the Primary Fisheries Cooperative.
If the marketing process is to be handled conducted by a private agent outside the project, the Primary Fisheries Cooperative will only act as collector of giant freshwater prawns. Whereas the distribution to exporters in Jakarta will be conducted by a private entity outside the project. The positive aspects are, among others, that the cost structure is limited, and the span of management is limited. The negative aspects, viewed from the social aspects, are, that the income level of the freshwater pond farmers is relatively low, as the largest margins are controlled by agencies outside the project, besides that, the integration between production and marketing is less smooth and the marketing process is also less predictable as it is beyond the management control.
The above two alternative marketing channels can be presented as follows :
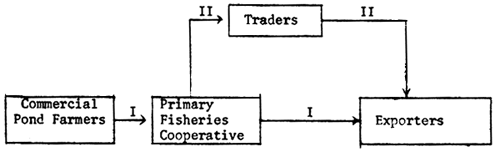
On the basis of the above analysis, the better alternative to manage the marketing process seems to be the first alternative.
4.12. PROPOSED PRICE STRUCTURE AND MARGINS
The project is designed to produce two qualities of shrimp.
On this basis, the project plans to produce quality A (1 to 25 heads/1b) amounting to 80 pct, and quality B (25 to 40 heads/1b) amounting to 20 pct of total production. The qualities produced are in accordance to the standard export quality stipulated by the Department of Trade.
The planned price structure and margins are as follows :
The selling price at the farmer level, is Rp. 1,200/kg (head on).
The selling price of the Primary Fisheries Cooperative, delivered at the exporters warehouse in Jakarta is Rp.3,000.--/kg headless for quality A, and Rp.2,500.--/kg headless for quality B.
The margin expected to be gained by the Primary Fisheries Cooperative is approximately 4 pct.
The terms of payment for the sales, from the farmers as well as from the Primary Fisheries Cooperative to the exporters in Jakarta, should be on cash basis.
4.13. PROPOSED MARKETING FACILITIES
In accordance with the description of the proposed marketing channels and agencies, the collection process from the freshwater pond farmers and the distribution to the exporters in Jakarta, will be donducted by the Primary Fisheries Cooperative.
In order to support these activities, various marketing facilities should be prepared, constituting the constrduction of insulated rooms and purchase of insulated trucks (for a detailed description see chapter on production aspect).
![]()
![]()
![]()