![]()
![]()
![]()
Hydrology of the coastal plains of Bangladesh presents a complicated interaction of fresh water flow from the upstream, the tides and tidal flows from the Bay of Bengal Tropical Cyclones, storm surge and other meteorological effect from the sea and the physiography of the coastal plains.
Projects concerned for these areas has to be planned and designed to utilize the available resources and to stand again- st constraints. In a complicated area like this there can be a large number of alternatives for development whereas some of hy- drologic elements may be constraints to some projects the others may be advantageous. As an example salinity is a constraint for rice farming whereas it is a resource for shrimp culture.
This chapter is therefore intended to provide a general picture of the Hydrologic elements in the area - data from which may be used for general planning and selection of alternatives for further intensive study at which stage further data collec- tion may be necessary for design of the project selected for implementation.
Hydrological Setting, Topography and Geology presents a general hydrologic environment of the area. Rainfall, tidal levels and flows and salinity distribution are major hydrologic elements that will affect planning of any schemes for the area. Rainfall is a resource for agricultural activity but along with dominant tide levels may be create serious drainage problems. As such frequencies of both these elements have been provided.
Salinity has its variation round the season. With the on set of moonsoon the salinity profile recedes and with the withdrawal of monsoon the salinity profile invades island.
Salinity intrusion at any point depend upon salinity at sea face, rate of diffusion of the intruded salinity and the fresh water flow from upstream. In localised basin areas, rate of exchange of basin water with the river flow may be create difference in salinity. In order to high light this situation experimental results for two selected basins have also been included.
The coastal plains of Bangladesh is subject to tidal inundation twice in a day by the semi-diurnal tide originating from the Bay of Bengal. During low flow season the tide penetrates far inland. Plate-I shows the tidal limit and current reversal limit for the lean season. Either whole or parts of the districts of Khulna, Barisal, Patuakhali, Noakhali, Comilla, Sylhet and Chittagong are predominantly under the tidal influence throughout the year. The major part of diurnal tidal inundation however occurs within the Gangetic delta of Bangladesh. The area has been formed by sedimentary deposit in the recent geologic time by the Ganges-Brahmaputra system.
The entire south-west area of Bangladesh to the right bank of Ganges-Padma is known as the Gengetic delta and has been formed primarily by the alluvium carried by the Ganges. The existing north-south river system somewhat parallel to each other are the remunants of major distributaries of the Ganges. Important of these are:
Ichamati, Shibsha, Passur, Madhumati-Haringhata, Biskhali, Lohalia, Tentulia etc. These north-south rivers are interconnected by smaller tidal creeks virtually forming a net work of rivers. Between these net work there are large saucer shaped tidal basin that are flooded and drained twice in a day by the tide.
The flat deltaic lands are interlaced by an intricate river and tidal channel system which cuts the land into numerous seperate areas. These channel carry flood water from the Ganges, Brahmaputra, Meghna and other rivers and also act as drainage channels for rainfall and tide to the Bay of Bengal. Many of these seperate land areas are saucer shaped basin lands with the higher elevations on natural banks adjacent to the river. During over bank flow heavy deposition of sediment occurs in the vicinity of the bank. This pattern is altered in cases where the rivers have recently changed course and cut through the centre of the ‘saucer’. The land masses are generally at elevation slightly above sea level but are subject to inundation at the higher portion of the tidal cycle. Ground level vary from below sea level to 20 feet or more above sea level. However more usual maximum level seldom exceed 10 feet. In Khulna district, the land is exceptionally flat and includes numerous low-lying areas called “Beels”. The area in this district is seperated from Bay of Bengal by mangrove swamp forests, known as “Sunderbans” which form a protective belt from 25 to 40 miles wide along the southern part of the district.
In Bakerganj and Noakhali districts, the land has greater variations in ground level than in Khulna Districts. The major offshore island or newly formed land are generally concave shaped with higher elevation near the centre. Land elevation on Bhola island, Ramgati and near Noakhali are generally higher than those in the remainder of the project area. Sediment laden water from the Ganges-Brahmaputra-Meghna river system passes through Barisal and Noakhali Districts and cause relatively repid changes in land forms due to erosion and sedimentation. The built-up and erosion of land masses is particularly evident on the major offshore islands of Bhola, Hatia and Sandwip. The southernmost portions of these districts front directly on the Bay of Bengal and are subject to wave action created by offshore winds as well as to normal river currents. The area in Chittagong District is located on a narrow piedmont zone along the western base of the Chittagong Hills. The land slopes quite uniformly from east to west and is dis-sected by courses of generally parallel small streams from the base of the hills to the sea. Larger rivers that head further inland also traverse the plains several locations. The polders in Chittagong District are bounded on the west by the Bay of Bengal. Location of coastal belt is shown in Plate-II.
The project area, except in Chittagong District has been formed by sediments deposited by the Ganges-Brahmaputra-Meghna river system. These sediments are thought to be as thick as 10000 feet. Logs of tube wells in the area indicate little changes in the character of the sediments to depths of 1,300 feet. Soils in the delta have some localised variation, both areally and stratigraphically, but consist primarily of fine sands, silts, silty sands, sand silts and clayey silts.
Remnants of swamp and forest appear in the form of peat layers, particularly in Khulna District, Excavation in this District show wood, trees or other vagetation at depths upto 100 feet below ground surface provides evidence of large-scale subsidence, caused by compaction of recent sediments and possibly by structural down-warping.
Geologically, the Bengal basin is one of the more active tectonic regions in the world. Morgan and Mclntire suggested that land in Noakhali District has been uplifted by four to six feet in the recent time.
In Chittagong District, the Agricultural Lands in the area have been formed by piedmont alluvial deposits transported from the Chittagong Hills by local streams and rivers, some land were formed by beach and tidal flat deposits. Soils in this district are generally younger and coarse textured than those in the remainder of the coastal belt, but show similar variations of sands, silts and occasional clays.
The climate and rainfall distribution of the area is of tropical nature dominated by the south-west monsoon of the Indian ocean. There are three distinct seasons: each of which has it's characteristics. The warm season lasts from March through May. The highest temperatures of the year occur during this period. About 15% of the annual rainfall occur during this period mainly as thunder storms often accompanied by strong winds. The humidity is generally high throughout the period.
The monsoon season normally begins in June and continues through October. In an average 75% to 80% of the annual rainfall occur during this period. Minimum temperature exceed 90°F and humidity approaches the saturation point, skies are over cast a large part of the time during the monsoon. Rain storms of several days duration characterized by relatively slow but steady rain occur during this season. Most of the destructive cyclonic storms with wind of more than 75 miles per hour, occur during premonsoon and post monsoon period, i.e. April-May and November. The cool season extends from November through February and is generally pleasant and comfortable. Rainfall in this season is infrequent. The lowest temperature of the year which vary from 45°F to 50°F are recorded in these months and daily maximum are usually below 90°F. Skies are generally clouldless during this season.
Fog occasionally occur in the early morning in the later part of the winter season (i.e. January-March) and last for several hours. Visibility is very poor during the period the fog lasts. The climatic data of Satkhira, Khepupara and Chiringa region are presented in Tables I to III.
Table-I:- Shows the extreme and average temperature, humidity and wind velocity of Khulna, sunshine duration of Jessore and evaporation of Satkhira.
Table-II:- Shows the extreme and average temperature, relative humidity, wind velocity and sunshine duration of Barisal and evaporation of Patuakhali.
Table-III:- Shows the extreme and average temperature, wind velocity and sunshine duration of Cox's Bazar & Relative Humidity and evaporation of Chittagong.
Monthly rainfall for stations at Satkhira, Barisal, Khepupara and Cox's Bazar for the period 1967–81 is presented in Tables IV to VII
Annual rainfall varies from 2500 mm to 1200 mm at Satkhira, 3200 mm to 1700 mm at Barisal, 4400 mm to 1500 mm at Khepupara and 4400 mm to 1800 mm at Cox's bazar. Even within coastal region, rainfall increases towards sea shore. Plate-3 shows mean annual rainfall isohytes.
There is extreme variation in the monthly rainfall distribution. In extreme case there may be no rainfall during November to March.
Premonsoon rainfall generally starts in March and monsoon starts in June and remain effective up to October. About 10% of annual rainfall occur during premonsoon period during March to May and 80% falls during monsoon. Concentreted premonsoon shower may cause 70 to 100 mm. rainfall.
Ten daily rainfall for 50% and 90% dry year from March to October is presented in Tables - VIII to X. During 90% dry year rainless period extends upto May. Daily rainfall for stations Cox's bazar, Lama, Kaliganj, Satkhira & Khepupara are presented in Annex ‘A’.
TABLE - I
CLIMATOLOGICAL DATA
SATKHIRA REGION
SOURCE : BRRI
| Temperature °C of Khulna | ||||||||||||
| J | F | M | A | M | J | J | A | S | O | N | D | |
| Highest | 32.2 | 36.1 | 39.4 | 40.6 | 41.7 | 39.4 | 37.2 | 36.1 | 37.2 | 36.1 | 34.4 | 31.7 |
| Av. Max | 26.3 | 29.2 | 33.4 | 34.6 | 34.3 | 32.6 | 31.2 | 31.3 | 31.7 | 31.3 | 29.1 | 26.7 |
| Av. Min | 13.6 | 16.1 | 21.0 | 24.2 | 25.6 | 26.1 | 26.2 | 26.2 | 26.0 | 24.3 | 19.1 | 14.7 |
| Lowest | 7.2 | 7.2 | 10.0 | 17.8 | 18.3 | 21.7 | 21.7 | 22.2 | 22.8 | 17.8 | 11.7 | 7.2 |
| Relative Humidity in % of Khulna | ||||||||||||
| 9 A.M. | 73 | 71 | 73 | 76 | 78 | 83 | 86 | 85 | 83 | 78 | 62 | 72 |
| 6 P.M. | 62 | 55 | 55 | 65 | 74 | 82 | 84 | 84 | 83 | 78 | 69 | 67 |
| Average wind velocity of Khulna | ||||||||||||
| Km/hr | 3.0 | 3.9 | 5.8 | 7.8 | 8.9 | 7.4 | 7.8 | 6.9 | 5.6 | 3.9 | 3.2 | 3.0 |
| ml/hr | 1.9 | 2.4 | 3.6 | 4.8 | 5.6 | 4.6 | 4.8 | 4.3 | 3.5 | 2.4 | 2.0 | 1.9 |
| Sunshine Duration of Jessore | ||||||||||||
| Hours of bright sunshine. | 9.1 | 9.5 | 8.7 | 8.9 | 9.7 | 4.8 | 5.1 | 5.7 | 5.9 | 8.2 | 9.3 | 9.4 |
| Day (Length) (hours) | 10.9 | 11.4 | 12.0 | 12.7 | 13.3 | 13.6 | 13.4 | 13.0 | 12.3 | 11.7 | 11.1 | 10.7 |
| Sunshine as % of Day Length | 83 | 83 | 72 | 70 | 73 | 35 | 38 | 44 | 48 | 70 | 84 | 88 |
| Mean Monthly Evaporation in mm of Satkhira | ||||||||||||
| Annual 1248.1 | 69.8 | 88.6 | 121.3 | 136.4 | 144.0 | 125.5 | 108.7 | 101.8 | 100.9 | 92.8 | 84.2 | 74.1 |
TABLE - II
CLIMATIC DATA
BARISAL REGION
| Temperature of °C of Barisal | ||||||||||||
| J | F | M | A | M | J | J | A | S | O | N | D | |
| Highest | 32.2 | 33.9 | 37.8 | 41.1 | 38.3 | 37.2 | 36.1 | 36.1 | 35.0 | 35.0 | 33.3 | 31.7 |
| Av. Max | 25.8 | 28.3 | 32.4 | 33.8 | 33.4 | 31.8 | 30.6 | 30.8 | 31.4 | 31.2 | 28.8 | 26.4 |
| Av. Min | 13.4 | 16.2 | 20.9 | 24.2 | 25.6 | 25.7 | 25.8 | 25.8 | 25.9 | 24.3 | 19.1 | 14.6 |
| Lowest | 6.1 | 5.6 | 12.8 | 15.0 | 18.3 | 21.1 | 21.1 | 21.1 | 21.7 | 17.8 | 10.6 | 7.2 |
| Relative Humidity in % of Barisal | ||||||||||||
| 9 A.M. | 76 | 74 | 74 | 74 | 74 | 83 | 87 | 85 | 83 | 79 | 78 | 78 |
| 6 P.M. | 60 | 56 | 56 | 66 | 74 | 82 | 83 | 83 | 82 | 77 | 69 | 64 |
| Average wind speed of Barisal | ||||||||||||
| km / h | 3.5 | 4.3 | 6.5 | 8.4 | 9.1 | 8.9 | 9.1 | 7.6 | 6.0 | 3.0 | 2.3 | 1.9 |
| ml / h | 2.2 | 2.7 | 4.0 | 5.2 | 5.7 | 5.6 | 5.7 | 4.7 | 3.7 | 1.9 | 1.4 | 1.2 |
| Sunshine hours of Barisal | ||||||||||||
| Hours of Bright sunshine | 8.4 | 8.4 | 7.9 | 8.0 | 7.7 | 3.7 | 3.8 | 3.1 | 5.8 | 7.1 | 8.5 | 9.4 |
| Day Length (Hours) | 10.9 | 11.4 | 12.0 | 12.7 | 13.3 | 13.6 | 13.4 | 13.0 | 12.3 | 11.7 | 11.1 | 10.7 |
| Sunshine as % of day length | 77 | 74 | 66 | 63 | 58 | 27 | 28 | 24 | 47 | 61 | 77 | 88 |
| Mean Monthly Evaporation of Patuakhali | ||||||||||||
| 1057.2 | 65.3 | 73.9 | 114.1 | 120.8 | 127.1 | 85.7 | 82.1 | 71.5 | 76.8 | 87.6 | 82.3 | 70.0 |
TABLE - III
CLIMATOLOGICAL DATA
CHITTAGONG REGION
| Temperature °C of Cox's Bazar | ||||||||||||
| J | F | M | A | M | J | J | A | S | O | N | D | |
| Heighest | 32.8 | 33.9 | 37.2 | 37.2 | 36.7 | 40.6 | 35.0 | 33.9 | 33.9 | 35.0 | 33.9 | 31.7 |
| Av. Max | 26.4 | 27.9 | 30.2 | 31.8 | 32.1 | 30.3 | 29.6 | 29.6 | 30.3 | 30.7 | 29.3 | 26.9 |
| Av. Min | 13.8 | 15.7 | 19.8 | 23.4 | 24.9 | 24.8 | 24.8 | 24.7 | 24.7 | 23.6 | 19.6 | 15.6 |
| Lowest | 7.8 | 9.4 | 11.1 | 16.7 | 16.7 | 20.6 | 21.7 | 19.4 | 21.7 | 17.2 | 13.3 | 8.9 |
| Relative Humidity in % of Chittagong | ||||||||||||
| 9 A.M. | 72 | 87 | 70 | 73 | 75 | 82 | 85 | 85 | 83 | 89 | 76 | 77 |
| 6 P.M. | 65 | 63 | 77 | 73 | 77 | 84 | 86 | 86 | 81 | 81 | 73 | 69 |
| Average wind velicity of Cox's Bazar | ||||||||||||
| km / h | 3.3 | 4.5 | 5.6 | 7.6 | 8.0 | 8.4 | 9.3 | 8.2 | 6.0 | 3.9 | 2.8 | 2.6 |
| mi / h | 2.1 | 2.8 | 3.5 | 4.7 | 5.0 | 5.2 | 5.8 | 5.1 | 3.7 | 2.4 | 1.8 | 1.6 |
| Sunshine Duration of Cox's Bazar | ||||||||||||
| Hours of Bright sunshine | 9.4 | 9.7 | 9.3 | 9.5 | 8.1 | 4.0 | 4.1 | 4.3 | 5.9 | 6.5 | 9.6 | 8.5 |
| Day Length (Hours) | 11.0 | 11.5 | 12.0 | 12.7 | 13.2 | 13.4 | 13.3 | 12.9 | 12.3 | 11.7 | 11.2 | 10.9 |
| Sunshine as % of day length | 85 | 84 | 78 | 75 | 61 | 30 | 31 | 33 | 48 | 56 | 86 | 78 |
| Relative Humidity of Cox's Bazar | ||||||||||||
| 9 A.M. | 77 | 74 | 77 | 78 | 80 | 86 | 89 | 89 | 86 | 82 | 80 | 81 |
| 6 P.M. | ||||||||||||
| Mean Monthly Evaporation in mm of Chittagong | ||||||||||||
| Annual 1432.5 | 88.2 | 103.8 | 131.5 | 160.6 | 163.8 | 127.9 | 137.5 | 130.0 | 105.9 | 104.6 | 94.8 | 83.9 |
Table - IV
Data : Rainfall (Monthly & Annual Total)
Station : Satkhira (M.M.)
| YEAR | JAN | FEB | MAR | APR | MAY | JUN | JLY | AUG | SEP | OCT | NOV | DEC | ANNUAL |
| 1967 | 247.1 | 0 | 53.3 | 94.2 | 152.6 | 367.4 | 281.0 | 264.7 | 286.6 | 120.4 | 0 | 0 | 1867.3 |
| 1968 | 0 | 28.4 | 25.6 | 48.8 | 5.8 | 491.6 | 523.3 | 413.8 | 66.0 | 210.8 | 87.7 | 0 | 1901.8 |
| 1969 | 4.8 | 1.3 | 52.6 | 48.0 | 52.1 | 142.4 | 307.0 | 548.8 | 504.5 | 34.7 | 5.6 | 0 | 1701.8 |
| 1970 | 5.6 | 69.6 | 40.5 | 81.5 | 83.8 | 381.5 | 401.8 | 199.8 | 940.3 | 273.8 | 15.7 | 0 | 2493.9 |
| 1971 | 27.5 | 9.9 | 0 | 184.3 | 164.8 | 405.5 | 570.7 | 340.9 | 240.0 | 232.9 | 14.0 | 0 | 2190.5 |
| 1972 | 0 | 113.8 | 0 | 38.6 | 24.1 | 200.2 | 265.9 | 412.1 | 136.9 | 33.0 | 0 | 0 | 1224.6 |
| 1973 | 0 | 9.7 | 115.6 | 35.8 | 182.7 | 178.0 | 308.7 | 306.5 | 333.7 | 112.5 | 93.7 | 127.0 | 1803.9 |
| 1974 | 0 | 0 | 125.1 | 88.5 | 189.8 | 114.7 | 501.1 | 312.6 | 410.2 | 174.8 | 0 | 0 | 1916.8 |
| 1975 | 3.5 | 29.5 | 1.3 | 17.8 | 126.3 | 254.7 | 679.7 | 280.0 | 152.7 | 84.3 | 64.8 | 0 | 1694.6 |
| 1976 | 0 | 57.2 | 0 | 64.0 | 161.2 | 80.0 | 434.3 | 339.4 | 234.4 | 86.2 | 0 | 0 | 1456.7 |
| 1977 | 0 | 90.2 | 0 | 140.9 | 140.1 | 492.0 | 604.4 | 230.0 | 135.4 | 58.5 | 13.9 | 32.6 | 1938.0 |
| 1978 | 0 | 6.6 | 66.9 | 147.1 | 192.5 | 235.0 | 404.1 | 386.3 | 772.9 | 167.6 | 31.8 | 0 | 2410.8 |
| 1979 | 0 | 0 | 5.1 | 30.5 | 35.6 | 512.3 | 378.5 | 288.0 | 207.0 | 67.3 | 31.8 | 0 | 1556.1 |
| 1980 | 0 | 85.1 | 72.4 | ||||||||||
| 1981 | |||||||||||||
| Max | 247.1 | 113.8 | 125.1 | 184.3 | 192.5 | 512.3 | 679.7 | 548.8 | 940.3 | 273.8 | 93.7 | 127.0 | 2493.9 |
| Mean | 20.6 | 35.8 | 39.9 | 78.5 | 116.3 | 296.6 | 435.4 | 332.5 | 340.0 | 127.4 | 27.6 | 12.3 | 1862.9 |
| Min | 0 | 0 | 0 | 17.8 | 5.8 | 80.0 | 265.9 | 199.8 | 66.0 | 67.3 | 0 | 0 | 1224.6 |
| 66 | 40 | 43 | 51 | 67 | 153 | 132 | 92 | 261 | 78 | 33 | 36 | 358 |
Table - V
Monthly & Annual Rainfall
Station: Barisal (M.M.)
| YEAR | JAN | FEB | MAR | APR | MAY | JUN | JLY | AUG | SEP | OCT | NOV | DEC | ANNUAL |
| 1967 | 135.2 | 56.1 | 158.7 | 331.5 | 451.4 | 470.2 | 266.3 | 0 | 0 | - | |||
| 1968 | 0 | 16.8 | 80.7 | 53.0 | 247.2 | 895.4 | 376.6 | 259.1 | 200.1 | 192.1 | 14.3 | 0 | 2335.3 |
| 1969 | 0 | 0 | 86.8 | 97.7 | 17.3 | 340.9 | 635.3 | 994.2 | 464.5 | 80.9 | 11.7 | 0 | 2729.3 |
| 1970 | 1.5 | 31.5 | 6.9 | 90.1 | 134.2 | 528.4 | 657.4 | 297.4 | 615.0 | 326.5 | 106.2 | 0 | 2795.1 |
| 1971 | 7.7 | 0.5 | 0 | 68.0 | 257.0 | 498.7 | 362.0 | 287.6 | 336.1 | 192.7 | 132.9 | 0 | 2143.2 |
| 1972 | 0 | 53.3 | 0 | 122.4 | 141.9 | 322.9 | 318.2 | 592.2 | 89.7 | 33.7 | 5.3 | 0 | 1679.6 |
| 1973 | 0 | 20.3 | 61.4 | 78.3 | 520.5 | 510.8 | 481.0 | 402.9 | 544.0 | 180.3 | 192.3 | 171.4 | 3163.2 |
| 1974 | 16.3 | 0 | 145.4 | 189.2 | 259.2 | 299.9 | 840.0 | 316.4 | 537.0 | 219.2 | 7.1 | 0 | 2829.7 |
| 1975 | 3.8 | 6.6 | 0 | 5.8 | 189.2 | 308.6 | 424.4 | 391.4 | 273.1 | 253.8 | 62.7 | 0 | 1919.4 |
| 1976 | 0 | 30.5 | 0 | 89.6 | 212.2 | 416.2 | 386.6 | 446.1 | 274.3 | 132.0 | 0 | 0 | 1987.5 |
| 1977 | 67.3 | 38.1 | 0 | 301.6 | 356.9 | 629.5 | 391.6 | 217.6 | 324.0 | 79.9 | 83.6 | 0 | 2490.1 |
| 1978 | 0 | 7.6 | 14.9 | 188.7 | 407.7 | 625.9 | 399.6 | 407.1 | 356.3 | 94.8 | 2.8 | 0 | 2505.4 |
| 1979 | 6.4 | 19.6 | 0 | 46.0 | 5.0 | 465.0 | 459.0 | 560.0 | 404.0 | 51.0 | 5.0 | 0 | 2021.0 |
| 1980 | 0 | 56.0 | 44.0 | 30.0 | 188.7 | 184.4 | 520.4 | 252.5 | 131.1 | 301.2 | 0 | 0 | 1708.3 |
| 1981 | 31.7 | 25.6 | 109.7 | 311.4 | 187.7 | N.A. | N.A. | 286.3 | 172.0 | 14.5 | 0 | 25.4 | - |
| 1982 | 0 | 17.8 | 5.1 | 182.9 | 34.8 | 412.2 | 198.9 | 545.8 | 196.1 | 1.3 | 15.8 | 1.3 | 1612.0 |
| Max | 67.3 | 56.0 | 145.4 | 311.4 | 520.5 | 895.4 | 840.0 | 994.2 | 615.0 | 326.5 | 192.3 | 171.4 | 3163.2 |
| Mean | 9.0 | 21.6 | 37.0 | 124.4 | 201.0 | 439.8 | 452.2 | 419.2 | 336.7 | 151.3 | 40.0 | 12.4 | 2280.0 |
| Min | 0 | 0 | 0 | 5.8 | 5.0 | 158.7 | 198.9 | 217.6 | 89.7 | 1.3 | 0 | 0 | 1679.6 |
| 18 | 18 | 98 | 90 | 143 | 189 | 159 | 192 | 158 | 105 | 59 | 43 | 487 |
Table - VI
Monthly & Annual Rainfall
Station: Khepupara (M.M.)
| YEAR | JAN | FEB | MAR | APR | MAY | JUN | JLY | AUG | SEP | OCT | NOV | DEC | ANNUAL |
| 1967 | |||||||||||||
| 1968 | 22.9 | 82.9 | 868.4 | 654.0 | 619.6 | 208.8 | 193.2 | 23.3 | 0 | - | |||
| 1969 | 1.3 | 0 | 135.3 | 102.3 | 138.2 | 319.7 | 494.5 | 853.7 | 463.8 | 135.7 | 24.9 | 0 | 2669.4 |
| 1970 | 9.1 | 74.3 | 37.5 | 48.3 | 54.8 | 475.4 | 866.0 | 518.8 | 700.1 | 989.9 | 0 | 0 | 3774.2 |
| 1971 | 30.4 | 0 | 0 | 538.8 | 546.9 | 790.3 | 1037.4 | 824.3 | 569.5 | 72.1 | 0 | 0 | 4409.7 |
| 1972 | 0 | 23.3 | 0 | 59.5 | 17.8 | 150.0 | 268.7 | 726.4 | 208.1 | 42.2 | 14.2 | 0 | 1510.2 |
| 1973 | 0 | 24.9 | 43.2 | 58.1 | 199.1 | 332.8 | 452.3 | 505.7 | 446.5 | 215.0 | 165.9 | 151.1 | 2594.6 |
| 1974 | 0 | 0 | 91.7 | 29.2 | 207.8 | 258.9 | 633.1 | 510.8 | 355.9 | 316.7 | 85.3 | 0 | 2489.4 |
| 1975 | 0 | 5.6 | 0 | 8.1 | 231.6 | 214.3 | 811.5 | 462.4 | 457.9 | 203.9 | 185.8 | 0 | 2581.1 |
| 1976 | 0 | 35.1 | 0 | 60.5 | 56.3 | 433.1 | 876.9 | 331.2 | 90.8 | 67.3 | 17.8 | 0 | 1969.0 |
| 1977 | 19.0 | 30.5 | 0 | 269.9 | 287.1 | 1076.0 | 494.2 | 529.5 | 130.8 | 155.0 | 24.4 | 0 | 3016.4 |
| 1978 | 0 | 0 | 6.1 | 157.8 | 505.9 | 633.4 | 599.2 | 520.8 | 559.2 | 266.5 | 30.5 | 0 | 3279.4 |
| 1979 | 0 | 6.4 | 0 | 10.2 | 19.1 | 1015.5 | 457.7 | 863.1 | 411.0 | 63.5 | 35.6 | 47.0 | 2429.1 |
| 1980 | 0 | 55.9 | 50.5 | N.A. | 324.9 | N.A. | 488.2 | 688.8 | 325.6 | 265.4 | 0 | 0 | - |
| 1981 | 34.5 | 12.7 | 95.5 | 363.2 | 240.5 | 379.0 | 715.5 | 414.8 | 310.1 | 29.2 | 0 | 31.0 | 2626.0 |
| Max | 34.5 | 74.3 | 135.3 | 538.8 | 546.9 | 1076.0 | 1037.4 | 863.1 | 700.1 | 989.9 | 185.8 | 151.1 | 4409.7 |
| Mean | 7.3 | 20.7 | 35.4 | 123.5 | 208.1 | 534.4 | 632.1 | 597.9 | 374.2 | 215.4 | 43.4 | 16.4 | 2808.8 |
| Min | 0 | 0 | 0 | 8.1 | 17.8 | 150.0 | 268.7 | 331.2 | 90.8 | 29.2 | 0 | 0 | 1510.2 |
| 12 | 24 | 46 | 160 | 167 | 311 | 210 | 168 | 176 | 241 | 60 | 41 | 764 |
Table - VII
Monthly & Annual Rainfall
Station : Cox's Bazar (M.M.)
| YEAR | JAN | FEB | MAR | APR | MAY | JUN | JLY | AUG | SEP | OCT | NOV | DEC | ANNUAL |
| 1967 | 58.0 | 0 | 2.0 | 135.1 | 80.8 | 715.3 | 1168.6 | 935.7 | 924.1 | 275.4 | 0 | 0 | 4295.0 |
| 1968 | 39.6 | 37.9 | 7.3 | 64.7 | 338.5 | 1078.2 | 902.3 | 971.7 | 201.0 | 276.4 | 2.8 | 0 | 3920.4 |
| 1969 | 0 | 0 | 74.7 | 91.9 | 113.1 | 945.4 | 1361.3 | 1187.5 | 459.2 | 123.1 | 20.1 | 0 | 4376.3 |
| 1970 | 0 | 38.1 | 0 | 64.7 | 431 9 | 584.3 | 1470.7 | 709.8 | 393.5 | 402.2 | 63.8 | 0 | 4159.0 |
| 1971 | 3.3 | 0.2 | 0.8 | 7.7 | 48.5 | 1315.4 | 1550.4 | 845.3 | 176.0 | 186.8 | 191.8 | 0 | 4326.2 |
| 1972 | 0 | 4.3 | 0 | 88.6 | 109.0 | 286.7 | 325.4 | 814.5 | 108.1 | 176.3 | 0.5 | 0 | 1913.4 |
| 1973 | 2.5 | 4.1 | 1.5 | 13.5 | 518.6 | 819.6 | 875.9 | 462.9 | 364.3 | 275.7 | 250.6 | 21.9 | 3611.1 |
| 1974 | 2.8 | 0 | 155.4 | 74.7 | 479.8 | 1178.2 | 1294.9 | 790.3 | 252.4 | 115.2 | 88.0 | 0 | 4431.7 |
| 1975 | 0 | 25.4 | 0 | 9.7 | 253.3 | 476.7 | 1792.9 | 446.2 | 280.0 | 684.0 | 354.3 | 0 | 4322.5 |
| 1976 | 0 | 0 | 0 | 107.5 | 252.1 | 887.2 | 1791.1 | 675.6 | 58.3 | 234.4 | 274.1 | 0 | 4280.3 |
| 1977 | 0 | 21.6 | 0 | 607.0 | 335.0 | 933.3 | 1097.6 | 647.8 | 237.3 | 24.1 | 52.8 | 30.5 | 3987.0 |
| 1978 | 0 | 0 | 0 | 107.6 | 480.6 | 885.0 | 533.8 | 571.9 | 477.5 | 186.1 | 0 | 0 | 3242.5 |
| 1979; | 0 | 0 | 0 | 14.0 | 94.7 | 214.6 | - | - | - | - | - | - | - |
| 1980 | - | - | - | 383.3 | 1038.6 | 674.4 | 1046.2 | 249.2 | 318.0 | 0 | 0 | 30.2 | - |
| 1981 | 30.2 | 2.03 | 39.6 | 196.1 | 271.8 | 641.9 | 818.9 | 471.2 | 417.6 | 60.5 | 10.9 | 29.7 | 2990.4 |
| Max | 58.0 | 38.1 | 155.4 | 607.0 | 1038.6 | 1315.4 | 1792.9 | 1187.5 | 924.1 | 684.0 | 354.3 | 30.5 | 4431.7 |
| Mean | 9.7 | 9.5 | 20.1 | 132.9 | 323.1 | 775.7 | 1145.0 | 698.5 | 333.4 | 215.7 | 93.6 | 8.0 | 3765.2 |
| Min | 0 | 0 | 0 | 7.7 | 48.5 | 214.6 | 325.4 | 249.2 | 58.3 | 0 | 0 | 0 | 1913.4 |
| 19 | 15 | 44 | 168 | 254 | 309 | 436 | 249 | 212 | 174 | 122 | 13 | 735 |
TABLE - VIII
STATION : SATKHIRA
RAINFALL IN M.M.
| MONTH | 1ST 10-DAY | 2ND 10-DAY | 3RD 10-DAY | |||
| 50% | 90% | 50% | 90% | 50% | 90% | |
| MAR | 0 | 0 | 0 | 0 | 1 | 0 |
| APR | 4 | 0 | 42 | 0 | 7 | 0 |
| MAY | 12 | 0 | 36 | 0 | 42 | 0 |
| Jun | 50 | 2 | 66 | 36 | 100 | 10 |
| JULY | 115 | 50 | 135 | 41 | 121 | 60 |
| AUG | 116 | 32 | 100 | 30 | 121 | 37 |
| SEP | 52 | 25 | 63 | 15 | 63 | 5 |
| OCT | 44 | 12 | 10 | 0 | 15 | 0 |
TABLE - IX
STATION : KHEPUPARA
RAINFALL IN M.M.
| MONTH | 1ST 10-DAY | 2ND 10-DAY | 3RD 10-DAY | |||
| 50% | 90% | 50% | 90% | 50% | 90% | |
| MAR | 0 | 0 | 0 | 0 | 0 | 0 |
| APR | 0 | 0 | 5 | 0 | 4 | 0 |
| MAY | 30 | 0 | 53 | 6 | 55 | 2 |
| JUN | 134 | 13 | 106 | 67 | 117 | 44 |
| JULY | 203 | 84 | 187 | 105 | 158 | 37 |
| AUG | 175 | 60 | 175 | 47 | 126 | 34 |
| SEP | 144 | 30 | 97 | 23 | 85 | 10 |
| OCT | 75 | 21 | 19 | 0 | 30 | 0 |
TABLE - X
STATION : COX'S BAZAR
RAINFALL IN M.M.
| MONTH | 1ST 10-DAY | 2ND 10-DAY | 3RD 10-DAY | |||
| 50% | 90% | 50% | 90% | 50% | 90% | |
| MAR | 0 | 0 | 0 | 0 | 0 | 0 |
| APR | 0 | 0 | 18 | 0 | 5 | 0 |
| MAY | 20 | 0 | 75 | 2 | 113 | 15 |
| JUN | 188 | 30 | 190 | 30 | 192 | 75 |
| JULY | 287 | 32 | 295 | 83 | 327 | 85 |
| AUG | 277 | 110 | 176 | 42 | 175 | 52 |
| SEP | 105 | 7 | 41 | 16 | 58 | 12 |
| OCT | 42 | 0 | 19 | 0 | 40 | 0 |
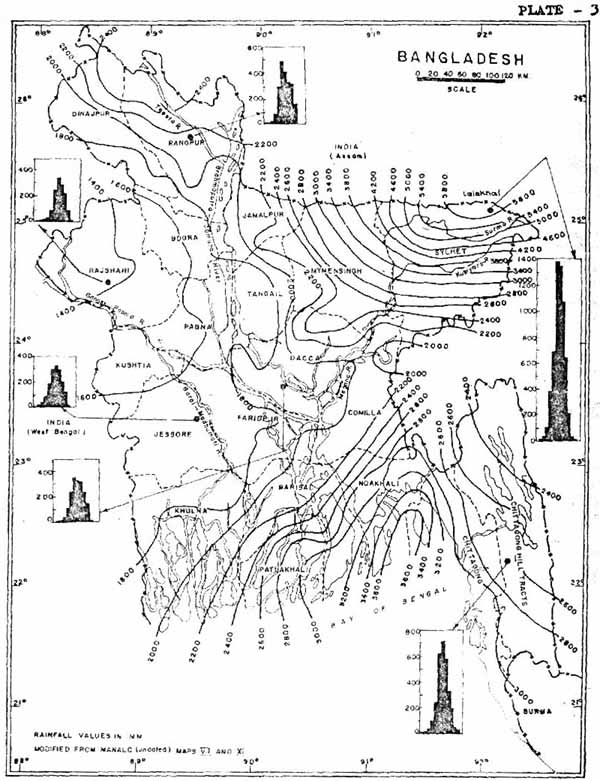
Mean annual rainfall and mean monthly distribution at selected stations.
Bangladesh coast is notoriously known for the tropical cyclones that may cause tremendous loss to the men and material. It is therefore, pertinent to have an account of these cyclones. Table-XI shows monthly and annual frequency of depressions and deep depression in the Bay from 1948 to 1979. Table-XII shows the number of such depression that matured in to cyclonic storms and severe cyclonic storms over the period. It will be noticed that allthough the highest number of depressions occured during September the depression that matured into severe cyclonic storms is maximum during May in the premonsoon period and during October and November in the post monsoon period. These two periods are the periods of transition for the onset and recession of monsoon. Some characteristics of the cyclonic storm observed during 1979 i.e. effective radius in miles, estimated lowest central pressure estimated maximum wind. Remarkable cyclones that affected Bangladesh from 1795 to 1965 are listed in Table-XIII.
A few typical cyclone tracks hitting Bangladesh coast is shown in Plate - 4.
![]()
![]()
![]()