![]()
![]()
![]()
The Bay of Bengal is the source of salinity in the coastal estuaries in Bangladesh. During every high tide the saline water from the Bay enters the estuaries, mixes with the upland flow. Turbulent diffusion of this salinity travels up stream with decreasing concentration.
At every section of an estuary, salinity varies with the state of tide and also with the up land flow. Bangladesh has a monsoonic climate. The upland river flow has a distinct seasonal pattern. The upland flow increases from June to reach the peak in August/September and decreases from October. With this variation of fresh water flow salinity varies inversely. Salinity front of a particular concentration starts moving upstreams from October and starts moving towards sea during June.
The Ocean water has salinity of 35 parts per thousand whereas in the Bay of Bengal close to Bangladesh coast it is 30–32 parts per thousand. This is due to discharge of sweet water by the three big rivers.
It has been found that the relative chemical composition of Sea water is essentially constant. The greatest ionic concentrations in sea water are Chloride, Sodium, Sulfate, Magnesium, Calcium and Potassium in that order. Many other ionic constituents are present, but in smaller or trace concentration. The total dissolved solid contents of most sea water average about 34,500 PPM.
Interms of percentage they stand as follows :
| Sl.No. | Name of ions | Constitution in terms of percent |
| 1. | Chloride | 55.04 |
| 2. | Sodium | 30.61 |
| 3. | Sulfate | 7.68 |
| 4. | Potassium | 1.10 |
| 5. | Magnesium | 3.69 |
| 6. | Calcium | 1.16 |
| 7. | Strontium | 0.04 |
| 8. | Bi-Carbonate | 0.41 |
| 9. | Boric Acid | 0.07 |
| Total: 99.8 |
Among the various units of measuring salinity the following are more popular.
| (1) | Total Dissolved Solids (TDS) | in PPM |
| (2) | Chloride | in PPM |
| (3) | Electrical conductivity | in micro mhos/ at 25°C. |
Of these TDS is difficult to evaluate. Chloride can easily to determined by titrating a known quantity of water sample by AgNo3, solution of known strength. Electrical conductivity meters with temperature compensation arrangement is easy means for field measurement of salinity.
For sea water the relation ship between the three units are as follows :
Salinity in PPM = 0.64×E.C.M Mhos.
Salinity in PPM = 30+1.805 Chlorinity (PPM)
Average monthly electrical conductivity in micro-mhos for a few stations in Satkhira area is given below:
| Sl. No. | Name of Station | Name of River | M o n t h | |||||
| Jan | Feb | Mar | Apr | May | Jun | |||
| 1. | Shankra | Ichamati | 5530 | 10783 | 17103 | 20233 | 21467 | 18050 |
| 2. | Elarchar | Marirchap | 6180 | 7785 | 12790 | 16680 | 15550 | 17725 |
| 3. | Kaliganj | Coaxialy river | 14200 | 14100 | 16900 | 18300 | 20100 | 18400 |
Monthly variation of electrical conductivity at a few important stations in Bangladesh coast at High and Low water slack is shown in Tables-XIV to XX.
TABLE - XI
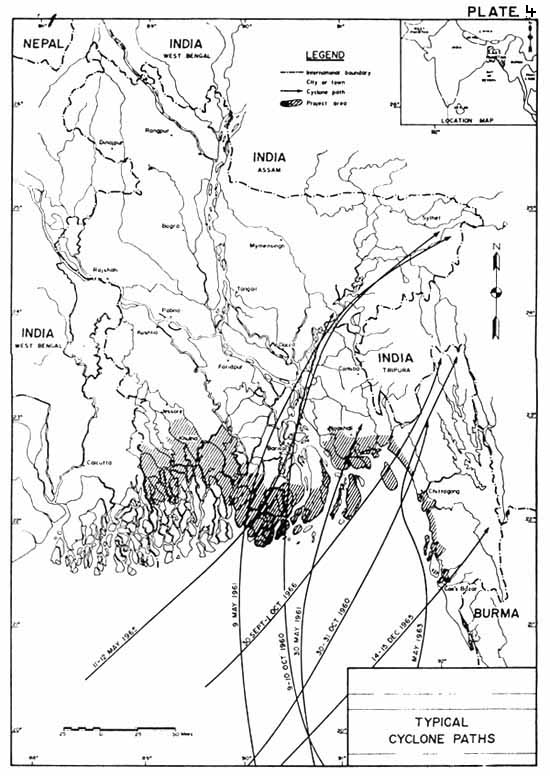
FREQUENCY DISTRIBUTION OF TROPICAL CYCLONES FORMING IN THE BAY OF BENGAL 1948–1970
| Cyclonic Intensity | Cyclones (No.) | |||||||||||
| Jan | Feb | Mar | Apr | May | Jun | Jul | Aug | Sep | Oct | Nov | Dec | |
| Depression | 1 | 1 | None | 3 | 8 | 25 | 31 | 32 | 37 | 21 | 6 | 5 |
| Moderate Storms | 2 | None | None | None | 1 | 2 | 1 | 3 | 6 | 15 | 14 | 4 |
| Severe Storm | None | None | None | None | 6 | None | None | None | 1 | 5 | 3 | 4 |
| Total : | 3 | 1 | None | 3 | 25 | 27 | 32 | 35 | 44 | 41 | 23 | 13 |
TABLE - XII
CYCLOGENESES OVER THE BAY OF BENGAL 1948–70
| Year | N u m b e r | ||||
| Number of Dipressions | Moderate Storms | Severe Storms | Total | Crossed near Bangladesh coast | |
| 1948 | 9 | 3 | None | 12 | 2 |
| 1949 | 4 | 1 | None | 5 | 1 |
| 1950 | 7 | 2 | 2 | 11 | 2 |
| 1951 | 10 | 2 | None | 12 | 1 |
| 1952 | 6 | 2 | None | 8 | None |
| 1953 | 6 | 1 | None | 7 | None |
| 1954 | 6 | 1 | None | 7 | None |
| 1955 | 12 | 3 | None | 15 | 2 |
| 1956 | 10 | 2 | None | 12 | None |
| 1957 | 7 | 1 | None | 8 | None |
| 1958 | 9 | 4 | None | 13 | 1 |
| 1959 | 9 | 1 | 1 | 11 | 2 |
| 1960 | 7 | 1 | 2 | 10 | 4 |
| 1961 | 7 | 1 | 1 | 9 | 4 |
| 1962 | 5 | 5 | None | 10 | 1 |
| 1963 | 4 | 2 | 1 | 7 | 3 |
| 1964 | 7 | 2 | 2 | 11 | 2 |
| 1965 | 7 | 1 | 2 | 10 | 4 |
| 1966 | 7 | 8 | 1 | 16 | 3 |
| 1967 | 7 | 4 | 2 | 13 | 1 |
| 1968 | 8 | 3 | 3 | 14 | 3 |
| 1969 | 10 | 6 | None | 16 | 1 |
| 1970 | 2 | 1 | 2 | 5 | 5 |
| Total | 166 | 57 | 19 | 242 | 42 |
TABLE - XIII
REMARKABLE CYCLONES THAT HAVE AFFECTED BANGLADESH 1795 – 1965
| Year | Month | Location |
| 1795 | May - June | Severe gate at Chittagong on 3 June |
| 1797 | - | Furious Hurricane at Chittagong |
| 1822 | May | Storm wave at Barisal |
| 1831 | October | Storm wave at Barisal |
| 1872 | October | Destructive cyclone over Cox's Bazar Sub-division. |
| 1876 | 31 October | Bachorganj Cyclone |
| 1893 | October | Feni |
| 1895 | October | Bagerhat Cyclone |
| 1895 | December | Severe cyclone western Meghna Estuary |
| 1897 | 31 October | Series of storm wave over Kutubdia |
| 1898 | May | Teknaf |
| 1901 | November | Western Sunderbans |
| 1909 | October | Western Sunderbans |
| 1909 | December | Cox's Bazar |
| 1911 | April | Teknaf |
| 1912 | 1 November | Khulna - Faridpur |
| 1917 | May | Sunderbans |
| 1919 | 24 September | Barisal cyclone |
| 1922 | April | Teknaf |
| 1923 | May | Teknaf |
| 1926 | May | Cox's Bazar accompanied by storm wage |
| 1941 | May | Storm wave eastern Meghna Estuary |
| 1942 | October | Sunderbans |
| 1960 | 10 October | Chittagong, Noakhali, Comilla & Barisal |
| 1960 | 31 October | Chittagong, offshore island of North Noakhali |
| 1965 | 11–12 May | Barisal, Noakhali, Faridpur, Comilla & Dhaka. |
| 1970 | November | Barisal, Noakhali and Chittagong. |
Table - XIV SALINITY DATA (E.C.) M/Mhos.
| River : Rupsa-Pasur | Station : Khulna. |
| Year | Stage | Item | Apr | May | Jun | Jly | Aug | Sept | Oct | Nov | Dec | Jan | Feb | Mar |
| 1976–77 | HWS | Max Mean Min | 13000 10420 7300 | 13600 9877 4700 | 6000 1312 210 | 270 235 210 | 270 249 210 | 335 280 250 | 260 253 240 | 300 279 260 | 345 320 300 | 460 403 355 | 1950 771 410 | 4000 2125 460 |
| LWS | Max Mean Min | 11300 8600 6000 | 12000 7544 2400 | 2700 775 200 | 310 273 230 | 255 243 215 | 360 271 230 | 255 236 220 | 300 277 260 | 350 317 300 | 460 395 350 | 700 497 415 | 1425 1288 450 | |
| 1977–78 | HWS | Max Mean Min | 7950 2794 460 | 1570 576 320 | 1000 348 220 | 250 223 200 | 230 210 190 | 220 220 220 | 280 260 230 | 310 305 300 | 460 351 320 | 440 386 340 | 480 374 350 | |
| LWS | Max Mean Min | 4000 1321 430 | 590 369 310 | 350 275 220 | 220 208 200 | 230 215 200 | 240 230 220 | 270 260 250 | 310 303 290 | 400 352 320 | 440 377 340 | 400 363 350 | ||
| 1978–79 | HWS | Max Mean Min | 570 412 310 | 1300 387 310 | 320 252 200 | 335 311 300 | 450 388 335 | 420 378 340 | 480 435 400 | 1050 485 400 | ||||
| LWS | Max Mean Min | 340 316 290 | 440 288 290 | 340 242 170 | 320 257 150 | 360 343 330 | 430 374 340 | 440 426 360 | 780 443 380 | |||||
| 1979–80 | HWS | Max Mean Min | 1300 712 420 | 1500 693 400 | 750 441 320 | 360 337 290 | 3540 418 360 | 3900 856 435 | 5500 2507 710 | |||||
| LWS | Max Mean Min | 700 528 410 | 1100 532 390 | 500 378 270 | 360 335 270 | 530 398 340 | 1420 644 415 | 3800 1785 640 |
Table - XV SALINITY DATA (E.C.) M/Mhos.
| River : Alaipur-Daratana | Station : Bagerhat. |
| Year | Stage | Item | Apr | May | Jun | Jly | Aug | Sept | Oct | Nov | Dec | Jan | Feb | Mar |
| 1976–77 | HWS | Max Mean Min | 9000 7950 5200 | 9200 7681 5800 | 8100 6072 3600 | 725 622 500 | 1220 9954 650 | 2350 1670 1050 | 4500 3573 2350 | 7500 6065 4000 | ||||
| LWS | Max Mean Min | 8900 7693 4100 | 9300 7732 5700 | 8100 6065 3600 | 725 581 440 | 1250 932 580 | 2350 1531 1025 | 4800 2209 2300 | 10500 6039 3900 | |||||
| 1977–78 | HWS | Max Mean Min | 30000 9353 6000 | 7000 3515 1300 | 3300 2430 850 | 1100 713 440 | 1050 572 340 | 850 638 420 | 580 567 560 | 670 629 540 | 1150 870 615 | 3000 1847 940 | 5000 3837 2600 | |
| LWS | Max Mean Min | 19000 8010 5500 | 7000 4553 1200 | 3200 2507 850 | 1150 383 410 | 1075 569 340 | 900 620 380 | 550 547 540 | 680 604 500 | 1080 825 715 | 2900 1837 1080 | 5500 3913 2600 | ||
| 1978–79 | HWS | Max Mean Min | 7000 6083 5500 | 8000 6417 5000 | 4500 4250 4000 | 750 695 580 | 1750 922 665 | 3250 2379 1530 | 8000 6006 3400 | |||||
| LWS | Max Mean Min | 7000 6110 5500 | 8000 6400 5000 | 4500 4250 4000 | 890 735 650 | 1400 852 700 | 3600 2182 1300 | 8000 5140 3000 | ||||||
| 1979–80 | HWS | Max Mean Min | 16000 10118 3100 | 7250 4598 3500 | 5500 4216 3400 | 950 760 610 | 1400 1075 910 | 3000 2070 1200 | 5900 4344 3100 | 10200 8166 5400 | ||||
| LWS | Max Mean Min | 16000 9977 3200 | 6900 4525 3500 | 4800 3983 3400 | 925 703 530 | 1100 615 750 | 2950 1940 1200 | 5600 3885 2800 | 10000 7632 5200 |
Table - XVI SALINITY DATA (E.C.) M/Mhos.
| River : Tehulia | Station : Ilshaghat. |
| Year | Stage | Item | Apr | May | Jun | Jly | Aug | Sept | Oct | Nov | Dec | Jan | Feb | Mar |
| 1976–77 | HWS | Max Mean Min | 1500 416 145 | 180 146 130 | 220 147 120 | 160 158 155 | 185 180 175 | 190 185 180 | 198 177 150 | 220 199 175 | 275 229 190 | 690 287 220 | 1200 391 190 | |
| LWS | Max Mean Min | 3400 830 145 | 185 149 120 | 220 154 120 | 175 167 160 | 215 175 145 | 215 188 160 | 300 186 140 | 330 207 175 | 265 228 210 | 1150 328 220 | 1750 435 190 | ||
| 1977–78 | HWS | Max Mean Min | 995 289 130 | 180 133 110 | 180 132 110 | 205 200 195 | 220 212 205 | 280 240 215 | 620 305 240 | 2700 617 230 | ||||
| LWS | Max Mean Min | 3250 514 130 | 220 156 110 | 260 156 110 | 200 198 195 | 225 218 210 | 290 244 210 | 540 287 230 | 3500 696 230 | |||||
| 1978–79 | HWS | Max Mean Min | 1800 658 230 | 675 290 190 | 220 183 145 | 240 221 200 | 625 279 220 | 850 328 250 | 2700 668 255 | |||||
| LWS | Max Mean Min | 2000 719 210 | 725 328 180 | 260 213 160 | 240 233 230 | 640 273 230 | 775 263 250 | 3500 799 205 | ||||||
| 1979–80 | HWS | Max Mean Min | 4500 1007 200 | 580 268 145 | 160 148 140 | 175 164 140 | 205 186 170 | 240 212 185 | 800 286 185 | 1250 442 175 | ||||
| LWS | Max Mean Min | 5000 958 200 | 900 313 150 | 240 180 140 | 175 164 150 | 200 184 170 | 260 218 195 | 800 329 210 | 1850 462 195 |
Table - XVII SALINITY DATA (E.C.) M/Mhos.
| River : Jamuna. | Station : Kaliganj (Khulna) |
| Source : BWDB. |
| Year | Stage | Item | Apr. | May. | Jun. | Jly. | Aug. | Sept. | Oct. | Nov. | Dec. | Jan. | Feb. | Mar. |
| 1976–77 | HWS | Max Mean Min | 11000 10486 9000 | 12000 10985 10200 | 14400 13129 11200 | 16700 14768 11700 | 18000 15987 15600 | |||||||
| LWS | Max Mean Min | 9900 9646 8720 | 11250 10439 9500 | 15000 12894 10600 | 15800 14586 12200 | 17800 15925 15300 | ||||||||
| 1977–78 | HWS | Max Mean Min | 20000 18280 16800 | 22000 19680 18500 | 21000 17815 14000 | |||||||||
| LWS | Max Mean Min | 22000 17792 16300 | 22000 19578 17800 | 21000 16636 5000 | ||||||||||
| 1978–79 | HWS | Max Mean Min | ||||||||||||
| LWS | Max Mean Min | |||||||||||||
Table - XVIII SALINITY DATA (E.C.) M/Mhos.
| River : Ichamati. | Station : Satkhira. |
| Year | Stage | Item | Apr. | May. | Jun. | Jly. | Aug. | Sept. | Oct. | Nov. | Dec. | Jan. | Feb. | Mar. |
| 1976–77 | HWS | Max Mean Min | 11500 10407 9000 | 16300 13100 8600 | 30000 19493 9000 | |||||||||
| LWS | Max Mean Min | 11200 7980 5900 | 15500 12780 7000 | 30000 17274 10000 | ||||||||||
| 1977–78 | HWS | Max Mean Min | 27500 20743 15600 | 33000 27161 18000 | 31500 17348 950 | 675 657 640 | 700 700 700 | 675 647 620 | 9700 9050 7800 | |||||
| LWS | Max Mean Min | 33000 21133 16200 | 33000 26908 17600 | 32500 15907 850 | 900 820 740 | 720 697 675 | 600 600 600 | 9900 9625 9300 | ||||||
| 1978–79 | HWS | Max Mean Min | 24000 21700 19000 | 26000 24625 23500 | ||||||||||
| LWS | Max Mean Min | 23000 20200 18000 | 25000 23250 22000 | |||||||||||
| 1979–80 | HWS | Max Mean Min | 8000 7667 7000 | 8000 8000 8000 | 17000 15125 12000 | |||||||||
| LWS | Max Mean Min | 8000 7667 7000 | 8000 7250 5000 | 15000 13875 11000 |
Table - XIX SALINITY DATA (E.C.) M/Mhos.
| River : Betua Kholpetua | Station : Benerpota. |
| Year | Stage | Item | Apr. | May | Jun | Jly | Aug | Sept | Oct | Nov | Dec | Jan | Feb | Mar |
| 1976–77 | HWS | Max Mean Min | 5200 4311 2500 | 10750 6520 3200 | 18700 14903 7300 | |||||||||
| LWS | Max Mean Min | 5000 3656 2600 | 10900 6078 3200 | 18700 11017 5000 | ||||||||||
| 1977–78 | HWS | Max Mean Min | 18500 15640 12700 | 16800 12834 7500 | 8000 2348 500 | 550 530 510 | 520 510 500 | 1100 1075 1050 | 1070 1035 1000 | 1000 | 1080 | 1000 | 5000 | 5800 5700 5500 |
| LWS | Max Mean Min | 18500 13860 12600 | 16700 12378 7000 | 8000 2498 500 | 560 530 500 | 560 540 520 | 1050 1025 1000 | 1000 1000 1000 | 1300 | 1300 | 1450 | 5000 | 5600 5425 5300 | |
| 1978–79 | HWS | Max Mean Min | 14200 14300 13000 | 18000 14750 7000 | 6800 | 7250 | 7000 | 2200 | 8000 5867 3600 | |||||
| LWS | Max Mean Min | 14000 12750 11000 | 17000 16000 15000 | 5200 | 7250 | 8000 | 2200 | 4200 3850 3500 | ||||||
| 1979–80 | HWS | Max Mean Min | 4400 3525 3000 | 8000 7500 7000 | 7500 | 2450 2375 2300 | 2000 | 6500 | 9500 9125 8500 | |||||
| LWS | Max Mean Min | 4000 3725 3400 | 8000 7250 7000 | 8000 | 2250 2155 2060 | 2000 | 6500 | 9500 8750 7500 |
Table - XX SALINITY DATA (E.C.) M/Mhos.
| River : Nilaki | Station : Khepupara. |
| Year. | Stage | Item | Apr. | May. | Jun | Jly | Aug | Sept | Oct | Nov | Dec | Jan | Feb | Mar |
| 1976–77 | HWS | Max Mean Min | 9000 7317 3950 | 7500 6515 2400 | 11500 9026 6000 | 14500 11439 9500 | 22000 16484 7600 | |||||||
| LWS | Max Mean Min | 8500 4611 2500 | 7500 4383 2500 | 9500 5426 3400 | 8200 6522 4500 | 20500 12492 8500 | ||||||||
| 1977–78 | HWS | Max Mean Min | 26000 17203 8000 | 13000 5650 2100 | 7500 2659 390 | 26000 17083 8500 | ||||||||
| LWS | Max Mean Min | 19000 16157 5750 | 6500 4004 1300 | 7800 2313 390 | ||||||||||
| 1978–79 | HWS | Max Mean Min | 29000 21793 14200 | 15400 13480 10500 | 13500 8250 4000 | 25000 18219 8000 | ||||||||
| LWS | Max Mean Min | 10500 8500 8000 | 7000 5200 2300 | |||||||||||
| 1979–80 | HWS | Max Mean Min | 22000 17553 9900 | 20400 19400 18200 | 17000 13226 10000 | |||||||||
| LWS | Max Mean Min |
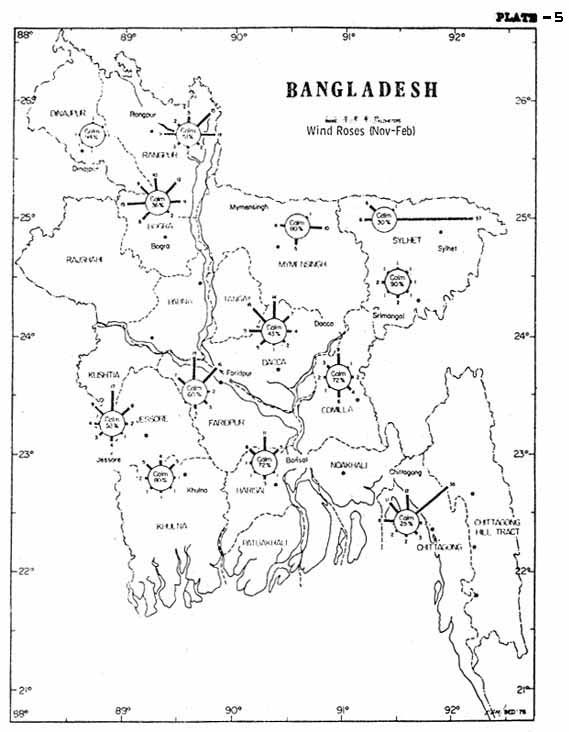
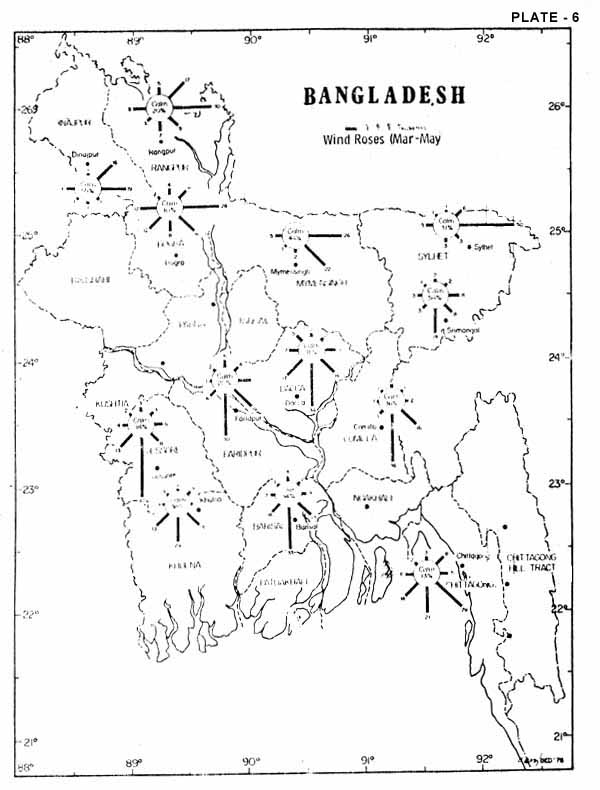
Only a few stations in Bangladesh have wind records. Wind data may conveniently be presented as wind roses. Plate 5–7 shows wind roses in Bangladesh for the period November to February, March to May and June to October.
Monthly average wind speeds for Khulna, Barisal, Chittagong and Cox's Bazar are shown in Tables I to III.
Wind field in the November to February period
Chittagong has 25% calm. period which means very windy weather. The prevailling wind direction is north-east. A little bit inside the country at Barisal and Khulna 72% and 80% are calm period showing very much less wind movement.
Wind field in the March to May period
Khulna has 35% calm (quite windy) and Barisal has 34%. The coastal areas of Chittagong have 15% calm (very windy due to exponsure) with south east winds blowing almost parallel to the coast line.
Wind field in the June to October period
This is the monsoon period in Bangladesh. The windiest region is Chittagong with 15% calm and prevailing wind parallel to the shore line. It is a south east wind with some southerlies. The wind field appears to be the same as that of the previous period.
When wind begins to flow over a smooth surface small waves are caused by the tangential forces between the wind and water. The waves increase in size as a result of the tangential force and also due to push of the wind against the back of the waves. As the waves grow in size, their speed also increases until they move with the same speed as the wind. Since wind force acting on the waves are a function of the difference between wind speed and wave speed, further growth ceases when the speeds become equal. Duration of wind may be an important factor in the ultimate height of the waves unless the wave passes out of the region of high wind or strikes a shore line before it attains maximum growth. The growth of wind waves can be calculated by aerodynamic principles if the wave shape is assumed and viscosity is neglected.
Wave height data gathered at major reseruoir confirm the theoritical and experimental data for Ocean waves if a modified value of fetch is used. The derived equation is Zw = 0.034 Vw 1.06F0.47 (i) Where Zw is the average height (inft.) of the highest one-third of the waves and is called the significant wave hight. Vw is the wind valocity (in m/h) about 25 ft. above the water surface, and F is the fetch in miles.
The design of embankment will have to take into account the wind generated waves. If the embankment has to be designed against cyclone, the probable cyclonic wind has to be considered in the above formula.
The prevailing wind and its direction may be considered for estimating wind waves within the pond.
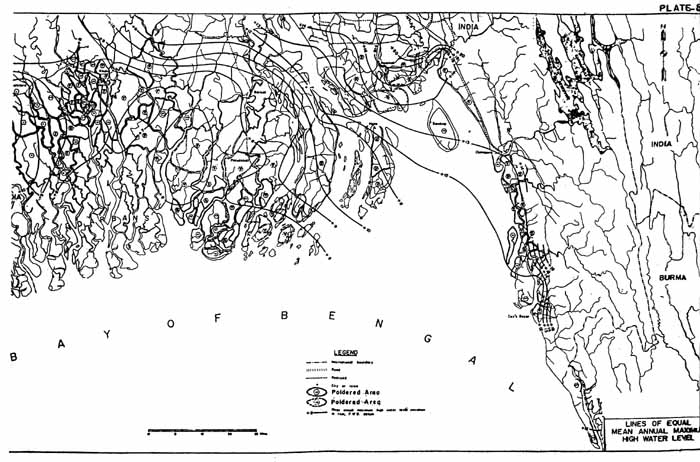
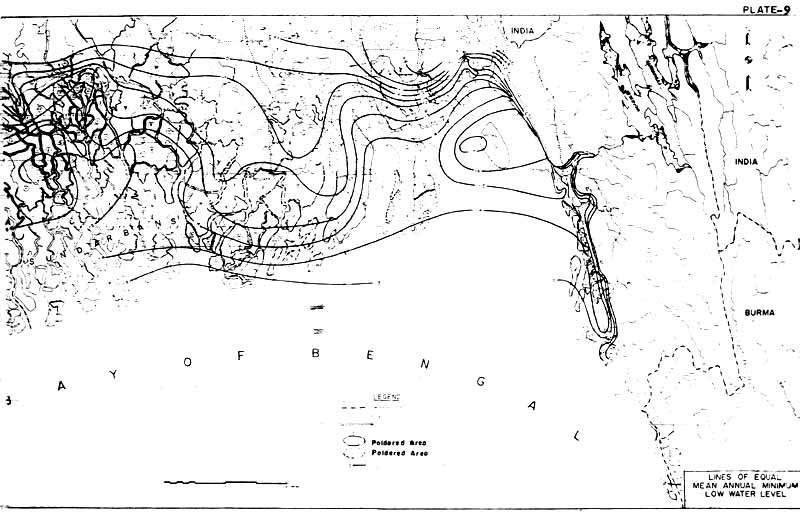
The tide along Bangladesh coast originates from the Indian Ocean. It travels through the deap Bay of Bengal and arrives at Hiron point and Cox's Bazar at about the same time. These two points being practically at the heads of submarine canyons i.e. swatch of no ground and Burma trench.
The tide in the Bangladesh coast is semi-diurnal with slight diurnal inequality. In the extensive shallow areas in the north-eastern corner of the bay, the tidal range increases due to partial reflection. The rising limb of the tide curve become steeper and under some circumstances moving hydraulic jumps locally known as tidal bore may occur. As the tidal wave travels along inland rivers, the frictional forces causes gradual decay in the tide. This process is further accelerated by the upland flow. The horizontal tide i.e. reversal of flow direction due to tide is felt in the low water season as far up as Bardia on the Gorai, the confluence of lower Kumar with the Arial Khan, Lohajang on the Padma etc. the back water effect of this tide is felt further up stream.
The tide from the deeper part of the Bay of Bengal enter into the continental shelf through the two submarine canyons. The ranges of the tides at the tip of these two canyons i.e. Hiron point and Cox's Bazar being about, 10 feet during the spring tides of the equinoxes.
In the Passur, Bhairab and the Baleswar-Kocha rivers funelling effect upstream of Khulna and Kaukhali respectively causes the strong tides in the vicinity of those places. In the Passur it even results in the greatest range in the upper reach inspite of attenuation due to friction. The back water effect of tide on the upland flow is felt even at the maximum flood upto Chandpur on the Meghna and Bardia on the Bhairab-Nabaganga.
Quick discharges of flood water in the Bay of Bengal is retarded by this tidal back water effect.
Plate 8 & 9 shows variation of mean annual high and low tide in the Bangladesh Coast.
Water Level Hydrographs
In order to asses the fluctuation of tide level round the year, the daily high and low tide has been plotted for the following stations.
Cox's Bazar, Patenga and Khulna for the period from April 1981 - March 1982.
Chiringa, Dhumghat, Kaikhali, Satkhira and Mongla for the period from April 1982 - March 1983.
Khepupara for the period from April 1980 - March 1981.
It has to be understood that the actual course of water level changes are within this two envelopes. The effect of spring tide (higher high water and lower low water) and effect of neap tide (Lower high water and higher low water are also visible in the presented graphs.
Examination of hydrograph of Cox's Bazar and Khepupara will show a general rise of sea level by about 2 to 3 ft. during the monsoon.
High and Low tides of different frequencies
High and Low tides of 50% and 80% probabilities one shown in the tables XXI - XXIV, tabulated. These levels when considered with topography within the ponded areas will show the possibilities of water exchange with tides.
Seasonal Variation of Tide
Seasonal variation in high tide and Tidal range (Table-XXIVA) accounts for available heads for drainage or for flushing certain area by tide. High tide increases from January attains highest value during July to September and then Starts falling. Tidal range however is high during lean season i.e. January to June and is comparatively low during July to September.
Comparison of Salinity data however shows the salinity starts increasing from January attains higher value during April-May and then starts receding.
TABLE - XXI
STATION: COX'S BAZAR
WATER LEVEL AT DIFFERENT PROBABILITY
( IN METRE)
Probability of excedence
| MONTH | HIGH WATER LEVEL | LOW WATER LEVEL | ||||
| 50 % | 80 % | 90 % | 50 % | 80 % | 90 % | |
| JAN | 2.20 | 2.01 | 1.92 | -0.62 | -0.86 | -1.00 |
| FEB | 2.48 | 2.30 | 2.10 | -0.72 | -0.89 | -0.99 |
| MAR | 2.50 | 2.45 | 2.38 | -0.72 | -0.95 | -1.06 |
| APR | 2.90 | 2.82 | 2.78 | -0.70 | -0.93 | -0.95 |
| MAY | 2.91 | 2.88 | 2.86 | -0.58 | -0.72 | -0.75 |
| JUN | 3.15 | 3.01 | 2.95 | -0.20 | -0.34 | -0.42 |
| JUL | 3.17 | 3.10 | 3.04 | -0.08 | -0.17 | -0.23 |
| AUG | 3.20 | 3.08 | 3.03 | 0.05 | -0.08 | -0.15 |
| SEP | 2.95 | 2.85 | 2.80 | -0.08 | -0.18 | -0.23 |
| OCT | 2.88 | 2.66 | 2.55 | -0.16 | -0.25 | -0.30 |
| NOV | 2.55 | 2.42 | 2.35 | -0.22 | -0.35 | -0.42 |
| DEC | 2.30 | 2.20 | 2.14 | -0.35 | -0.47 | -0.52 |
| ANNUAL | 3.30 | 3.18 | 3.04 | -0.72 | -0.90 | -1.04 |
TABLE - XXII
| RIVER | : | MATAMUHURI | |
| STATION | : | CHIRINGA |
WATER LEVEL AT DIFFERENT PROBABILITY (IN METRE)
(Probability of Excedence)
| MONTH | HIGH WATER LEVEL | LOW WATER LEVEL | ||||
| 50 % | 80 % | 90 % | 50 % | 80 % | 90 % | |
| JAN | 2.50 | 2.26 | 2.16 | 2.05 | 1.37 | 1.04 |
| FEB | 2.30 | 2.08 | 2.00 | 2.06 | 1.48 | 1.16 |
| MAR | 2.32 | 2.02 | 1.90 | 1.99 | 1.46 | 1.15 |
| APR | 2.46 | 2.08 | 1.94 | 1.91 | 1.52 | 1.22 |
| MAY | 3.31 | 2.73 | 2.65 | 1.93 | 1.45 | 1.20 |
| JUN | 5.75 | 4.20 | 3.23 | 2.10 | 1.64 | 1.46 |
| JUL | 5.25 | 4.52 | 4.15 | 2.78 | 2.08 | 1.58 |
| AUG | 4.88 | 4.44 | 4.21 | 2.85 | 2.42 | 2.16 |
| SEP | 4.27 | 3.24 | 2.70 | 2.65 | 2.21 | 1.92 |
| OCT | 4.21 | 3.28 | 2.81 | 2.42 | 2.01 | 1.62 |
| NOV | 2.86 | 2.29 | 2.00 | 2.18 | 1.88 | 1.72 |
| DEC | 2.54 | 2.01 | 1.64 | 2.15 | 1.37 | 1.11 |
| ANNUAL | 5.70 | 4.72 | 4.22 | 1.90 | 1.20 | 1.01 |
TABLE - XXIII
| RIVER | : | NILAKHI |
| STATION | : | KHEPUPARA |
WATER LEVEL AT DIFFERENT PROBABILITY (IN METRE)
Probability of excedence
| MONTH | HIGH WATER LEVEL | LOW WATER LEVEL | ||||
| 50 % | 80 % | 90 % | 50 % | 80 % | 90 % | |
| JAN | 1.21 | 0.92 | 0.76 | -1.47 | -1.54 | -1.58 |
| FEB | 1.17 | 1.08 | 1.06 | -1.52 | -1.58 | -1.62 |
| MAR | 1.50 | 1.28 | 1.16 | -1.55 | -1.59 | -1.62 |
| APR | 1.74 | 1.57 | 1.48 | -1.50 | -1.60 | -1.66 |
| MAY | 1.84 | 1.75 | 1.71 | -1.27 | -1.57 | -1.73 |
| JUNE | 2.02 | 1.95 | 1.90 | -1.20 | -1.29 | -1.34 |
| JUL | 2.10 | 2.05 | 2.02 | -1.17 | -1.37 | -1.42 |
| AUG | 2.08 | 1.98 | 1.92 | -1.20 | -1.37 | -1.55 |
| SEP | 2.02 | 1.97 | 1.86 | -1.21 | -1.32 | -1.43 |
| OCT | 1.97 | 1.77 | 1.68 | -1.32 | -1.38 | -1.42 |
| NOV | 1.64 | 1.37 | 1.21 | -1.29 | -1.52 | -1.63 |
| DEC | 1.44 | 1.05 | 0.84 | -1.30 | -1.57 | -1.80 |
| ANNUAL | 2.10 | 2.05 | 2.01 | -1.54 | -1.66 | -1.70 |
TABLE - XXIV
| RIVER | : | SATKHIRA KHAL |
| STATION | : | SATKHIRA |
WATER LEVEL AT DIFFERENT PROBABILITY ( IN METRE)
Probability of excedence
| MONTH | HIGH WATER LEVEL | LOW WATER LEVEL | ||||
| 50 % | 80 % | 90 % | 50 % | 80 % | 90 % | |
| JAN | 2.34 | 2.07 | 1.95 | 0.54 | 0.35 | 0.26 |
| FEB | 2.63 | 2.12 | 1.89 | 0.41 | 0.24 | 0.15 |
| MAR | 2.49 | 2.32 | 2.24 | 0.53 | 0.28 | 0.21 |
| APR | 2.54 | 2.37 | 2.28 | 0.62 | 0.47 | 0.37 |
| MAY | 2.61 | 2.41 | 2.31 | 0.80 | 0.61 | 0.51 |
| JUN | 2.68 | 2.47 | 2.36 | 0.87 | 0.75 | 0.67 |
| JUL | 2.95 | 2.77 | 2.65 | 0.93 | 0.80 | 0.74 |
| AUG | 2.90 | 2.82 | 2.78 | 1.07 | 0.88 | 0.75 |
| SEP | 2.94 | 2.75 | 2.64 | 1.04 | 0.86 | 0.76 |
| OCT | 2.77 | 2.68 | 2.56 | 0.98 | 0.77 | 0.66 |
| NOV | 2.58 | 2.35 | 2.23 | 0.82 | 0.67 | 0.59 |
| DEC | 2.42 | 2.22 | 2.11 | 0.66 | 0.52 | 0.47 |
| ANNUAL | 2.95 | 2.84 | 2.81 | 0.38 | 0.26 | 0.16 |
TABLE - XXIVA
SEASONAL MEAN TIDE AND RANGE ( IN METRE)
| Name of Station | JAN - MAR | APR - JUN | JUL-SEP | OCT - DEC | |
| 1. Mongla | H. Tide | 1.15 | 1.66 | 1.72 | 1.41 |
| Range | 2.34 | 2.35 | 1.94 | 2.19 | |
| 2. Khepupara | H. Tide | 0.77 | 1.42 | 1.52 | 1.16 |
| Range | 1.92 | 2.39 | 2.26 | 1.67 | |
| 3. Cox's Bazar | H. Tide | 1.82 | 2.34 | 2.52 | 2.03 |
| Range | 2.34 | 2.26 | 2.12 | 2.02 | |
| 4. Saflapur | H. Tide | 2.33 | 3.04 | 3.15 | 2.74 |
| Range | 2.51 | 2.76 | 2.82 | 2.49 | |
| 5. CHAPRA | H. TIDE | 2.16 | 2.68 | 2.72 | 2.42 |
| RANGE | 3.24 | 3.43 | 3.48 | 3.19 |
Fig : 1–2 shows plotting of pond and outside salinity with time. The salinity values are averages during spring and neap tide over periods of 3 to 7 days. On the same fig 1–2 rainfall of the nearest station for the same number of days for which salinity data has been collected (Table-XXV) have also been plotted. As is observed in fig 1–2 although salinity was continuously falling there had been no rainfall during corresponding period of June and July. There was however rainfall during these two months on days other then salinity observation days. Rainfall during June and July was 139 mm & 124 mm at Satkhira. Temperature and salinity data for Kaliganj, Chiringa and Khepupara are also presented in fig 3 to fig 5.
It is therefore concluded that salinity does not respond immediately with the rainfall of the same day/days. However cumulative rainfall has a definite effect on salinity. The same conclusion holds good both for Satkhira and Chiringa sites. The variation of Pond and outside salinity is not very significant and difference possibly decreases with the higher rate of water exchange.
Co-relation of Salinity with flow
In khulna area there is no significant upland fresh water flow. This is because only Goria receives fresh water flow from the Ganges and distributes the same through passur and Madhumati system. During monsoon there is a general exchange of fresh water from Madhumati system and streams to the east towards the net-work of rivers to the west of Gorai-Madhumati system. This along with monsoon rainfall causes seasonal decreases of salinity in Satkhira area.
Chakaria forest area in Chittagong is situated on the outfall of Matamuhuri river. It is therefore expected that salinity in the experimental pond in these area will strongly respond with the flow of Matamuhuri river. Table-XXVI shows the mean daily discharge of the Matamuhuri river at Lama.
Average flow during the salinity observation period has been computed and tabulated in Table-XXVII-XXX. The data has been plotted in fig. 6–9 for pond salinity and as well as outside salinity against these average flow. Salinity seems to be fairly strongly Co-related with the flow of Lama. This means, for a given flow of Matamuhuri river average and over a period of 3 to 7 days, expected salinity can be read from the Co-relation graphs. As has been mentioned earlier salinity within the pond and outside is not significantly different due to high rate of water exchange. In Chiringa area it might be possible to maintain a comparatively higher salinity in the pond if water exchange is decreased during the passage of flood flow. Annexure-A presents the tabulated data and charts on hydrology.
TABLE - XXV
SALINITY(%) AND RAINFALL (mm) DATA AT DIFFERENT STATION
| MONTH | DATE | CHAKARIA | KHEPUPARA | SATKHIRA | KALIGANJ | ||||
| Salinity | Rainfall | Salinity | Rainfall | Salinity | Rainfal | Salinity | Rainfall | ||
| APR (1982) | |||||||||
| 22 – 24 | 32.458 | 0 | 0 | 0 | 30.0 | ||||
| MAY | 08 – 11 | 30.784 | 0 | 0 | 0 | 0 | |||
| 24 – 28 | 29.716 | 14.0 | 0 | 0 | 0 | ||||
| JUN | 06 – 10 | 30.719 | 18.0 | 20.8 | 19.885 | 1.3 | 21.328 | 0 | |
| 22 – 24 | 4.678 | 30.8 | 63.4 | 14.28 | 5.1 | 21.446 | 27.9 | ||
| JUL | 05 – 11 | 7.391 | 32.8 | 316.1 | 16.59 | 0 | 22.05 | 0 | |
| 19 – 26 | 12.464 | 326.1 | 292.9 | 16.36 | 35.6 | 23.785 | 94.9 | ||
| AUG | 06 – 09 | 0.727 | 304.1 | 2.423 | 217.0 | 8.75 | 49.5 | 3.0 | 23.4 |
| 19 – 21 | 3.121 | 35.1 | 13.5 | 5.0 | 50.8 | 9.5 | 16.5 | ||
| SEP | 04 – 07 | 1.908 | 33.8 | 0.54 | 7.62 | 5.0 | 39.4 | 6.75 | 80.8 |
| 17 – 24 | 2.134 | 118.2 | 0 | 3.5 | 0 | 3.0 | 14.0 | ||
| OCT | 03 – 06 | 2.354 | 3.0 | 0 | 4.25 | 5.3 | 4.15 | 0 | |
| 16 – 18 | 10.875 | 0 | 4.385 | 0 | 5.24 | 0 | 5.625 | 0 | |
| NOV | 31/10-3/11 | 18.988 | 0 | 7.724 | 0 | 6.75 | 0 | 7.0 | 0 |
| 15 – 17 | 20.723 | 0 | 0 | 6.5 | 0 | 9.25 | 0 | ||
| DEC | 29/11-3/12 | 22.751 | 0 | 5.984 | 0 | 6.75 | 0 | 9.5 | 0 |
| 13 – 17 | 24.575 | 0 | 0 | 7.75 | 0 | 9.0 | 0 | ||
| JAN (1983) | 29/12–31/12 | 26.625 | 0 | 11.45 | 0 | 8.75 | 0 | 9.75 | 0 |
| 15 – 17 | 30.0 | 0 | 0 | 10.5 | 0 | 11.25 | 0 | ||
| FEB | 29/1-1/2 | 31.5 | 0 | 11.724 | 0 | 11.5 | 0 | 12.0 | 24.1 |
| 14 – 16 | 32.313 | 0 | 0 | 13.0 | 0 | 14.0 | 0 | ||
| MAR | 27/2-2/3 | 33.563 | 15.0 | 11.108 | 0 | 13.5 | 0 | 14.75 | 0 |
| 13 – 18 | 31.688 | 0 | 12.7 | 15.75 | 0 | 16.0 | 0 | ||
| APR | 27/3-1/4 | 25.875 | 0 | 16.995 | 0 | 17.125 | 0 | 18.0 | 0 |
| 13 – 17 | 22.813 | 23.6 | 0 | 16.875 | 68.1 | 19.0 | 0 | ||
| 26 – 30 | 20.25 | 0 | 18.715 | 0 | 20.0 | 0 | 21.125 | 4.6 | |
| MAY | 13 – 16 | 18.688 | 0 | 0 | 19.0 | 57.7 | 20.25 | 53.4 | |
| 25 – 30 | 15.75 | 45.5 | 11.869 | 0 | 19.5 | 5.1 | 21.0 | 0 | |
| JUN | 12 – 14 | 18.375 | 61.5 | 12.7 | 18.0 | 0 | 21.063 | 33.0 | |
| 25 – 28 | 5.05 | 117.0 | 3.188 | 93.5 | 20.0 | 111.8 | 23.5 | ||
| JUL | 10 – 14 | 4.063 | 5.8 | 0 | 14.0 | 10.9 | 18.0 | ||
| 25 – 29 | 0.507 | 161.8 | 0.75 | 60.4 | 12.75 | 58.9 | 16.0 | ||
| AUG | 09 – 14 | 0.514 | 45.7 | 8.13 | 10.0 | 71.2 | 13.0 | ||
| 23.24 | 0.313 | 21.9 | 3.547 | 11.9 | 7.375 | 18.3 | 10.0 | ||
TABLE - XXVI
Mean Daily Discharge of Lama
| Station: 203 Lama | River : 78 Matamuhuri | Year: 1982–83 | ||||||||||
| Date | APR | MAY | JUN | JUL | AUG | SEP | OCT | NOV | DEC | JAN | FEB | MAR |
| 1 | 4.12 | 4.82 | 8.05 | 175 | 435 | 163 | 196 | 15.7 | 12.6 | 10.3 | 7.14 | 7.11 |
| 2 | 4.11 | 4.45 | 7.50 | 123 | 955 | 195 | 135 | 14.6 | 12.6 | 10.3 | 7.12 | 6.69 |
| 3 | 4.09 | 4.28 | 8.44 | 360 | 754 | 232 | 141 | 14.6 | 12.5 | 10.3 | 7.03 | 6.52 |
| 4 | 4.08 | 4.27 | 7.81 | 144 | 646 | 188 | 122 | 14.4 | 12.4 | 10.3 | 6.91 | 6.57 |
| 5 | 4.06 | 4.27 | 7.64 | 58.7 | 671 | 107 | 99.5 | 14.1 | 12.4 | 10.3 | 6.68 | 6.43 |
| 6 | 4.05 | 4.27 | 7.71 | 29.5 | 554 | 416 | 79.7 | 13.0 | 12.3 | 10.3 | 6.45 | 6.50 |
| 7 | 4.03 | 4.27 | 9.26 | 65.0 | 1020 | 130 | 75.5 | 12.3 | 12.1 | 10.3 | 6.34 | 6.58 |
| 8 | 4.02 | 4.27 | 11.7 | 28.8 | 758 | 102 | 61.2 | 11.6 | 12.0 | 10.3 | 6.23 | 6.53 |
| 9 | 4.00 | 4.10 | 8.71 | 24.3 | 830 | 323 | 54.5 | 11.5 | 11.8 | 9.98 | 6.12 | 6.49 |
| 10 | 3.99 | 4.10 | 13.8 | 22.2 | 482 | 139 | 49.1 | 11.3 | 11.7 | 9.82 | 5.91 | 6.56 |
| 11 | 3.97 | 4.16 | 21.8 | 45.8 | 230 | 102 | 46.0 | 11.1 | 11.7 | 9.82 | 5.81 | 6.61 |
| 12 | 3.64 | 3.43 | 32.8 | 28.7 | 170 | 88.6 | 41.5 | 13.7 | 11.4 | 9.67 | 5.60 | 6.56 |
| 13 | 3.64 | 3.49 | 47.8 | 27.6 | 99.8 | 65.0 | 38.3 | 21.6 | 11.0 | 9.67 | 5.50 | 6.55 |
| 14 | 3.64 | 3.55 | 45.7 | 31.2 | 16.7 | 125 | 35.9 | 17.0 | 10.8 | 9.68 | 5.30 | 6.62 |
| 15 | 3.64 | 3.60 | 22.1 | 43.7 | 48.2 | 461 | 35.3 | 16.8 | 10.5 | 9.53 | 5.21 | 6.70 |
| 16 | 3.64 | 3.89 | 14.1 | 87.2 | 28.4 | 560 | 34.0 | 16.7 | 10.5 | 9.38 | 5.02 | 7.03 |
| 17 | 3.64 | 4.52 | 47.4 | 212 | 22.8 | 190 | 32.3 | 16.4 | 10.5 | 9.24 | 4.93 | 48.5 |
| 18 | 3.64 | 3.94 | 107 | 92.8 | 11.0 | 128 | 32.5 | 16.1 | 10.5 | 8.94 | 4.99 | 23.6 |
| 19 | 11.1 | 4.48 | 600 | 51.6 | 10.4 | 12 | 28.4 | 16.0 | 10.3 | 8.80 | 5.80 | 11.0 |
| 20 | 5.60 | 5.61 | 519 | 44.2 | 7.80 | 164 | 26.5 | 15.2 | 10.3 | 8.52 | 5.74 | 28.4 |
| 21 | 5.03 | 4.12 | 261 | 42.2 | 36.1 | 131 | 24.5 | 14.6 | 10.2 | 8.38 | 5.80 | 13.5 |
| 22 | 3.95 | 4.02 | 124 | 61.4 | 27.1 | 103 | 24.5 | 14.4 | 10.2 | 8.25 | 8.72 | 12.5 |
| 23 | 3.95 | 3.92 | 89.5 | 163 | 615 | 67.8 | 24.2 | 14.4 | 10.2 | 8.12 | 13.9 | 12.7 |
| 24 | 3.95 | 3.66 | 215 | 159 | 905 | 50.7 | 26.0 | 14.2 | 10.2 | 7.99 | 8.40 | 10.8 |
| 25 | 4.83 | 6.39 | 325 | 211 | 606 | 62.6 | 23.0 | 13.8 | 10.2 | 7.86 | 8.09 | 9.33 |
| 26 | 29.9 | 7.65 | 328 | 1390 | 421 | 46.6 | 20.7 | 13.7 | 10.2 | 7.73 | 8.21 | 8.71 |
| 27 | 36.7 | 5.32 | 318 | 584 | 416 | 61.2 | 19.1 | 13.5 | 10.2 | 7.61 | 7.00 | 8.24 |
| 28 | 12.9 | 5.65 | 254 | 339 | 301 | 52.8 | 18.6 | 13.2 | 10.2 | 7.49 | 7.03 | 8.38 |
| 29 | 9.94 | 7.96 | 183 | 332 | 315 | 514 | 17.8 | 12.9 | 10.2 | 7.36 | -- | 8.53 |
| 30 | 7.03 | 9.13 | 171 | 832 | 298 | 382 | 16.8 | 12.7 | 10.2 | 7.22 | -- | 8.52 |
| 31 | -- | 9.40 | -- | 551 | 219 | -- | 16.5 | -- | 10.3 | 7.39 | -- | 8.67 |
| Ten Daily Averages | ||||||||||||
| AV1 | 4.06 | 4.31 | 9.06 | 103 | 711 | 170 | 101 | 13.3 | 12.2 | 10.2 | 6.59 | 6.60 |
| AV2 | 4.62 | 4.07 | 146 | 66.5 | 64.4 | 200 | 35.1 | 16.1 | 10.8 | 9.33 | 5.39 | 15.2 |
| AV3 | 11.8 | 6.11 | 227 | 424 | 378 | 147 | 21.0 | 13.7 | 10.2 | 7.76 | 8.39 | 9.99 |
| Monthly Means & Extremes | ||||||||||||
| MAX | 36.7 | 9.40 | 600 | 1390 | 1020 | 560 | 196 | 21.6 | 12.6 | 10.3 | 13.9 | 48.5 |
| MEAN | 6.83 | 4.87 | 127 | 205 | 384 | 172 | 51.5 | 14.4 | 11.0 | 9.06 | 6.68 | 10.6 |
| MIN | 3.64 | 3.43 | 7.50 | 22.2 | 7.09 | 46.6 | 16.5 | 11.1 | 10.2 | 7.22 | 4.93 | 6.43 |
| Annual Max. = 1390 Annual Min. = 3.43 | ||||||||||||
TABLE - XXVII
| MONTH | DATE | AV. SALINITY C-1 | AV. DISC. MATAMUHURI AT LAMA. |
| APR '82 | 22 – 24 | 33.002 | 3.95 |
| MAY | 08 – 11 | 31.155 | 4.16 |
| 24 – 28 | 28.855 | 5.73 | |
| JUN | 06 – 10 | 31.312 | 10.2 |
| 22 – 24 | 4.495 | 141 | |
| JUL | 05 – 11 | 8.885 | 39.0 |
| 19 – 26 | 12.397 | 265 | |
| AUG | 06 – 09 | 0.682 | 916 |
| 19 – 21 | 2.920 | 17.9 | |
| SEP | 04 – 07 | 1.930 | 135 |
| 17 – 24 | 2.080 | 118 | |
| OCT | 03 – 06 | 2.200 | 110 |
| 16 – 18 | 10.625 | 33.0 | |
| NOV | 31.10-3.11 | 18.0 | 15.4 |
| 15 – 17 | 20.475 | 16.6 | |
| DEC | 29.11-3.12 | 22.231 | 12.7 |
| 13 – 17 | 23.40 | 10.7 | |
| JAN '83 | 29.12–31.11 | 25.74 | 10.2 |
| 15 – 17 | 30.125 | 9.4 | |
| FEB | 29.1–31.1 & 1.2 | 31.125 | 7.28 |
| 14 – 16 | 32.625 | 5.17 | |
| MAR | 27.2-2.3 | 32.875 | 6.95 |
| 13 – 18 | 31.50 | 16.5 |
TABLE - XXVIII
| MONTH | DATE | AV. SALINITY C-2 | MEAN DISCHARGE IN M3 MATAMUHURI AT LAMA |
| APR '82 | 22 – 24 | 31.895 | 3.95 |
| MAY | 08 – 11 | 30.412 | 4.16 |
| 24 – 28 | 30.577 | 5.73 | |
| JUN | 06 – 10 | 30.125 | 10.2 |
| 22 – 24 | 4.86 | 141 | |
| JUL | 05 – 11 | 5.897 | 39.0 |
| 19 – 26 | 12.53 | 265 | |
| AUG | 06 – 09 | 0.772 | 916 |
| 19 – 21 | 3.322 | 17.9 | |
| SEP | 04 – 07 | 1.885 | 135 |
| 17 – 24 | 2.187 | 118 | |
| OCT | 03 – 06 | 2.507 | 110 |
| 16 – 18 | 11.125 | 33.0 | |
| NOV | 31/10 - 3/11 | 19.975 | 15.4 |
| 15 – 17 | 20.97 | 16.6 | |
| DEC | 29/11 - 3/12 | 23.27 | 12.7 |
| 13 – 17 | 25.75 | 10.7 | |
| JAN '83 | 29/12 – 31/12 | 27.5 | 10.2 |
| 15 – 17 | 29.875 | 9.4 | |
| FEB | 29/1 – 1/2 | 31.875 | 7.28 |
| 14 – 16 | 32.0 | 5.17 | |
| MAR | 27/2-2/3 | 34.25 | 6.95 |
| 13 – 18 | 31.875 | 16.5 |
TABLE - XXIX
| MONTH | DATE | AV. SALINITY CP - 1 | MEAN DISCHARGE IN M3 MATAMUHURI AT LAMA |
| APR '82 | 22 – 24 | 36.4 | 3.95 |
| MAY | 08 – 11 | 33.105 | 4.16 |
| 24 – 28 | 34.505 | 5.73 | |
| JUN | 06 – 10 | 35.417 | 10.2 |
| 22 – 24 | 9.837 | 141 | |
| JUL | 05 – 11 | 10.59 | 39.0 |
| 19 – 26 | 13.746 | 265 | |
| AUG | 06 – 09 | 0.75 | 916 |
| 19 – 21 | 2.56 | 17.9 | |
| SEP | 04 – 07 | 1.99 | 135 |
| 17 – 24 | 1.84 | 118 | |
| OCT | 03 – 06 | 1.99 | 110 |
| 16 – 18 | 7.0 | 33.0 | |
| NOV | 31/10 - 3/11 | 16.6 | 15.4 |
| 15 – 17 | 9.51 | 16.6 | |
| DEC | 29/11 - 3/12 | 16.76 | 12.7 |
| 13 – 17 | 22.0 | 10.7 | |
| JAN '83 | 29/12–31/12 | 24.0 | 10.2 |
| 15 – 17 | 29.67 | 9.4 | |
| FEB | 29/1 – 1/2 | 31.667 | 7.28 |
| 14 – 16 | 39.166 | 5.17 | |
| MAR | 27/2 - 2/3 | 37.667 | 6.95 |
| 13 – 18 | 33.833 | 16.5 |
TABLE - XXX
| MONTH | DATE | AV. SALINITY CP - 2 | MEAN DISCHARGE IN M3 MATAMUHURI AT LAMA |
| APR '82 | 22 – 24 | 35.675 | 3.95 |
| MAY | 08 – 11 | 33.24 | 4.16 |
| 24 – 28 | 32.745 | 5.73 | |
| JUN | 06 – 10 | 33.3 | 10.2 |
| 22 – 24 | 12.67 | 141 | |
| JUL | 05 – 11 | 10.867 | 39.0 |
| 19 – 26 | 11.673 | 265 | |
| AUG | 06 – 09 | 0.99 | 916 |
| 19 – 21 | 2.86 | 17.9 | |
| SEP | 04 – 07 | 2.11 | 135 |
| 17 – 24 | 2.02 | 118 | |
| OCT | 03 – 06 | 2.02 | 110 |
| 16 – 18 | 7.2 | 33.0 | |
| NOV | 30/11 - 3/11 | 14.667 | 15.4 |
| 15 – 17 | 9.84 | 16.6 | |
| DEC | 29/11 - 3/12 | 18.68 | 12.7 |
| 13 – 17 | |||
| JAN '83 | 29/12 – 31/12 | ||
| 15 – 17 | |||
| FEB | 29/1 – 1/2 | ||
| MAR | 27/2 - 2/3 | ||
| 13 – 18 |
FIG - 1
FIG. SHOWING MONTHLY FULL MOON (F) NEW MOON (N) FIUCTUATION OF SALINITY (‰) AND WATER TEMPERATURE (°c) IN STATION S-1 AND POND SP-1 AT SATKHIRA.
FIG - 2
FIG. SHOWING MONTHLY FULL MOON (F)-NEW MOON (N) FLUCTUATIONS OF WATER TEMPERATURE (°C) AND SALINITY (‰) IN STATION C-1 AND POND CP-1 AT CHITTAGONG.
FIG - 3
FIG. SHOWING MONTHLY FULLMOON (F) - NEWMOON (N) FLUCTUATIONS OF SALINITY (‰) AND WATER TEMPERATURE (°c) IN STATION S-2 AND POND SP-2 AT SATKHIRA.
FIG - 4
FIG. SHOWING MONTHLY FULL MOON (F)- NEW MOON (N) FLUCTUATIONS OF WATER TEMPERATURE (°C) AND SALINITY (‰)IN STATION C-2 AND POND CP-2 AT CHITTAGONG.
FIG - 5
FIG. SHOWING MONTHLY FLUCTUATIONS OF WATER TEMPERATURE (°C) AND SALINITY (‰) IN STATIONS K-1 & K-2 AT KHEPUPARA.
FIG - 6
FIG - 7
FIG - 8
FIG - 9
![]()
![]()
![]()