![]()
![]()
![]()
Observational systems of the terrestrial environment require both local observations, often measured in situ, and broader scale data frequently obtained by remote sensing. The success of this integrated system is highly dependent on the sampling strategies employed. Current ones are deficient in a number of respects and we outline in this section the principles for designing the sampling strategies for the global biosphere, hydrosphere, and cryosphere.
Successful execution of the GCOS and GTOS programmes requires that information about numerous variables be obtained for the global terrestrial environment and converted into homogeneous data sets. Such data sets are necessary to achieve the GCOS objectives such as climate change detection, assessment of seasonal and interannual variability, model validation; and the GTOS objective of detecting and assessing the impact of climate change on terrestrial ecosystems, among others. To obtain the data sets typically implies that each variable is measured at many locations around the world with the necessary temporal frequency, accuracy and consistency so that the global data sets can be generated from these measurements. Since most variables of interest vary both in time and in space, often quite rapidly, this poses a formidable challenge.
Criteria for the design of the GCOS/GTOS sampling scheme were adapted from those of the US Environmental Monitoring and Assessment Program (EMAP; Overton, et al., 1990). The criteria are:
Responsiveness - The design is responsive to the needs of users;
Adaptability - The design must accommodate changing perspectives, objectives, user needs and increased knowledge;
Flexibility - The protocols and design structures need to be flexible and capable of accommodating a wide variety of methods, and space/time resolutions; and be able to incorporate existing international monitoring programmes;
Simplicity - It must be understood by all and it must be implementable with varying degrees of sophistication;
Rigour - Quality assurance procedures need to be developed and approved by an international GCOS/GTOS methods working group.
The various climate objectives, including those relating to economic and sustainable development - regardless of whether they require observations of the hydrosphere, cryosphere or biosphere - imply different design criteria. Change detection is favoured by placing a sample in the path of probable change. Change quantification requires a systematic, representative and unbiased sampling strategy. Model development and future projections may require intensive data collection for relatively few sites which span the range of global conditions present, without necessarily being statistically representative. Model operation needs complete and coherent sets of variables. When the individual temporal and spatial characteristics of a large number of variables are added to these considerations, it is clear that the data gathering system needs to be flexible and multi-purpose, besides being cost-effective.
The fundamental constraint of global observing systems is that it is not practically feasible to make all the measurements all of the time everywhere. It is therefore necessary to design a sampling system which still retains adequate spatial and temporal resolution, but is affordable and practical. For example, one of the efficient sampling designs is stratified random sampling in which the distribution of samples is based on the distribution of the variance within the population of interest. The highly variable portions (or strata) of the population are then sampled more intensively than those with less variability (Figure 5.1).
Figure 5.1 - Diagrammatic
representation of the Global Hierarchical Observing Strategy
(GHOST).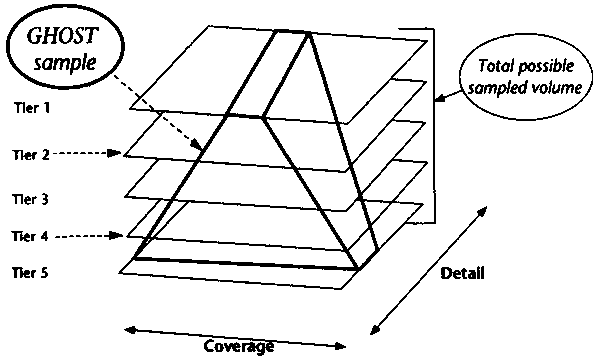
A hierarchical tier system in which at the one extreme a few variables are measured continuously in a large number of places, and at the other extreme a large number of variables are measured in a few locations, provides a practical compromise between the conflicting requirements for accuracy, representatives, and affordability. In principle, the tiers will be defined in relation to individual variables (Section 5.3). Since many variables of interest vary in similar manner so that their stratifications more or less coincide (e.g., biogeochemical variables in relation to biome distribution, hydrological variables based on catchments), it is possible to co-locate the measurements at research stations or observation sites. Examples of such existing sites are long-term ecological reserves, agricultural research stations, and experimental watersheds.
A variable of interest may often be measured in different ways. For example, soil organic matter content can be measured directly through chemical analysis, indirectly using spectrophotometry, or simply related to soil colour through the use of colour charts. The available procedures generally differ in accuracy, complexity, and costs. Various measurement techniques also provide results over different spatial domains. Thus direct, detailed measurements can be applied at only few locations because of logistics and costs. On the other hand, indirect methods such as satellite observations provide the means of covering the whole globe, with high or low spatial resolution that can be selected through sensor design and mission management. The hierarchical tier concept can readily accommodate these differences, thus affording optimized use of the available resources.
The hierarchy of terrestrial measurements required for a global observing system divides fairly naturally into five tiers, each with distinct characteristics and roles. They range from tier 1, where measurement techniques employed for the variable of interest are more complex and the measurements are made at few locations, to tier 5 with few variables measured at many locations using indirect methods, principally remote sensing (Figure 5.2). Specific sites can be assigned to tiers on the basis of the number of GCOS/GTOS variables measured at the same location, the accuracy/precision of the methods used to measure the variables, and the spatial frequency with which the variables are sampled. The tier concept is applicable to the three main areas of concern in the relationship land surface/climate change - the land surface, freshwater ecosystems and cryospheric surfaces - each of which may have their own hierarchy, culminating in a shared tier 5. The main characteristics of the tiers are given in Table 5.1.
Figure 5.2 - Tier structure of
sampling strategy.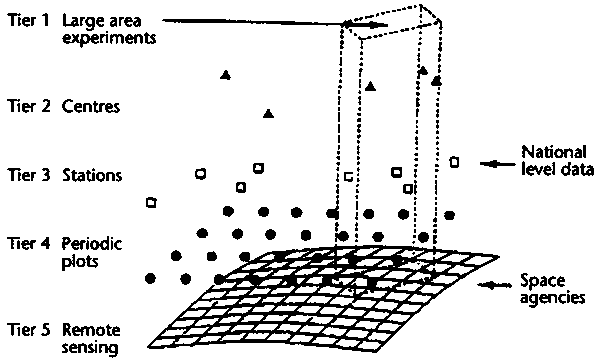
Space resolution, time resolution, and thematic detail are the main organizing principles of the tier hierarchy. The hierarchy is partially nested, in other words, only some of the locations at one tier are components of a location at the next lower tier. For example, research centres are not necessarily made up of research stations, stations by sites, and so on; but in most cases there are strong linkages between the tiers. Within the hierarchies for the land, freshwater and cryosphere, there is a balance between different types of systems: for instance between natural, agricultural and urban ecosystems on the land; between rivers, lakes, estuaries and groundwater in freshwater systems; and between ice sheets, ice caps and glaciers in the cryosphere. There is also a geographical balance: coarse representation at tiers 1 and 2, detailed representation at tier 3, unbiased sampling at tier 4, and complete coverage at tier 5.
An important feature of the hierarchy is its vertical and horizontal integration. Horizontal integration means that the data at one tier are sufficiently complete both spatially and thematically to make useful products at that level; they are mutually supporting within a conceptual model operating at that level. Vertical integration means that the tiers are not independent. Each major theme is covered at all tiers by interrelated and compatible variables, allowing the detail and mechanistic insight obtained at higher tiers to be spatially elaborated and validated at lower tiers. For example, global wall-to-wall land cover is mapped in broad classes using remote-sensing at tier 5; this is enriched with ground observations of vegetation cover and land use at tier 4; further enriched with temporal detail (the seasonal progression of intercepted radiation) at tier 3; supported with mechanisms at tier 2 (the landscape-scale dynamics of leaf area and architecture) and elaborated with spatial processes at tier 1 (for instance the 'green wave' which travels seasonally along a regional temperature/ moisture gradient). This integrative logic has been applied to all variables.
Tier 1 - The primary objective of tier 1 is to characterize climate and climate change-related processes in the terrestrial environment, at a range of spatial scales and for seasonal or shorter time scales; and to develop procedures and models for upscaling findings from local sites to the region and eventually the globe. Tier 1 involves intensive experimental studies over large areas or along transects crossing environmental gradients. Such studies focus on the development and validation of models that mimic the climate-terrestrial interactions and the response of the terrestrial environment to changing climate, including feedbacks. This requires a small number of regional scale, relatively short-term (5 years or so) studies, although measurements over extended periods are likely to continue at many of these sites. Facilities at this tier add measurements of processes generally not quantified at lower tiers (e.g., trace gas exchange), and they address mechanisms of spatial integration and scaling up of the various processes from local to regional and larger areas.
The proposed IGBP transects and the existing or proposed large-scale surface experiments (e.g., Hydrological Atmospheric Pilot Experiment (HAPEX-Sahel), and the Boreal Ecosystems Atmosphere Study (BOREAS)) already total the appropriate order of magnitude. The spatial scale for these sites should include a core area in the order of at least (10 km)2, and studied surroundings of 104 km2 or more. Although these studies are short term, it would be highly beneficial for the sites to continue long-term measurements beyond the experimental period. In most cases, this would imply a change from tier 1 to tier 2 or 3 for the long term. In any case, GCOS/GTOS need to ensure long-term availability of the data and models resulting from these experiments/sites.
Table 5.1 - Tier characteristics.
|
TIER |
ROLE |
CHARACTERISTICS |
INDICATIVE NUMBERS |
|
1. Large area experimentsa) e.g., IGBP, large catchment studies. |
Understanding of spatial structure and processes, interactions among processes and ecosystem components, detecting change in these at regional scale; study of scaling issues; and development of models describing these. |
Large-scale experiments. Intensive measurement of a large number of variables over a 'site' of several hundred square kilometres or a transect of several hundred kilometres long, over a limited period of time. Examples are the IGBP Megatransects, GEWEX large catchment studies, ISLSCP projects, etc. May later continue observations of selected variables (as tier 2 or 3 sites). |
10 |
|
2. Research centres e.g., LTERS, large agricultural research stations. |
Understanding processes within biomes, change detection, experimentation, method development, data synthesis. |
Research centres with a large staff (> 10 participating scientists) and sophisticated infrastructure (varies with the research focus but may include laboratories, data loggers for continuous measurement, flux towers and gauging weirs, etc.). They tend to focus on one biome type for unmanaged ecosystems (e.g. the US-LTERs) or one crop type in the case of agricultural centres (e.g. CIAT, IRRI). In principle, there should be one or ore sites per major crop type, biome type, aquatic system type and cryospheric type. |
100b) |
|
3. Stations e.g., Biosphere reserves, smaller national agricultural and ecosystem research sites, research catchments, small polar stations. |
Long-term measurement of variables which vary over periods from weeks to years; seasonal and interannual variations across the range of variability within each major ecosystem, crop system, aquatic system or cryospheric system; calibration and validation of remotely-sensed variables; trends of variables. |
Research stations with permanent presence on site. Many hydrological observation sites fall into this category, as do ecological field stations and many agricultural research stations. The observations do not require very expensive, sophisticated or continuous measurements. |
1 000b) |
|
4. Sample sites e.g., US EMAP program, UK country survey. |
Direct measurement and change detection of variables not observable by remote sensing; calibration and validation of remotely-sensed variables; status and trends of biome health; provide statistically valid spatial information for extrapolating findings from the other tiers. |
Sites which are revisited regularly but infrequently (once every 5-10 years). |
10 000b) |
|
5. Satellite remote sensing (e.g., AVHRR, SPOT, Landsat, Radarsat). |
Spatial and temporal interpolation as detailed as 1 day and 10-30 metres. Extent of biomes, ice sheets, etc., status and trends of a biome health. |
The principal feature is the reliance on remote sensing, which is usually quasi-continuous in both time and space, but can provide data for only some of the variables of interest. This tier also includes other measurement or mapping techniques which result in spatially extensive data sets (e.g., topographic, soil data sets); however, the vast majority of future data will be obtained through satellite remote sensing. |
Not applicable |
NOTES:
(a) May or may not include a tier 2 research centre or tier 3 station, very likely to include at least several tier 4 sites.
(b) Approximately in the ratios 30 natural ecosystems: 30 agroecosystems: 10 rivers: 10 lakes/estuaries: 10 cryosphere.
Tier 2 - The objective at this tier is to understand the processes and the way they respond to global change over a range of time scales. To enable studies of mechanisms, the sites may involve manipulative experiments in addition to monitoring. Tier 2 includes major research centres, usually with a biome, regional or crop focus. There will be at least one (preferably two or three) centres in each of the major biome types (about 20 in all) and a centre for each major crop and plantation forest type, for a global total in the order of 100. Sites at this tier will be well-equipped and staffed, and they may include subsidiary research stations or off-site experiments. Hallmark measurements added at this tier include diurnally resolved weather; soil moisture; isotopic studies of soil nitrogen and carbon; and continuous monitoring of fluxes of CO2, water, and energy. For larger countries, there will be one or a few sites per country. For smaller countries, tier 2 sites can serve as regional centres.
The Consultative Group on International Agricultural Research (CGIAR) crop centres would fit into this tier, as would some of the better-developed ecological research sites in the US, Europe, and China. Together, these already total well over 100 sites. Extrapolation of measured data are made via periodically-updated inventory information. Some centres may need to be promoted (or sustained) in the lesser-developed parts of the world.
Tier 3 - The primary objective at this tier is to provide dynamic data over time at the sub-annual temporal resolution (e.g., phenology, net primary production, snow water equivalent, glacier mass balance) as well as to provide spatial context. Tier 3 includes many of the existing national ecological and agricultural research stations, experimental watersheds and cryosphere research sites. They will comprise some 1 000 facilities, each covering areas of up to approximately 10 km2. This is also the tier of closest linkage to weather stations and for calibrating remote sensing-derived data products. Tier 3 sites will usually have small permanent staff and modest facilities (e.g., a weather station, balances, drying ovens, communications, data handling facilities). Because an approximate balance across biomes, agro-ecological regions and farming system types is a high priority, these sites will need to be selected with care. However, it is not necessary that all ecosystems be represented at this tier in proportion to their extent. It is estimated that 80% or more of these stations already exist. Where gaps occur, especially in the developing world, international efforts may be needed to establish new ones.
Tier 4 - The objective of this tier is to establish the representatives of the data obtained in tiers 1, 2 and 3, and in some cases also to provide additional ground data for satellite-based estimates. Tier 4 has the unique function of providing accurate and spatially-resolved data on variables which at present cannot be remotely-sensed. An example is the soil carbon content, which is important because it is the largest biospheric carbon pool, is subject to change, and influences other factors such as the soil water holding capacity. It cannot be observed from space. In addition, tier 4 sites can act as calibration and validation points for remotely-sensed variables; tiers 2-3 also provide these data, but may have insufficient sites to represent all the ecosystem classes. In this sense, tier 4 is intended to bridge the gap between satellite observations, which are quasi-continuous in space and time (tier 5), and the permanently-staffed but non-optimally distributed tier 3 ground stations. It is important to separate the unique roles of tier 4 from the additional roles, because they have different sampling requirements. Tier 4 points should be placed in a statistically unbiased manner.
Among all the tiers, tier 4 is the least established one as only a few countries have sampling programmes at this level. The implementation thus poses special challenges which are discussed later (Section 7.2).
Tier 5 - The objective of this tier is to allow extending the data and knowledge from tiers 1-4 to the large areas such as country, region, and the globe. Such extension is typically accomplished using tier 5 data sets in conjunction with data from higher tiers and models from tiers 1-3. Tier 5 must also provide data to detect and classify natural and human activities such as changes in albedo, snow cover, sea ice concentration, vegetation composition and structure, forest clearing, urbanization, and other types of land cover change. While remote sensing is the dominant measurement technique at tier 5, other tools (topographic surveying, field mapping of soils, etc.) can be important for specific data sets. In general, it is expected that the spatial resolution will be better (smaller areas) than 1 square kilometre globally, though for specialized observations, resolution will be provided for more local data sets at 30 metres or less.
The main source of data at this tier will be satellite-borne sensors and associated data processing facilities. The implementation of tier 5 thus relies on close collaboration with space agencies and is further considered in Section 7.2.
The proposed measurements are intended to capture the status and dynamics of terrestrial ecosystems essential for climate purposes. The proposed variables (Annex I) have been selected to be the minimum set needed to observe, understand and predict changes in critical life-supporting terrestrial processes involving climate. They are intended to be internally consistent and mutually supporting and enhancing. The measurements must be as globally applicable and standardisable as possible.
Figure 5.3 illustrates the characteristics of the tiers in relation to variables measured at these tiers. At tier 1 locations many variables are measured with precise, often expensive and time-consuming methods, and with a high temporal frequency. At the other extreme, relatively few variables are measured at tier 5 using remote sensing but with a high spatial frequency because of the ability to provide complete coverage of the area of interest. In general, the accuracy at tier 5 will not be as high as for other methods because of the necessary conversion of electromagnetic measurements into the variables of interest.
Figure 5.3 - Diagrammatic
representation of characteristics of variables at each tier.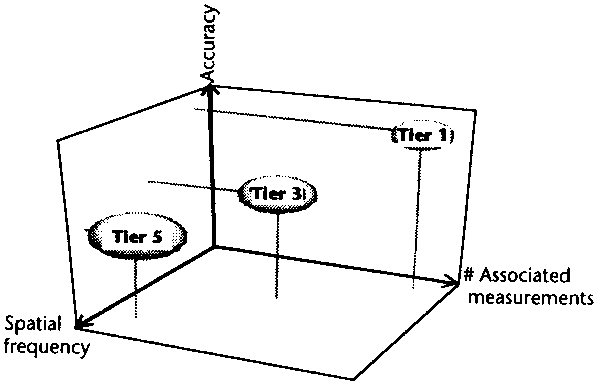
In addition to producing integrated information using data from the global observing systems, models will play a central role in filling the gaps in space and time unavoidably left by incomplete sampling. In general, tiers 1 and 2 yield models which are validated, run and interpolated using data from tiers 3, 4, and 5.
The variables measured at each tier are listed in Table 5.2. The requirements have been carefully analysed to ensure that a minimum set of the important variables is chosen. It is evident that numerous variables are measured at several tiers, although the details differ (time resolution, measurement method, etc.). The rationale and specifics are discussed individually for each variable in Annex I.
Table 5.2 - Variables needed to meet GCOS/GTOS climate objectives.
| |
GCOS/GTOS CLIMATE OBJECTIVES |
|||||
|
Change Detection |
Seasonal-Interannual Prediction |
Long-term Projections/Modelling |
Impacts Assessment |
|||
|
B |
G |
G |
||||
|
BIOPHYSICAL PROPERTIES OF VEGETATION |
||||||
|
Leaf area index (LAI) |
X |
X |
X |
X |
|
|
|
Met ecosystem productivity (NEP) |
X |
|
X |
|
X |
X |
|
Met primary productivity (NPP) |
X |
|
X |
|
X |
X |
|
Biomass - above ground |
X |
X |
X |
X |
|
X |
|
Biomass - below ground |
|
X |
X |
|
|
|
|
Necromass |
|
|
X |
|
|
|
|
Plant nitrogen and phosphorus content |
|
|
X |
|
|
|
|
Roughness - surface |
|
|
|
X |
|
|
|
Spectral vegetation greenness index |
X |
X |
X |
X |
|
X |
|
Stomatal conductance - maximum |
|
X |
X |
X |
|
|
|
Vegetation structure |
|
X |
|
X |
|
|
|
BIOGEOCHEMISTRY |
||||||
|
Biogeochemical transport from land to oceans |
|
|
X |
|
|
X |
|
Dissolved C, N, and P in water |
|
|
X |
|
|
|
|
Dry deposition of nitrate and sulphate |
|
|
X |
|
|
X |
|
Emissions of CO2, NOX and SOX from combustion of fossil fuels |
X |
X |
X |
|
X |
X |
|
Fertilizer use N & P |
|
|
X |
|
|
X |
|
Rainfall chemistry |
|
|
X |
|
|
X |
|
Leaf biomass - peak of nitrogen fixing plants |
|
|
X |
|
X |
|
|
Volcanic sulphate aerosols |
X |
X |
X |
|
|
X |
|
LAND COVER/USE AND DISTURBANCE |
||||||
|
Fire area |
X |
|
X |
X |
X |
X |
|
Land cover |
X |
X |
X |
X |
X |
X |
|
Land use |
X |
X |
X |
|
X |
X |
|
SOIL PROPERTIES |
|
|
|
|
|
|
|
Cation exchange capacity |
|
|
X |
|
|
|
|
Soil bulk density |
|
|
X |
X |
X |
|
|
Soil total carbon |
|
|
X |
|
|
X |
|
Soil total nitrogen |
|
|
X |
|
X |
|
|
Soil moisture |
|
X |
X |
X |
X |
X |
|
Soil particle size distribution |
|
|
X |
X |
X |
|
|
Soil available phosphorus |
|
|
X |
|
|
|
|
Soil total phosphorus |
|
|
X |
|
|
|
|
Soil pH |
|
|
X |
|
|
|
|
Soil surface state |
|
|
X |
X |
X |
|
|
Rooting depth (95%) |
|
|
X |
X |
X |
|
|
HYDROLOGY |
||||||
|
Relative humidity - atmospheric water content near surface |
|
X |
X |
X |
|
|
|
Surface water flow discharge |
X |
X |
X |
X |
|
X |
|
Evapotranspiration |
X |
X |
X |
X |
|
|
|
Surface water storage fluxes |
X |
|
X |
X |
|
X |
|
Ground water storage fluxes |
X |
|
|
|
|
X |
|
Precipitation (solid and liquid) |
X |
X |
X |
X |
|
X |
|
Precipitation gridded |
X |
X |
X |
X |
|
X |
|
CRYOSPHERIC PROPERTIES |
||||||
|
Firn temperature |
X |
|
|
|
|
|
|
Glaciers and ice caps |
X |
|
|
|
|
|
|
Ice sheet mass balance |
X |
X |
|
X |
|
X |
|
Ice sheet geometry |
X |
|
|
|
|
|
|
Lake and river freeze-up and break-up |
X |
|
|
|
|
X |
|
Permafrost - active layer |
X |
|
X |
X |
|
X |
|
Permafrost - thermal state |
X |
X |
X |
|
X |
X |
|
Sea ice concentration/extent |
X |
X |
|
X |
|
X |
|
Sea ice motion |
X |
|
|
|
|
|
|
Sea ice thickness |
X |
|
|
|
|
|
|
Snow cover area |
X |
|
X |
X |
|
X |
|
Snow depth |
X |
X |
|
|
|
|
|
Snow water equivalent |
X |
X |
|
X |
|
X |
|
RADIATION AND RELATED VARIABLES |
||||||
|
Aerosols |
X |
X |
X |
X |
|
X |
|
Albedo |
X |
X |
|
X |
|
|
|
Cloud cover |
X |
X |
|
X |
|
|
|
Radiation incoming - short-wave |
X |
|
X |
X |
|
X |
|
Radiation reflected - short-wave |
X |
X |
X |
X |
X |
X |
|
Radiation - photosynthetically active radiation (PAR) |
|
|
X |
|
|
|
|
Radiation outgoing - long-wave |
X |
X |
|
X |
|
|
|
Temperature surface - air |
X |
X |
X |
X |
X |
X |
|
Tropospheric ozone thickness |
X |
X |
X |
X |
X |
|
|
TRACE GASES |
||||||
|
Carbon dioxide flux (CO2) |
X |
X |
X |
X |
X |
X |
|
Methane flux (CH4) |
X |
X |
X |
X |
X |
X |
|
ANCILLARY VARIABLES |
||||||
|
Wind velocity |
|
X |
X |
X |
|
|
|
Topography |
|
|
X |
X |
X |
|
The objective of the selection is to take maximum advantage of existing facilities while ensuring an appropriate global distribution of the measurement sites. It is essential that the sites be carefully chosen so as to meet the objectives of GTOS and GCOS. The different objectives associated with the tier 1-5 facilities impose different criteria on site selection. This section outlines basic guidelines for identifying sites at the individual tiers. The site selection process is further considered in Section 7.
Details on the variables selected for measurement are given in the sections on the biosphere, hydrosphere, and cryosphere below and in Annex I. The variables were selected to conform to three criteria:
Relevance - the variables address the core issues of the effect of the land surface on the global climate and the effect of the climate on the land surface. They focus on exchanges of water, energy, and key elements (such as carbon and nitrogen) between the atmosphere and the land, and the impact of these under a changing climate (see Sections 2.3, and 4);
Priority - the variables form a minimum (and highly-integrated) data set. They consist of essential data required to understand and predict the functioning of the land-atmosphere interface, and comprise primary variables (those quantifying the interchange directly) and secondary variables (those required to derive or interpret the primary variables);
Practicality - variables are obtained by proven, stable methods, globally robust, repeatable, affordable and already widely applied.
Table 5.2 indicates the importance of each of the selected variables in relation to GCOS/GTOS objectives. It is evident that some variables are critical to several objectives while others only to few or one. Nevertheless, the achievement of the objectives depends on these data being available with the resolution, sampling frequency and accuracy indicated in Annex I.
While some variables are measured at several tiers, others are obtained at one tier only. The relationship of variables to tier measurements are shown in Table 5.3. It is likely that where a variable is measured at several tiers, the measurement method will vary among the tiers. This has been considered in Annex I in relation to individual variables where the item 'Measurement method' lists the measurements at the various tiers.
The TOPC considered various options for identifying the highest priority variables for initial implementation. The criteria selected for prioritizing the variables are related to importance and feasibility (Table 5.4):
What is the impact of the variable in both depth and breadth?
How well will the variable help meet a specific GCOS objective?
What is the cost of implementing?
What is the existence of implementing structures?
It is important to note that important variables exist without a feasible measurement methodology (e.g., soil moisture). These gaps point to priority areas for further research and development of measurement programmes.
In addition to the surface sampling system based on in situ sites, there are a number of satellites which provide essential data at tier 5. Landsat and SPOT are particularly useful to the terrestrial community for a number of measurements including monitoring radiation, leaf area index, and detecting changes in land cover and land use. The AVHRR of NOAA has provided useful data at >1 km resolutions as noted above. Several new sensors are due to be launched in the next five years which will revolutionize land remote sensing to the benefit of programmes such as GCOS. They include the Moderate Resolution Imaging Spectroradiometer (MODIS), vegetation instrument on SPOT-4, and the Medium Resolution Imaging Spectrometer (MERIS) to provide improved data at resolutions 250 m to 1 km.
Table 5.3 - Recommended variables at each tier.
|
PROPOSED VARIABLES* |
||
|
Biophysical Properties of Vegetation |
Soil Properties |
Cryospheric Properties (cont'd.) |
|
Leaf area index (2,3,5) |
Soil cation exchange capacity (2,3,4) |
Permafrost active layer - thickness (2,3,4) |
|
Net primary productivity (2,3) |
Soil moisture (2,3,5) |
Permafrost thermal state (2,3,4) |
|
Net ecosystem productivity (2,3) |
Soil total carbon (2,3,4) |
Sea ice concentration/extent (5) |
|
Biomass - above ground (2,3,5) |
Soil total nitrogen (2,3,4) |
Sea ice motion (5) |
|
Biomass - below ground (2,3) |
Soil available phosphorus (2,3,4) |
Sea ice thickness (4) |
|
Necromass (2,3,4) |
Soil total phosphorus (2,3,4) |
Snow cover area (5) |
|
Plant nitrogen and phosphorus content (2,3) |
Soil bulk density (2,3,4) |
Snow depth (2,3) |
|
Roughness - surface (2,3) |
Soil particle size distribution (2,3,4) |
Snow water equivalent (2,3,4) |
|
Spectral vegetation greenness index (5) |
Soil pH (2,3,4) |
Radiation |
|
Stomatal conductance - maximum (2,3) |
Rooting depth 95% (2,3,4) |
Aerosols (2,5) |
|
Vegetation structure (2,3,4) |
Soil surface state (2,3,4) |
Albedo (2,3,5) |
|
Biogeochemistry |
Hydrology |
Cloud cover (2,3,5) |
|
Biogeochemical transport from land to oceans (2,3) |
Relative humidity (2,3) |
Radiation incoming - short-wave (2,3) |
|
Dissolved organic C, N and P in water (2,3) |
Surface water flow discharge (2,3) |
Radiation reflected - short-wave (2,3,5) |
|
Dry deposition of nitrate and sulphate (2,3) |
Evapotranspiration (2,3) |
Radiation - fraction of photosynthetically active radiation (2,3,5) |
|
Emissions of CO2, N and S from burning fossil fuel (2) |
Surface water storage fluxes (2,3,5) |
Radiation outgoing long-wave (2,3,5) |
|
Fertilizer use N and P (N/A) |
Ground water storage fluxes (2,3) |
Temperature surface - air (2,3) |
|
Leaf biomass - peak of nitrogen fixing plants (2,3) |
Precipitation (2,3,5) |
Tropospheric ozone thickness (2) |
|
Rainfall chemistry (2,3) |
Precipitation gridded (N/A) |
Trace Gases |
|
Volcanic sulphate emissions (2) |
Cryospheric Properties |
Carbon dioxide flux (2,5) |
|
Land Cover/Use and Disturbance |
Firn temperature (2,3) |
Methane flux (2, 5) |
|
Fire area (5) |
Glaciers and ice caps (2,3,4,5) |
Ancillary Variables |
|
Land cover (2,3,4,5) |
Ice sheet mass balance (2,3,5) |
Wind velocity (2,3) |
|
Land use (2,3,4) |
Ice sheet geometry (2,3,5) |
Topography (5) |
|
|
Lake and river freeze-up and thaw (3,5) |
|
* NOTES:
1) Numbers in brackets refer to the tier where the variable would be measured;
2) Tier 1 measurements are not listed here as their choice is dictated by the specific study; in general, it will include many of the variables identified here;
3) Variables derived through models combining several variables are not listed. For example, net primary productivity can be estimated at tier 5 using satellite measurements and global data sets of vegetation, soil, and meteorological variables;
4) It is assumed that tier 4 sites would be operated by, or have access to, tier 3 facilities. Thus they would be able to undertake laboratory analyses for e.g., soil properties;
5) The feasibility of accurately estimating some variables from satellites (near-surface soil moisture, trace gases) is under investigation or instrument development.
Table 5.4 - Prioritization of recommended variables.
|
VARIABLE |
INTEREST BY TERRESTRIAL CATEGORY |
||
|
Priority: P1 = high; P2 = medium; P3 = low. Use: a = climate change detection; b = impact assessment; c = prediction and simulation; d = model validation. Feasibility: F1 = high; F2 = medium; F3 = low. |
|||
|
|
CRYOSPHERE |
ECOSYSTEMS |
HYDROSPHERE |
|
Aerosols |
|
P1 (c,d) F1 |
|
|
Albedo |
P1 (a,b,c,d) F2 |
P2 (c.d) F2 |
|
|
Biomass |
|
P2 (b,d) F2 |
|
|
CH4 flux |
P2 (c) F2 |
P1 (a,b,c) F1 |
|
|
Cloud cover |
P3 (a,b) F2 |
P1 (b,c,d) F1 |
P3 (a,c) F3 |
|
CO2 flux |
P3 (b,c) F1 |
P1 (a,b,c,d) F1 |
P3 (a,b,c) F1 |
|
Evapotranspiration |
P2 (b,c) F2 |
P2 (a,b,c,d) F2 |
P1 (a,b,c,d) F3 |
|
Fire area |
|
P2 (a,b) F1 |
|
|
Glaciers and ice caps |
P1 (a,b,d) F1 |
|
P2 (a,b,c,d) F2 |
|
Ground water storage fluxes |
P2 (b,c) F3 |
P3 (b) F2 |
P1 (a,b) F2 |
|
Ice sheet geometry |
P1 (b,c,d) F2 |
|
P3 (a,b) F3 |
|
Ice sheet surface balance |
P2 (b,c,d) F2 |
|
P3 (a,b) F3 |
|
Lake and river freeze-up and break-up (timing) |
P2 (a,b) F2 |
P3 (a,b) F2 |
P2 (a.b) F2 |
|
Land cover |
P2 (b,c) F2 |
P1 (a,b,c,d) F1 |
P2 (a,b,c,d) F1 |
|
Land use |
P2 (b,c) F2 |
P2 (a,b) F2 |
P2 (a,b,c,d) F1 |
|
Leaf area index (LAI) |
|
P1 (a,b,c,d) F1 |
|
|
Biogeochemical transport from land to oceans via rivers |
P2 (b) F2 |
|
P1 (a,b,c,d) F1 |
|
Necromass |
|
P2 (b,d) F2 |
|
|
Net ecosystem productivity (NEP) |
|
P1 (a,b,c,d) F1 |
|
|
Net primary productivity (NPP) |
|
P1 (a,b,c,d) F1 |
|
|
Tropospheric ozone |
|
P2 (a,b) F2 |
|
|
Permafrost - active layer |
P1 (b,c,d) F1 |
P2 (a,b) F1 |
P2 (a,b,c,d) F3 |
|
Permafrost - thermal state |
P1 (a,b,d) F2 |
|
|
|
Precipitation - point |
P1 (b,c,d) F2 |
P2 (a,b) F2 |
P1 (a,b,c,d) F1 |
|
Radiation - fraction of photosynthetically active radiation |
|
P1 (a,b,c,d) F1 |
|
|
Radiation outgoing - long-wave |
P1 (a,b,c,d) F1 |
|
P2 (c) F1 |
|
Radiation incoming - short-wave |
P1 (b,c,d) F1 |
P1 (a,b,c,d) F1 |
P2 (c) F1 |
|
Radiation reflected - short-wave |
P1 (a,b,c,d) F1 |
P1 (a,b,c,d) F1 |
P2 (c) F1 |
|
Rooting depth (95%) |
|
P2 (b,d) F1 |
|
|
Roughness - surface |
P2 (b,c,d) F1 |
P2 (b,d) F2 |
P2 (c,d) F1 |
|
Sea ice concentration/extent |
P1 (b,c,d) F1 |
|
|
|
Sea ice motion |
P2 (c,d) F2 |
|
|
|
Sea ice thickness |
P1 (a,c,d) F2 |
|
|
|
Snow cover area |
P1 (a,b,c,d) F1 |
P1 (a,b,c,d) F1 |
P2 (b,c,d) F1 |
|
Snow water equivalent |
P1 (b,c) F2 |
P2 (a,d) F2 |
P1 (b,c,d) F2 |
|
Soil bulk density |
P3 (b) F3 |
P1 (b,d) F1 |
P3 (c) F3 |
|
Soil total carbon |
|
P2 (b,d) F1 |
|
|
Soil moisture |
P3 (b,c) F3 |
P1 (a,b,c,d) F1 |
P1 (b,c,d) F3 |
|
Soil particle size distribution |
|
P1 (b,c,d) F1 |
|
|
Soil available phosphorus |
|
P2 (b) F2 |
|
|
Soil total phosphorus |
|
P1 (c,d) F1 |
|
|
Soil surface state |
|
P3 (b) F2 |
P3 (c) F3 |
|
Soil total nitrogen |
|
P2 (b,c) F2 |
|
|
Surface water flow discharge |
P2 (b,c,d) F2 |
|
P1 (a,b,c,d) F1 |
|
Surface water storage fluxes |
P3 (c) F2 |
P2 (a,b) F2 |
P1 (a,b,c,d) F2 |
|
Temperature surface - air |
P1 (b,c) F1 |
P1 (a,b,c,d) F1 |
P2 (b,c,d) F1 |
|
Topography |
P1 (a,b,c,d) F2 |
P1 (c) F1 |
P2 (c,d) F2 |
|
Spectral vegetation greenness index |
P3 (a,c) F2 |
P2 (a,d) F1 |
P3 (a,c) F2 |
|
Vegetation structure |
P3 (b,c) F2 |
P1 (a,b,d) F1 |
P3 (a,b,c) F3 |
|
Water vapour surface - relative humidity |
P2 (c) F3 |
P2 (a,b,c) F2 |
P1 (a,b,c,d) F3 |
|
Wind velocity |
P1 (b,c) F2 |
P2 (b,c,d) F2 |
P3 (b,c,d) F3 |
![]()
![]()
![]()