Spatial data collection starts with compiling satellite images, maps and ancillary
data (e.g. compartment records). Topographic maps are used and forest maps
are required to obtain information on land use, contours, rivers, roads, compartment
boundaries and years of logging. A 1998 satellite image of the study area
(Figure 3) was purchased from the Malaysian Centre of Remote Sensing (MACRES). Harvesting
records were obtained from the Forestry Department.
Figure 3. Raw image of Landsat TM band 543 for Tekam Forest Reserve
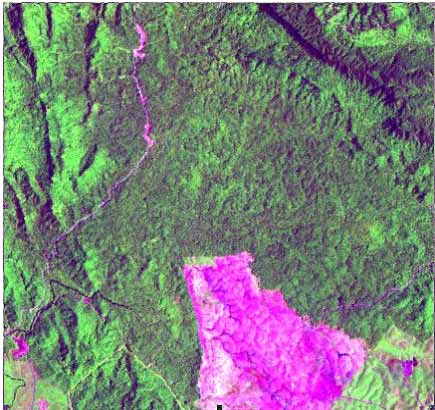
Raw satellite images need to undergo all related pre-processing operations such
as geocoding, filtering, masking and unsupervised classification. The quality
of this pre-processing contributes substantially to the accuracy of the final
thematic products. In this study, two image-processing techniques were adopted,
i.e. the conventional technique using ERDAS software and the FCD model.
The ERDAS remote sensing software was used
for processing the Landsat TM image of the study area. First, geometric correction
was conducted based on the transformation derived from a set of ground control
points (GCP) from the topographic map. This ensured that the image’s location
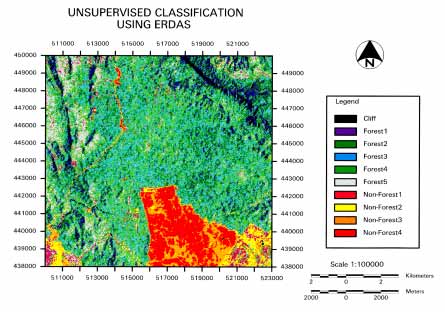
was positioned to its exact and true location. In the next step, the image was filtered to minimize speckle and noise. During unsupervised classification the program
classifies the image into several assigned classes, in this case 10 classes
(Figure 4). When the topographic map was overlaid onto the image with the
10 classes, features like forest, agriculture, roads and open areas could
be determined easily. These features were divided into two categories, i.e.
forest and non-forest. Five classes were classified as forest, four as non-forest
areas and one as mountain ridge. The classes under the forest category needed
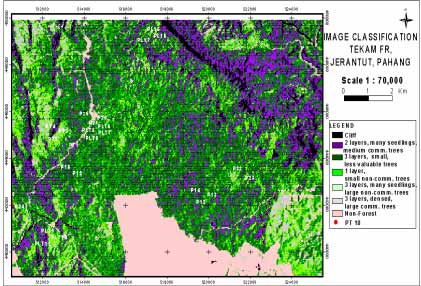
to be verified further during ground truthing. Ground-truthed data
were used to define regions of interest (ROI) in the classified image. This
information was used to reclassify the image during supervised classification.
The supervised classification image produced a clearer and better picture
of the forest categories (Figure 5).
Figure 4. Image of unsupervised classification
using ERDAS
Unlike the conventional remote sensing method that assesses the forest status
based on qualitative data analysis derived from “training areas”, the FCD
model is based on forest conditions, which is a quantitative analysis. FCD
utilizes forest canopy density as an essential parameter for characterization
of forest conditions. The degree of forest density is expressed in percentages.
It also indicates the degree of degradation and hence, prioritizes sites in
need of rehabilitation. The principal features of the FCD include 1) rapid
stratification of forests into canopy density categories (i.e. 0 to 100 perce
nt); 2) production of tables showing the number of hectares in each category;
and 3) a printout of coloured maps that clearly illustrates forest conditions
(Rikimaru et al. 1999).
Figure 5. Supervised classification image using ERDAS
The source of remote sensing data for the FCD-Mapper is Landsat TM. The FCD-Mapper
is a semi-expert system for analysing satellite imagery and is compatible
with Microsoft©software. . In this study, the same Landsat TM image that was processed by ERDAS was used.
The image was first processed for noise reduction because clouds or cloud
shadows or water areas can influence the statistical treatment and analysis
of the data adversely. This was followed by range normalization of the TM
data for each band. The FCD model combines data from four indices:
The four index values were expressed in percentages
for each pixel. Using the above four indices the forest canopy density was
determined. Similar to the image processed by ERDAS, unsupervised classification
was carried out and 10 classes were assigned (Figure 6). However,
ground truthing could identify only four different classes. The results
of supervised classification are shown in Figure 7. The flowchart of the procedures
for the FCD model is illustrated in Figure 8.
Ground truthing was carried out to verify the compartment boundaries, forest
classes and to note any special feature that could not be detected in the
image. For each forest class, several ground truthing plots were established
and information such as stem frequency, sizes and structure was collected.
Basically, ground truthing provides details of the forest condition including
canopy layers, dominant tree species, elevation, location, understorey vegetation
and tree diameters. The data were used to define the classified image and
related maps were produced.
Figure 6. Unsupervised classification image using FCD
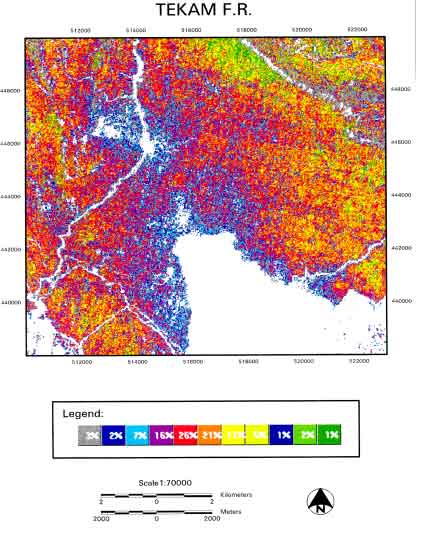
Figure 7. Supervised classification using FCD
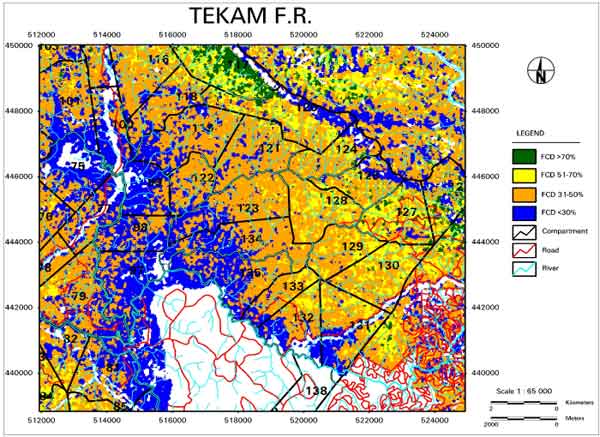
Figure 8. Flow chart of FCD Mapping Model (Rikimaru,
2002)