


The supervised classification image (Figure
5) produced five forest classes that, when verified on the ground, gave the
following results (Table 5).
Table 5. Verification of the forest classes in the ERDAS supervised
image
|
Class |
Area (ha) |
Verification |
|
1 |
2 463 |
Ridge areas with a canopy structure consisting of two layers. Trees
consist mainly of medium-sized commercial trees and many seedlings.
Some open areas are colonized, mainly by ferns. |
|
2 |
4 955 |
Lowland areas with three distinct canopy layers. These regenerating
forests consist of mainly less valuable non-dipterocarp trees, which
are small with dbh < 60 cm, although occasionally there are some
bigger trees. |
|
3 |
3 678 |
Forest areas, which are more open (probably due to heavy logging).
They have a one-layered canopy structure with very few climax species.
They are mostly colonized by pioneers and other light-demanding species.
Bamboos and palms are abundant in some areas. |
|
4 |
539 |
These are areas that are more representative of the original forests
in terms of their canopy structure. They have three canopy layers
and many large trees. However, non-dipterocarps dominate. Occasional
dipterocarps may be protected and other trees that were not removed
during logging. |
|
5 |
239 |
These areas are also representative of the original forests both
in canopy structure and species composition. They may consist of fully
regenerated forests or areas that were not disturbed by logging activities.
The canopy has three layers and valuable commercial species of dipterocarps
and non-dipterocarps abound. |
Another feature that is clear from the image is the elevation of the study
area (Figure 9). When overlaid onto the contour map, the classified image
clearly showed the differences in elevation. This was also verified by the
ground truthing.
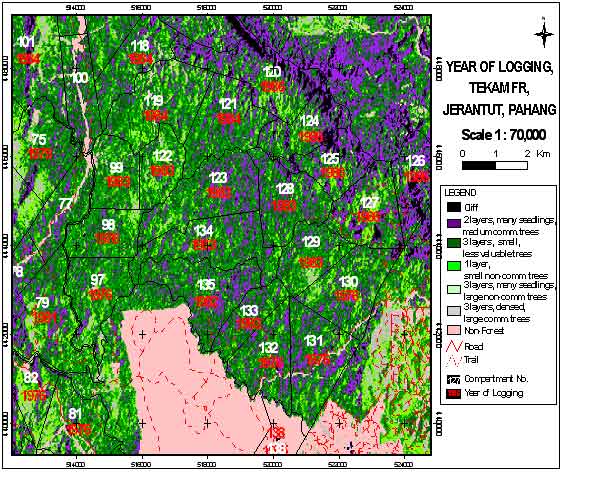
The map depicting the year of the last
logging entry was also overlaid onto the classification image (Figure 10).
This procedure intends to relate the forest condition with the year the forest
was logged. The compartment number, size and year since logging are shown
in Table 2. Attempts were made to obtain information on the logging intensities
and volume of timber removed from the areas. Visual comparison of forest conditions
indicated that years since logging may be a poor parameter for stratification
of the forests because of differences among logging operations. The condition
of the residual stand depends to a considerable extent on the logging practices
employed by different contractors. In extreme cases of poor logging the area
was badly logged and the residual forest was not able to regenerate according
to the prescribed cutting cycle.
Supervised classification reduced the 10
classes assigned by the unsupervised classification to four classes (Table
6). Forest density class 2 is most extensive covering 46 percent of the area.
The second most extensive class is forest density class 1, which covers 34
percent of the area. Based on the canopy densities, i t can be assumed that
these two classes have fewer big trees and more saplings and seedlings. This
indicates a stand that has been logged more recently and requires a longer
time to recover before harvesting can be carried out again. The supervised
classification also shows that the area with more mature trees and higher
canopy densities covers only about 20 percent of the total area.
Figure 9. Elevation overlaid onto classification image
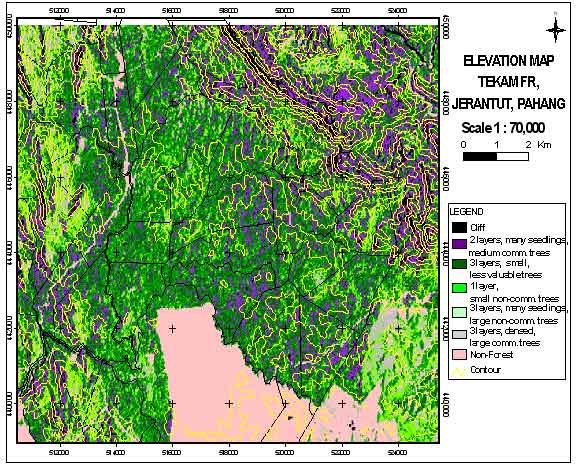
Table 6. FCD results based on the supervised image
|
FCD classes (% crown) |
Class |
Colour |
Coverage area |
|
|
(ha) |
% |
|||
|
>70 |
4 |
Green |
472 |
4 |
|
50-70 |
3 |
Yellow |
1 889 |
16 |
|
30-50 |
2 |
Brown |
5 431 |
46 |
|
<30 |
1 |
Blue |
4 014 |
34 |
|
Total |
11 806 |
100 |
||
Figure 10. Year of logging overlaid to supervised classification
image.
Data collection in the field took place between late December 2001 and February
2002. The planned activities were slowed down by unusually heavy rains. A
reconnaissance inventory consisting of a small numbers of plots was conducted
in each forest stratum. Plots were located at grid intersections close to
roads.
For the point sampling of the large trees, a wedge prism of basal area factor
(BAF) 4 was used. The choice of BAF usually depends on the density and size
of trees within the stand. Denser stands and larger trees require a higher
BAF factor. Wide-angle relascopes could also be used, but they are more expensive
and more cumbersome to handle especially in moist conditions. However, they
are easier to apply on steep terrain, as relascopes automatically compensate
for elevation. The wedge prism was considered adequate for the purpose of
the study. It is usually easier to perform the survey with the same BAF for
the whole inventory, although changing the BAF for different forest strata
does not affect the calculations. In fact, if the crew is not constrained
in the field, it is recommended to use a lower BAF of 2 or 3 for more open
forest strata with a larger proportion of small trees.
Two field crews of four persons each were deployed in the field. Each crew consisted
of a field leader who also recorded information. One person equipped with
a compass and a GPS led the team to the sampling lines and located plots (This
person may also take the prism readings for the point sampling.). The other
two persons measured trees, established plots and sometimes took prism readings.
The standard equipment used included:
Sampling points were determined on the map and located
on the ground with the help of topography maps and the GPS. Points were demarcated
clearly on the ground with PVC pipes. During the actual inventory, some points
may be revisited for auditing or for continuous and periodic measurements.
