Previous TOF inventories
A number of local, regional and global inventories have been conducted, many of which differ in their approaches and purpose. Several studies have used conventional forest inventory methods while others have drawn upon estimates from small surveys and interviews. The quantification of products can be based on many different parameters, including estimates of global output, market outputs, observed/potential productivity levels or economic valuation of specific products from TOF resources. Despite these differences, the case studies show the type of information that can be obtained and the different types of techniques that can be utilized for a TOF inventory.
Haryana State, India
Haryana covers a geographic area of 4.42 million ha. The TOF rural area comprises 4.26 million ha. In 1991, the population of the state was 16.47 million, of which 75.4 percent was rural. The economy of the state is predominantly agricultural. The livestock population stood at 9.14 million in 1992 (Livestock Census 1992). As there is not sufficient land for fodder production or for open grazing, livestock is putting tremendous pressure on the forest and plantation resources of Haryana.
Haryana is considered deficient in forest resources. Out of the total area, 82.8 percent (3.51 million ha) is under cultivation and 3.85 percent (0.17 million ha.) is designated as natural forest. Dominant species in these forests include Acacia spp., Anogeissus spp., Prosopis spp., Dalbergia sissoo, Ficus spp., Azadirachta indica, Shorea robusta and Bombax ceiba.
In 1991, Haryana had a total of 6 988 villages. Out of these, 219 villages were randomly selected and surveyed as per the method discussed in Chapter III. The data collected from these villages was used to estimate tree density and volume for the State of Haryana. The total volume was estimated at 10.34 million m3 and the total number of trees at 55.14 million trees.
West Bengal State, India
The geographical area of the State is 8.87 million ha, of which 7.68 million ha are outside forest areas. The forest cover is 9.42 percent and the designated forested area covers 13.38 percent of the total geographic area. West Bengal’s physiography has two natural divisions: the Himalayan North and the fertile alluvial Gangetic plain.
In West Bengal, 25 villages were randomly selected for the pilot survey. All the trees with a DBH of 10 cm and above were enumerated in the selected villages. However, in South Bengal, trees down to 5-cm diameter were also recorded. In the pilot survey, only the total number of trees were estimated and not their volume. The total number of trees in the State of West Bengal was approximately 196 million or 25.4 trees/ha.
Karnataka State, India
The geographic area of Karnataka is 19.18 million ha, of which 18.75 million ha are considered to be outside forest areas. In 1991, the population of the State was 44.98 million with a rural population of 31.07 million. In 1992, the livestock population was 29.56 million and the designated forestland was 3.87 million ha constituting 20.19 percent of the total geographical area. However, the forest cover of the State, as assessed by the FSI was actually only 3.24 million ha. Of the forest cover in this survey, 2.48 million ha were characterized as "dense forest" and the remaining 0.76 million ha as "open".
In Karnataka, 10 villages were randomly selected for the pilot survey, with one village in each district, so that all districts of the State were represented. Only the total number of trees was estimated and not the volume. The estimated total number of trees in rural areas for the whole State was 296 million trees or 15.8 trees per ha.
Kenya
The Kenya’s Forestry Master Plan (KFMP) was launched in 1991. A major objective of the KFMP was to provide recommendations for the formulation of appropriate forest policies. For the preparation of the KFMP a systematic survey of the potential woody biomass contribution from TOF resources was conducted at the national level. Variables that were estimated included the standing volume, species distribution, and potential future use of the woody biomass outside actual forests.
The survey was based on a two-stage sampling design. The first stage consisted of low-altitude air photos. The second stage consisted of field measurements in a sub-sample of the photos. Interpretation of aerial photos provided a subjective classification of the woody biomass into crude cover classes. Using detailed and objective field measurements in a sub-sample of the photos, it was possible to convert the interpretations into objective volume figures, species distribution, etc. This is an example of a classical design for forest inventory that is also suitable for a TOF inventory.
In the second stage, aerial photos were taken in June 1991 with a 24 ´
36 mm camera using colour film. Each photo covered approximately 700 ´
500 m on the ground. The photos were taken along flight lines, 5 km apart, with a 2.5-km distance between photos along the lines, resulting in a total area coverage of 3 percent. A total of 7 587 photos, systematically distributed over the entire survey area were taken at a scale of 1:1 000, allowing the identification of single trees down to a crown diameter of about 2 m. Two hundred grid points were then placed on each photo and visually classified into 12 classes. This resulted in 1.5 million classification points, with a sub-sample of 28 000 recorded trees. Between December 1991 and June 1992, 150 of the photographed areas were ground-truthed, and interpretation points and single trees were located and measured. At each point, a sample plot was laid out and all trees were classified according to species, volume, and potential use of the wood. The same parameters were recorded for single standing trees. The results of this survey were based on field measurements of 1 183 points and 878 single trees.
The volume per unit area (m3/ha), distribution of tree species and potential uses of the biomass were calculated for eac
h sample plot. The results were then grouped according to the defined classes. Since the photos were located on a UTM-grid, it was possible to use regression analysis to test the field data for possible relationships with agro-climatic zones. It was assumed that sample plots within the same class could differ, primarily in stocking, among zones. Finally, average volumes and standard errors were calculated for each class. A similar analysis was applied on individual trees using crown diameter and shape, to estimate the volume of the tree (resulting in a volume table for biomass). The results of these calculations provided information on the composition of the woody biomass in farmlands, based exclusively on the field measurements, and class-wise volume estimates that can be applied on all interpreted data from the 7 587 photos. This survey thus converted covered areas into measurements of standing volume in a very cost-effective way.
A change study was conducted for the entire survey area, using a set of 258 systematically sampled photos of the same type as previously described. The two sets of photos from 1986 and 1992 covered exactly the same area. Changes in biomass cover, between 1986 and 1992, were analysed by dividing each photo into 48 squares. A total of 12 384 squares were interpreted. The significance of the visual changes on the photos was also ground-truthed at a district level.
No significant relationships were found between the stocking volume and agro-climatic zone for any class. Therefore, the average figure for each class was assumed to be constant over the entire survey area. Species distribution and potential biomass use indicated that eucalypts were the most important tree species and that 30 percent of the volume was classified for timber and veneer uses.
The average estimated standing volume of woody biomass outside forests was 16.4 m3/ha, of which 25 percent can be referred to as planted and the remainder as natural woodland (including riparian areas). When calculated by district, the volume ranged from 4.7 to 36.2 m3/ha. This seems to indicate that culture, education and habits (which vary among districts) are significant factors in determining the distribution of TOF. There was a strong correlation (r2 = 0.64) between population density and standing volume of TOF.
The change study revealed that the standing volume of planted trees had increased on average by about 4.7 percent annually, which is higher than population growth in Kenya. No district showed a significant decrease in volume. The amount of natural vegetation appeared to be approximately constant. The estimated standing volume of planted trees was over 40 million m3 on farmlands, which was higher than the industrial plantations under government administration.
Sri Lanka
The total population of Sri Lanka in 1999 was 18.90 million with a population density of 290 persons per km2. Administratively, the country is divided into nine provinces and 25 districts. The land area of the Sri Lanka is 65 156 km2. In 1999, the country’s dense natural forest cover (canopy density of > 70 percent) represented 23.9 percent of the total land area, while the total forest cover including sparse forest (canopy density of < 70 percent) was 20 466 km2, representing about 31 percent of the land area. Shifting cultivation in the early 1990s affected around 1.2 million ha or about 18 percent of the total land area. In 1995, TOF provided 8.83 million tonnes of biofuel accounting for 90 percent of total production (9.87 million tonnes). TOF covered about 30 percent of the country’s land area and contribute about 70 percent of the total supply of industrial and construction wood (FSMP 1995).
There are different categories of TOF resources in Sri Lanka: 1) home gardens (cultivated areas around a house); 2) rubber plantations, coconut plantations, shade trees in tea-coffee and cocoa plantations, windbreaks and shelterbelts, roadside plantings, trees on farmlands (Palmyrah palm, cashew-nut and other perennial orchards); and 3) plantations in and around urban areas.
In response to a request from the Forest Sector Master Plan (FSMP), the Forest Management Plan Project (FORMP) used 1992 satellite images to update the nationwide forest-cover maps. In this study, tree cover included forests, forest plantations, and TOF resources with ample crown coverage (i.e. land under home gardens, rubber, and coconut). It excluded tea, other crops, and other land uses with only sparse tree cover. The resulting statistics on forests and trees cover:
- forests and forest plantations, based on FSMP 1992 satellite images; and
- home gardens, rubber, and coconut, based on 1992
satellite images.
The statistics on home gardens were estimated using the difference method. With this method, the residual TOF resources were obtained by subtracting the areas for rubber and coconut2, from the total forest area recorded.
2 These figures were derived from the 1990 data of the Rubber Control Department and the 1992 data of the Coconut Development Authority and the Survey Department, respectively.
A recent study in Sri Lanka entitled "The effect of the wood products industry on natural forests" used a method that included the collection of TOF data through participatory rural appraisals. The study, which included a survey of home garden owners and timber industry stakeholders, was conducted in seven districts with different climatic, physical and socio-economic conditions. Data collected included species and number of trees in home gardens, their age structure, the rate of cutting and the proposed planting rate to estimate the quantity of timber extracted and to assess their importance as a source of timber.
The results of this study showed that the average number of trees in a home garden is around 180 trees per ha. Furthermore, the largest number of trees (per ha) in home gardens were noted in certain districts, especially those in the wet zone, due to the large areas covered by rubber and coconut. In the dry zone, tree densities were lower (71 trees/ha) and most trees had not been planted but regenerated naturally. It was also observed that there is a trend towards planted trees for timber production. This was also confirmed recently by Ariyadasa (2002)
The FSMP (1995) estimated that home gardens covered an area of about 858 500 ha in 1992, compared to about 781 000 ha in 1983. The area under home gardens has been increasing by about 1 percent (8 000 ha) annually since the 1980s, while the rubber plantation decreased in size at an annual rate of about 0.5 percent between 1956 to 1982.
The FSMP (1995) also estimated the number of saw logs and poles that can be produced from the TOF resources based on a model forecasting the demand and supply of different wood products. The general form of the basic model was estimated in the following log-log form:
InC = a + b lnX +e
where InC is the natural
log of consumption per capita, a is a constant,
X is the real GDP per capita, b represents the income elasticity of demand and e is the error term. GDP and population have been taken as the main demand shifters.
In 1992, home gardens occupied 858 000 ha, rubber plantations occupied 197 000 million ha, coconut plantations occupied 300 000 million ha and tea over 189 000 million ha. The wood production from TOF resources was projected to increase from 1.86 million m3 in 1995 to 2.18 million m3 in 2020.
Bangladesh
Bangladesh has a population of about 130 million, which was growing at an annual rate of 1.7 percent (1995-2000). Almost 80 percent of the people live in the rural areas. The total land area of the country is about 14.4 million ha, of which 9.25 million ha is cultivable, 2.59 million ha uncultivable and 2.56 million ha are recorded forests. Of the total recorded forests, 2.22 million ha are State forests and 0.34 million ha are private forests (village forests 0.27 million ha and tea/rubber plantations 0.07 million ha) (FMP, 1992). However, only 0.93 million ha (6.5 percent) is under forest or tree cover, which is about 40 percent of the government, controlled forests. The remaining 60 percent include degraded grassland, scrub and encroached lands.
Of the total wood produced in Bangladesh, 80 percent is used as fuelwood and most of the remainder as sawntimber. It is estimated that total annual wood production is 9.5 million m3 (FMP 1992).
In Bangladesh, homestead forests are the most important source of wood, bamboo and other non-wood forest products. Because of its importance and prevalence, the term homestead forest is now used synonymously with village forests and rural forests. The terms village forests and rural forests are used in a wider sense to refer to an aggregation of scattered trees in villages (e.g. trees on homesteads, road sides, common access lands, community lands, premises of educational institutions and places of worship). TOF resources in Bangladesh thus refer to:
- trees grown in multi-tiered gardens of a homestead;
- woodlots or block plantations;
- agro-forestry plantations; and
- strip plantations along road and highways, railways, district council and feeder roads.
Prior to 1980/81, little was known about TOF resources (and in particular homestead forests) in Bangladesh. Since then, many local-level studies and a few national studies have been conducted to estimate the area of village and homestead forests, their growing stock of wood and bamboo, and average annual production of materials. The first three homestead/village forest national surveys conducted in 1981 and 1992 used similar methodologies.
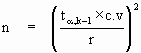
In the 1981 study for bamboo, a sample of 6 000 households was randomly selected from among the 267 selected villages. In the other two studies in 1981 and 1992, 6 675 households were selected. The households in the selected villages constituted the final stage of sampling. They were selected randomly from the Union Parishad list in the Holding Tax Register. The selected households were classified into four landholding classes as given below:
| Class – I | | Less than 0.2 ha |
| Class – II | | 0.2 to 1.0 ha |
| Class – III | | 1.0 to 3.0 ha |
| Class – IV | | More than 3.0 ha |
Almost all households in Bangladesh, except in the coastal and low-lying areas, cultivate bamboo. The estimated quantity of bamboo use was about 10.2 culms/capita/annum.
The latest national survey was conducted for the preparation of the Forestry Master Plan (FMP 1992). Total growing stock of homestead and village forests was estimated to be 55 million m3. About 76 percent of the stems were found on homesteads occupied by landless, marginal and small landholders. Only 24 percent of the stems were found on areas owned by medium and large landholders.
The fuelwood component of the growing stock was estimated to be about 40 million m3 (73 percent of the total growing stock). Sawlogs made up 15 million m3 (27 percent). The per capita consumption of bamboo was estimated at 6 culms/year against the availability of 4.3 culms for mature and 7 culms for immature bamboo, per capita per year.


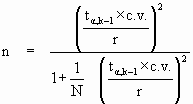
is sample mean