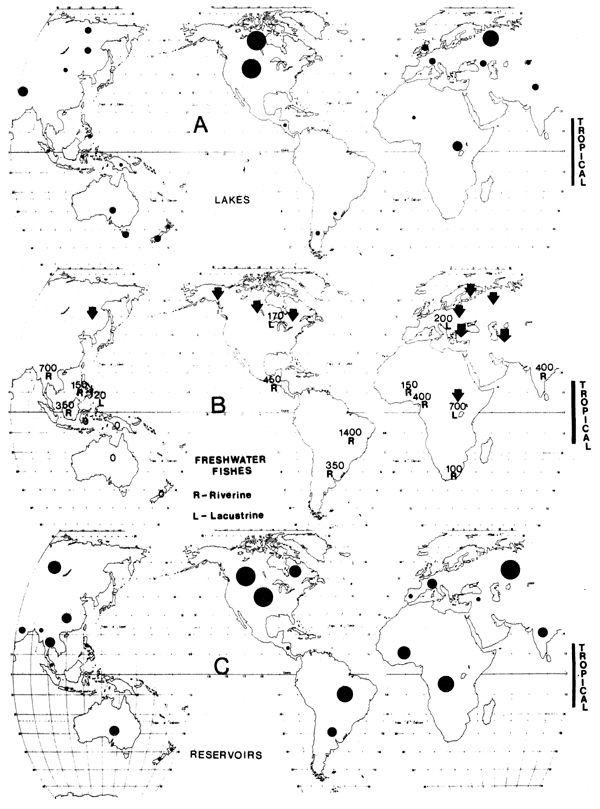
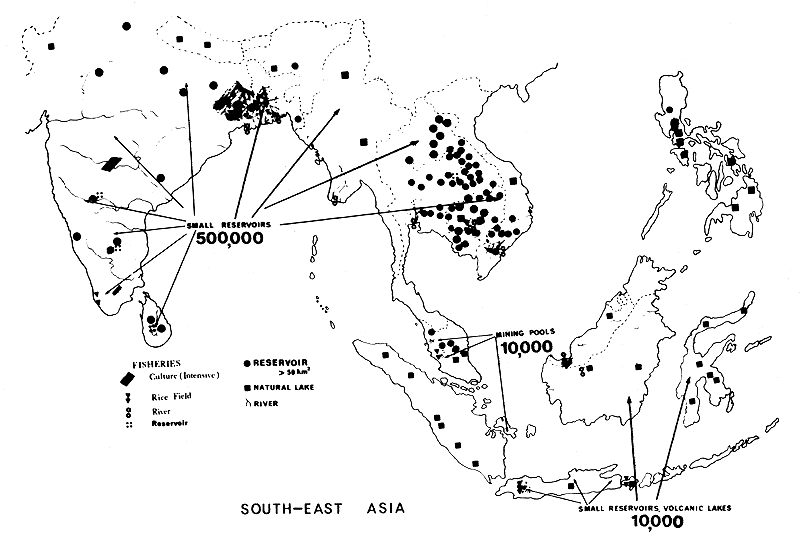
The number of reservoirs is steadily growing in all parts of the world. Rivers are being dammed, and the water level of natural lakes raised. The purpose of damming may include irrigation, hydroelectric power generation, flood control, public water supply, recreation, navigation and fisheries. In 1976, the reservoir area of Southeast Asia was estimated at 30 000 km2, and this figure will increase to 150 000 km2 before the turn of the century (Fernando, 1980). There are approximately 20 000 km2 of reservoirs in India, 1 393 km2 in Sri Lanka (Mendis, 1977), 2 038 km2 in Thailand (Bhukaswan, 1978), 270 km2 in Indonesia (Sarnita, 1977), 284 km2 in the Philippines (Datingaling, 1977) and 54 km2 in Malaysia (Johar, 1977). There is no information available from Burma, Bangladesh, Vietnam, Lao, Kampuchea and Singapore. A number of reservoirs has been constructed in Europe, North and South America, Australia and New Zealand. There are over 280 large reservoirs (storage more than 108 m3) and 1 800 medium-size reservoirs (storage 107-108 m3) in China (Tapiador et al., 1977). In Africa, in 1973, the area covered by man-made lakes was 27 466 km2 (Fels and Keller, 1973). In the United States, exclusive of Alaska and the Great Lakes, reservoirs have produced more water area than natural lakes (Lagler, 1971). In January 1976, the 1 493 US reservoirs covered 39 570 km2 (Jenkins, 1976). In 1977, in the Soviet Union, reservoirs with volume larger than 50 million m3 covered an area of 121 979 km2 (Avakyan and Sharapov, 1977). The most up-to-date information on the world's reservoirs is that provided by Fels and Keller (1973). According to a report by Unesco (1978), water surface area of world reservoirs presently totals 600 000 km2. Distribution of reservoirs in the world and in Southeast Asia is shown in Figure 1 and Figure 2 respectively.
Scientists began to study the possible use of reservoirs for fishery purposes in the early 1920s. Some viewed reservoirs as “biological deserts” because of low fish productivity after the first few years of high production (Ellis, 1942). Intensive forms of management were applied in the hope of solving the problem. Studies have been carried out in various countries throughout the world and large numbers of publications have been contributed.
Three major symposia dealt with the world problems of large man-made lakes (Lowe-McConnell, 1966; Obeng, 1969; Ackermann et al., 1973). Fisheries aspects of especially large African tropical reservoirs have been widely studied both by national and international organizations. The first comprehensive summation of knowledge of tropical man-made lakes was presented in the SCOPE report (1972), and this report was also used, with only minor modifications, as a summary of and recommendations for the Knoxville Symposium (Ackermann et al., 1973). The new knowledge has been used for formation of guidelines for policy and planning, which are based on analysis of the environmental impact of large tropical man-made lakes (Freeman, 1974; Dasmann et al., 1974).
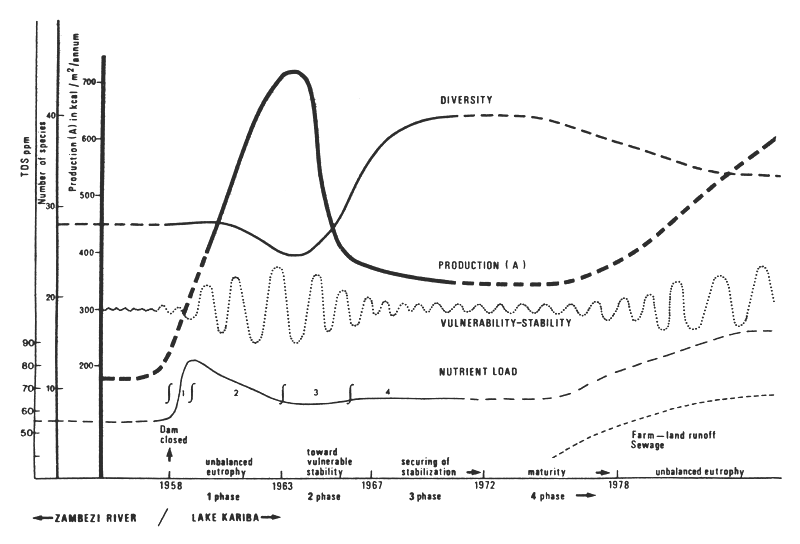
The fishery productivity of reservoirs typically rises rapidly to the maximum within the first few years of their existence (Balon and Coche, 1974) (Figure 3).
The increment is believed to be the result of better environmental conditions which favour the fishes. During the filling period of the reservoirs, the water leaches nutrients from newly inundated soils, submerged plant debris and other organic matter. Therefore, the impounded water is of high fertility, which encourages the growth of bacteria, phytoplankton, zooplankton and benthos. These organisms serve either directly or indirectly as food for fish; consequently, fish feeding on these organisms become more abundant as do also the predacious species which in turn feed on the small fish.
The production of fish in reservoirs usually increases over the pre-impoundment conditions. Pirozhnikov (1968) observed that production of fish in the main Dnieper reservoir in the USSR was nearly four times greater than the annual catches from the unregulated Dnieper. In the inundated section of the Barren River (USA) the fish stock had increased from an average of 125 kg/ha/year before the impoundment to 218 kg/ha by the first year of impoundment (Carter, 1969). The second and third years of impoundment had the standing stock averaging 225 and 270 kg/ha/year respectively. Turner (1971) reported that the total sport fishing harvest in the Rough River reservoir in Kentucky was higher than during the river condition. He estimated that the average yield of fish harvested increased from about 4 kg/ha before impoundment to 17 kg/ha in the first two years of impoundment.

Figure 1. Distribution of reservoirs in the world (from Fernando, 1980)

Figure 2. Distribution of reservoirs in Southeast Asia (from Fernando, in press)

Figure 3. Production and other dynamic variables of a man-made lake, based on Lake Kariba (from Balon and Coche, 1974)
Mabaye (1972) reported that fish production in Lake Kariba in Africa increased several-fold from pre-impoundment conditions, and fish landings increased from 454 t in the second year to 1 814 t in the fifth year of impoundment. Fish yield in the Nyumba Ya Mungu reservoir in Tanzania, reached its peak in the fifth year after the closure of the dam (Petr, 1975a) drastically decreasing afterwards.
In Southeast Asia and the Indian sub-continent, the yield of fish in reservoirs follows more or less the same pattern found in reservoirs elsewhere. Fish production in reservoirs in Thailand has greatly increased to much higher levels than found during river conditions previously (Sidthimunka, 1972). Bhukaswan and Pholprasith (1977) reported that fish production in the Ubolratana reservoir had increased from 474 t in the first year of impoundment to 2 100 t in the fourth year, and the maximum yield of 2 480 t occurred in the ninth year. The catch landing of the Bhumipol reservoir increased from 583 t in the second year to 1 089 t in the third year after the closure of Bhumipol Dam (Phanil, 1974).
Fish yield of Rihand reservoir in India reached its peak in the fourth year of impoundment (Jhingran, 1975). Annual fish landing from Gandhi Sagar reservoir (area 660 km2, maximum depth 50 m) also in India, reached its first peak in the fourth year but the maximum yield of 697 t of fish was obtained in the 13th year after the closure of the dam (Dubey and Chatterjee, 1977). The increment in fish catch in latter years was primarily due to the stocking programme, the application of fishing regulations, as well as increased fishing effort.
Sarnita (1977) reported that fish yields in reservoirs in Indonesia reached their peaks during the first several years of impoundment. He illustrated that the maximum fish yield in large and deep Indonesian reservoirs depended mainly on their locations. He pointed out that maximum catch was recorded in the fourth year after impoundment in Lake Jatiluhur (83 km2, maximum depth 90 m), the ninth year in Lake Darma (4 km2) and the twelfth year in Lake Rawa Pening (22 km2).
High fish production in reservoirs is usually not long sustained. It remains high only for one to several years, declining rapidly in ensuing years to a much lower level which may be maintained or may gradually rise to somewhere near half the magnitude of the initial phase (Kimsey, 1958; Balon and Coche, 1974). This phenomenon is usually typical of deep reservoirs with steep bottom slopes, such as the Nagarjunasagar reservoir in India, and Lake Kariba in Africa. The decline may not become a serious problem in large and shallow reservoirs, since fish production in this type of reservoir usually fluctuates near the magnitude of the initial high production, and in some years may increase to a new high level as found in the Ubolratana reservoir in Thailand and the Gandhi Sagar reservoir in India.
The decrease in fish production in reservoirs has been investigated and studied by scientists of many countries for decades, particularly in countries where reservoirs play a more important role in the national economic development. It is believed that fish production reflects the general fertility of reservoirs. This includes a number of processes:
The leaching of nutrients and other elements from the soil;
The decomposition of organic matter predominantly of plant origin flooded by rising water;
The loss of nutrients locked up in the bottom sediments;
Reduction in the bottom fauna due to rapid sedimentation.
A decline of fish yield in a reservoir is often followed by a recovery and stabilization at a new and lower level (Balon and Coche, 1974). This may occur whether any special management has been applied or not (Kimsey, 1958). The fish populations and their food organisms become naturally adjusted to the permanent basic fertility of the basin and additional nutrients from the inflows and watershed runoff. However, the productive capacity may be different for each reservoir and will fluctuate from year to year in the same reservoir, depending upon its water supply and the operations by other users.
The objectives of reservoir fishery management are to increase the yield and to maintain a steady-state harvest of fish at a level near the optimum productivity of the reservoir.
Management practices for smoothing fluctuations in fish populations and increasing yield generally fall into three categories. They are the manipulation of habitats; the regulation of fish populations and their food supply; and regulation and control of fisheries. To achieve the management goals it is necessary to know the changed patterns of fish populations in reservoirs such as the formation of fish population, fish population dynamics, the abundance of fish in the stocks and their biomass, and maximum yield which the reservoirs could sustain. This information is very important in planning a management programme for ensuring maximum production of fishes.