This section describes in detail the survey findings on household fish consumption.
A total of seventy eight households (23%) reported that they have eaten fresh fish. Most of these households said they ate fresh fish very rarely and were often unable to remember the last time they had done so.
The highest proportion of fresh fish eating households (FFE) households found in the sample was at Gampudi (Dam 2) which was probably because firstly, the Fisheries Unit had distributed freshly fried fish at this dam during World Food Day in 1986 and secondly because the sample size was small. At Gakgatla (Dam 4), the presence of 3 dams in the area as well as the small sample size may be a contributing factor to the relatively high proportion of FFE households.
The lowest percentage of FFE households were found at Molepolole (Thaone Dam) and Kanye (Mmakgodumo Dam), both main villages. This is probably because many households were sufficiently far away from the dam never to go there and also because current supply levels of fresh fish are so low that only a small number of households could be supplied with fish anyway. Table 11 shows the percentage of FFE households by each dam.
Table 12 Percentage of FFE Households by Dam
| Dam | Number of Households | % of total sampled households | 95 % Conf. Level | |
| 1. | Mmakgodumo | 21 | 21 % | 8 % |
| 2. | Gampudi | 6 | 67 % | 30 % |
| 3. | Letlhakane | 10 | 32 % | 16 % |
| 4. | Gakgatla | 6 | 40 % | 25 % |
| 5. | Moshupa | 14 | 19 % | 9 % |
| 6. | Semarule | 7 | 26 % | 17 % |
| 7. | Thaone | 14 | 16 % | 8 % |
| TOTAL | 78 | 23 % | 4 % |
The difference between the basic socio-economic characteristics of FFE households compared to the averages of the total sample appear insignificant as shown in Table 13, therefore making it both difficult and dangerous to make a socio-economic differentiation between households2.
Table 13 Summary of Socio-economic Characteristics of FFE Households Compared with FFE households
| Fresh Fish Households | All Households | |
| Household Types: | ||
Male-headed | 45 % | 38 % |
De facto female headed | 30 % | 30 % |
De jure female headed | 25 % | 32 % |
| Average Age of Household Head | 55.0 (14.6) | 53.5 (14.6) |
| Average Household Size | 8.0 (3.9) | 7.3 (3.6) |
| Adult/Child ratio | 1:0.8 | 1:0.8 |
Note: Standard Deviation in Brackets
The main sources of income for FFE households are wages (Republic of South Africa and Botswana), crop production and cattle, respectively. Secondary sources of cash come from remittances and crop production. These results reflect the results obtained for all households.
Distance between the household and the dam was also considered a possible factor in determining whether a household ate fresh fish. The results comparing non FFE households with FFE households do not confirm this supposition as Table 14 shows.
Table 14 Comparison of Average Household-Dam distance between FFE Households and non-FFE Households
| Dam | NON FFE HOUSEHOLDS | FFE HOUSEHOLDS | |
| 1. | Mmakgodumo | 3.7 | 3.6 |
| 2. | Gampudi | 1.4 | 1.2 |
| 3. | Letlhakane | 5.1 | 4.8 |
| 4. | Gakgatla | 5.7 | 7.8 |
| 5. | Moshupa | 2.0 | 1.7 |
| 6. | Semarule | 0.7 | 0.6 |
| 7. | Thaone | 2.3 | 2.3 |
Eighty per cent of FFE households said they could not remember when they had first eaten fresh fish, 6% had eaten it only during the last 5 years, 5% had eaten it for the first time longer than 5 years ago whilst 8% of households did not answer the question.
Surprisingly, 63% of respondents said they ate fresh fish for the first time at the survey site, indicating that fresh fish is familiar to households in the area. For the remaining households, 19% said they first ate fresh fish in South Africa, 11% said in Eastern Botswana and 6% in Northern Botswana.
In most households, practically everybody eats fish with the exception of usually one or two older members. The household members who eat fresh fish is given in Table 15:
Table 15: Household members who eat fresh fish
| Members | Responses | % |
| everybody except one/two | 36 | 46 % |
| everybody | 17 | 22 % |
| household head only | 13 | 16 % |
| others | 9 | 11 % |
| cattle herders | 3 | 5 % |
| TOTAL HOUSEHOLDS | 78 | 100 % |
Table 16 shows that the majority of households last ate fish a long time ago. Had the survey been carried out at another time of the year, the relative proportions of households who remember eating fish more than one month ago and those that have eaten fish during the last week would have been different. This is because the survey was carried out during the summer, when there is the greatest supply of fresh fish.
In fact, most households (57%) did report that fish was mainly eaten during the summer, results which correspond to the results obtained in Survey 2 on fishing activity.
Table 16: Last time fresh fish was eaten
| Members | Households | % |
| long time ago | 47 | 60 % |
| 1 week to 1 month ago | 10 | 13 % |
| less than 1 week ago | 7 | 9 % |
| more than 1 month ago | 6 | 8 % |
| no response | 8 | 10 % |
| TOTAL HOUSEHOLDS | 78 | 100 % |
The main reason why some households were unable to answer the question was because it was not relevant as the member(s) had only eaten fresh fish once, such as in a canteen in South Africa.
These responses should be compared with the frequency most households claim to eat fresh fish, shown in Figure 2 which further confirms the fact that fresh fish is eaten very rarely.
Figure 2: Frequency of Fresh Fish Consumption by Number of Households
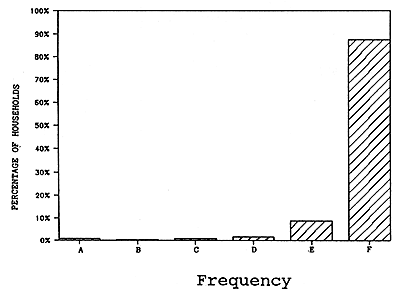
| A = more than once a week | B = once a week |
| C = 2 – 3 times a month | D = once a month |
| E = very rarely | F = never |
Table 17 shows that the main source of fresh fish for households is the fisherman himself, either because a member (or members) of the household catch fresh fish, or because the household buys fish direct from a fisherman. There were 26 people identified in the survey who were currently catching fish, for household consumption only, or, for a few, also to sell. They were found living at Kanye, Molepolole and Moshupa.
Twenty-two of these fishermen were males and 4 were females. The average age 18 years old (S.D = 8). The eldest was 48 and the youngest 9 years old. Twelve of them (48%) were at school or awaiting final year results, six (24%) were unemployed and three (12%) were herdboys. Three people were either engaged in crop production, salaried employment or self-employed. Only one person described his main economic activity as fishing. The proportion of young people in the sample may be a reflection of the population pyramid of Botswana where 50% of the total population are under 15 years old, and 20% fall between the ages of 15 and 24 years. However, this result may also have arisen because fishing is an activity usually undertaken by this age group. From the results and taking into account the small sample size, these households are characterized as being, on average, nearer the dam (an average 1.7 km compared to 3 km for all households), having a larger household (10.5 members compared to 8 for all households) and a greater percentage of male headed households (63% compared to 36%). The main source of income for these households were wages from absent members working in South Africa (37%) followed by salaried employment in main villages and towns in Botswana (21%). Generally speaking, it is likely that these households have higher mean annual incomes than average, and are therefore able to support bigger households and perhaps exert less pressure on each members' labour time.
Table 17: Sources of Fresh Fish
| Source | Responses | % |
| household members who catch | 19 | 24 % |
| bought from fishermen | 10 | 13 % |
| other sources | 9.5 | 13 % |
| given away by friends/neighbours | 6 | 8 % |
| bought from friends/neighbours | 4 | 5 % |
| too long ago | 4.5 | 6 % |
| bought from market | 2 | 2 % |
| bought from traders | 1 | 1 % |
| do not know/not applicable | 22 | 28 % |
| TOTAL NUMBER OF HOUSEHOLDS | 78 | 100 % |
The category ‘other sources’ includes the collection of fish when the dam overflows and distribution of cooked fish when it was World Food Day in 1986 at Gampudi Dam. The collection of fish when the dam floods is important because it indicates that people are willing to eat fresh fish, if it is available even if they do not know how to catch it.
The relatively large proportion of respondents who were unable to answer the question were those who had eaten fresh fish at canteens in South Africa or had eaten it only once and therefore did not consider the question as directly relevant.
The most common types of fish eaten are tilapia (bream) and catfish (barbel), with 41% of all households reporting that they ate these fish. These may be the most common types eaten because they are the only species available in the reservoirs and/or because they are the most frequently caught species. Of the respondents, 18% said they did not know the type of fish they ate, 7% said they ate ‘others’ and 4% said they ate silver barbel. 7% of households did not answer the question because it was too long ago to remember.
Of the 9 households which ate more than one type of fish, 38% preferred tilapia and 27% preferred catfish. The main reason for their stated preference was that they liked the taste (77%) whilst 16% said that it was easily available. Only 1 household said that the reason for their preference was because it was easy to cook.
Questions on the form that fresh fish arrives at the household and the usual time interval between obtaining the fish and cooking it, were intended to gather information on the level of preparation and cleaning that were practised before cooking. Approximately 40% of the respondents were unable to answer these questions either because they did not prepare the fish in the household or because fish has been eaten so rarely that the question was not really relevant.
However, of those households that answered, the results indicate (Table 18) that fish generally arrives at the household gutted and usually whole (i.e. not cut or split). Observation at dam sites, as well as answers in Survey 2 indicate that tilapia are gutted and scaled by fishermen at the dam, whilst catfish are just gutted.
Most households only wait a few hours before cooking the fish, those that wait longer than a day sun-dry the fish before consumption. This process is described in more detail in Section 5.1.12.
Table 18 Pre-cooking Preparation of Fresh Fish
| Arrives at household | % | Wait-time before cooking | % |
| gutted | 28 % | few hours | 41 % |
| whole | 21 % | up to 1 hour | 6 % |
| skinned | 5 % | few days | 5 % |
| cut in slices | 3 % | 1 day | 3 % |
| other | 5 % | other | 0 % |
| not applicable | 38 % | not applicable | 45 % |
| TOTAL | 100 % | TOTAL | 100 % |
Frying is the most common method of cooking fish (75% of all households) followed by boiling (12%). Other methods of cooking such as roasting and baking obtained negligible responses.
Of the respondents preparing fish in the household, 65% learnt from a friend, 4% learnt at school and 5% from a women's group. 26% of the respondents found the question not applicable as they ate fish outside the household, most often at a canteen in South Africa.
As Table 19 shows, the most common method in which households deal with any fresh fish surplus to their immediate needs, is to sun dry the fish. The fresh fish may arrive at the household already partially dried (and gutted) by the fishermen, or the fish may be dried before cooking once it has reached the household. 70% of sun-drying households reported that they usually dried the fish for only one day and 30% said they dried fish for 2 or 3 days. However, many of these households said that it was difficult to say how long they dried fish for, as it depended on when they wanted to eat the fish. Some respondents dried the fish to remove the smell of the fresh fish rather than for purely preservation purposes.
The reason why more than half the households who did not answer the question on utilization of surplus was either because the household never had a surplus or because fresh fish was eaten so rarely.
Table 19: Utilization of Surplus
| Utilization | Households | % |
| sun-dry | 19 | 24 % |
| give away to friends/neighbours | 6.5 | 8 % |
| throw away | 5 | 6 % |
| other | 2.5 | 3 % |
| store unprepared | 2 | 3 % |
| cook anyway | 2 | 3 % |
| not applicable/did not answer | 41 | 53 % |
| TOTAL | 78 | 100 % |
The most commonly stated reason (see Table 20) why households do not eat more fresh fish is because it is not available for sale. This is significant because it repudiates earlier hypotheses that Batswana in eastern Botswana are not interested in eating fish and indicates that there is a potential market for fish from the dams.
The second most commonly stated reason why households reported that they did not eat more fresh fish was because they did not know how to catch it. However, only 6 of these 13 households said they had someone interested in learning how to catch fish. The main reason given for not wanting to learn was that no one in the household had the time. This may be an indication that these households regard fish as a common property good such as other small animals which are hunted for food and are only caught when there is a need for animal protein or when there is time available.
Table 20 : Reasons why Households Do Not Eat More Fish
| Reasons | Households | % |
| not available for sale | 35 | 45 % |
| do not know how to catch fish | 12.5 | 16 % |
| afraid of water | 6.5 | 12 % |
| dam too far away | 5 | 6 % |
| nobody in household willing to catch | 5 | 6 % |
| do not know how to store | 2 | 3 % |
| fishing equipment not available | 2 | 3 % |
| do not like smell | 0.5 | 1 % |
| do not like appearance | 0.5 | 1 % |
| did not answer | 9 | 12 % |
| TOTAL | 78 | 100 % |
There were 265 households (77%) which reported that they do not eat fresh fish. The reasons are presented in Table 21. The results indicate that these households do not eat fresh fish since they simply “do not want to”, an expected answer for people that are not traditional eaters of fish.
Other reasons given for not eating fresh fish were because the smell and/or appearance was not liked. Many households that did not like the appearance of fish and compared it to a snake, even though they had not ever seen a fish. Their attitude may be partially due to hearsay and the existence of a children's song in Setswana which is titled “Tlhapi ke Noga” which means “fish is a water snake”.
Households also stated that they did not eat fish because they did not know how to catch it - although some of these people went on to say that they did not have the time to catch fish.
Table 21: Reasons for not eating fresh fish
| Reasons | Households | % of total |
| do not want to | 133 | 50 % |
| do not like smell | 36.5 | 14 % |
| do not know how to catch | 27.5 | 10 % |
| not available to buy | 23.5 | 9 % |
| do not like appearance | 23.5 | 9 % |
| do not know how to prepare | 8.5 | 3 % |
| too expensive | 1 | negligible |
| do not like taste | 1.5 | 1 % |
| other | 10 | 4 % |
| TOTAL HOUSEHOLDS | 265 | 100 % |
As stated in section 4.7, just over 80% (280) of all households reported that they ate fish of some kind. This includes households that eat fresh fish. This suggests that Batswana households in this area have no aversion to eating fish, as such, but may have preferences on the form fish is prepared dependent on both taste and availability.
Table 22 provides results on the number of households eating different types of fish.
Table 22 Consumption of Other Types of Fish
| Type | No. of Households | % of all households |
| Tinned | 279 | 81 % |
| Shop/Cafe Cooked | 44 | 13 % |
| Frozen | 5 | 1 % |
| None | 62 | 18 % |
Tinned fish is by far the most commonly eaten fish. The kind of tinned fish preferred by households are pilchards in chili sauce and, to a lesser extent, pilchards in tomato sauce. Most of these products are imported from South Africa.
Tinned fish is liked by most households mainly because they find it tasty (82% of households gave this reason) and secondly, because it is available everywhere. Only 2 households said that price or ease of storage were reasons why they liked tinned fish. However, the extensive availability of tinned fish is of course, related to its' ease of storage.
The consumption of shop/cafe cooked fish and frozen fish is very small, probably because the availability of these types of fish is extremely limited to main villages and urban areas in Botswana and South Africa. Sometimes, cooked fish is brought to the household as a special treat by a household member who lives in the town, thereby introducing the household to the product. Frozen fish, is obviously restricted to areas which have shops with freezers and to people that are familiar with the use of frozen food. The availability of these two products is discussed in more detail in Section 7.1.
The consumption frequency of tinned fish by household is given in Figure 3 and shows that most households eat tinned fish once a month. These figures suggest that tinned fish has become a familiar part of the Batswana diet in this area. As already stated, very few households ate other types of fish, of those that did the vast majority reported eating it very rarely.
Figure 3 Consumption Frequency of Tinned Fish
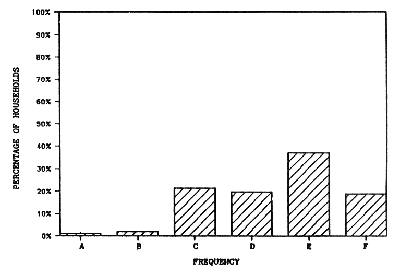
| A = more than once a week | B = once a week |
| C = 2 – 3 times a month | D = once a month |
| E = very rarely | F = never |
Tinned fish is given to weaning children in just over 70% of all households, because it is easily available and is eaten in the household anyway. Twenty-eight households which eat tinned fish do not give any kind of fish as weaning food. Only a very small number of households give weaning children other types of fish.
The age at which households first feed fish to children is shown in Table 23. The results correspond to current Ministry of Health advice to mothers which recommends weaning children from the age of 4 – 6 months.
Table 23 Age when Children start Eating Fish All types)
| Age | No. of Households | % |
| < 6 months | 101 | 40 % |
| 6 – 12 months | 82 | 32 % |
| 1 – 2 years | 41 | 16 % |
| over 2 years | 29 | 12 % |
| TOTAL | 253 | 100 % |
Approximately 60% of households reported that they did not know which types of fish were bad for children because they had not tasted other kinds. 22% of households regarded fresh fish as bad for children largely because it had too many bones or was simply not considered good for children. Although only a few households thought tinned fish was bad for children because the chili made it too spicy; discussions with respondents as well as key informants suggest that tinned fish in tomato sauce is fed to children as soon as they are weaned but tinned fish in chili sauce is usually fed to children from the age of two years onwards.
A comparison of the survey results on the consumption frequency of all types of fish relative to the consumption frequency of other sources of animal and vegetable protein (Figures 4 – 7) when compared to Figures 2 and 3 for fresh and tinned fish indicate the relative unimportance in the diet of fresh fish and, to a lesser extent, tinned fish. Consumption of beef peaks at two points, approximately 35% of all households reporting that they eat it more than once a week, and approximately 30% of all households reporting that they eat it “very rarely”. This probably reflects the different income levels of households covered in the survey. Beans consumed by the majority of households either once a week or two to three times a month. Most households reported eating goat “very rarely”.
As Batswana are traditionally beef eaters, the results from the survey simply confirm this and suggest that when meat is either not affordable or available, beans or chicken are eaten. In terms of the introduction of fresh fish in these areas, the frequency of the consumption of tinned fish could serve as an indicator of the likely consumption patterns for fresh fish, should it become available in larger quantities. It is unlikely that fish could act as a substitute for beef, chicken or goat and should therefore be regarded as an additional source of protein rather than a replacement to these sources, provided the price was lower than beef, chicken or goat.
Figure 4 Frequency of Consumption of Chicken
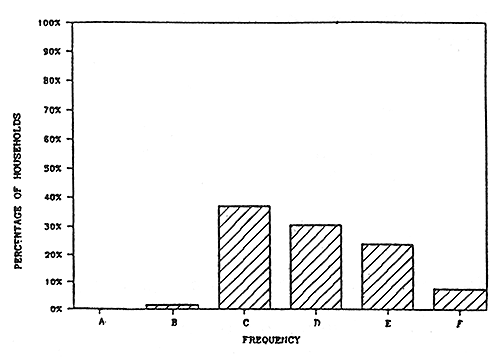
| A = more than once a week | D = once a month |
| B = once a week | E = very rarely |
| C = 2 – 3 times a month | F = never |
Figure 5 Frequency of Consumption of Beef
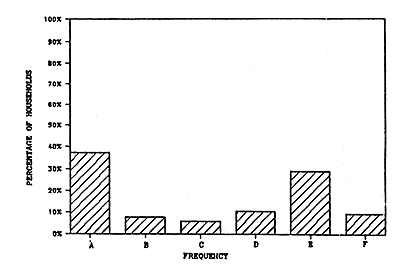
Figure 6 Frequency of Consumption of Goat
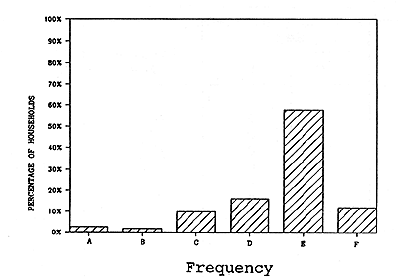
Figure 7 Frequency of Consumption of Beans
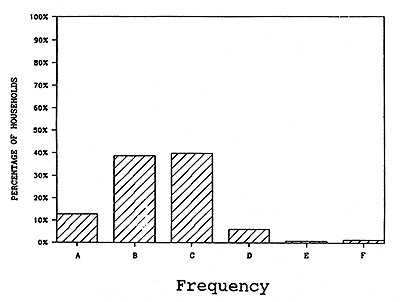
| A = more than once a week | D = once a month |
| B = once a week | E = very rarely |
| C = 2 – 3 times a month | F = never |
A total of 77 people were identified in 51 households who said that they would like to learn how to catch fresh fish. Of these people, 21 were already catching fish. Table 24 sets out the average age of these people, and their gender. Approximately 20% of the total number of persons interested were female. The average ages for this group were low, as most were teenagers and youths with approximately 40% either at school or awaiting their final year exam results. Just under 30% were unemployed whilst 14% were people already engaged in salaried employment The remaining people were engaged in other economic activities including occasional work and crop production.
Table 24 Numbers of Persons Interested in Catching Fish
| Dam | Sex | Average Age | Standard Deviation | ||
| M | F | ||||
| 1. | Mmakgodumo | 20 | 6 | 20.1 | 9.0 |
| 2. | Gampudi | 1 | 0 | 27 | 0 |
| 3. | Letlhakane | 10 | 0 | 17.8 | 9.0 |
| 4. | Gakgatla | 6 | 0 | 20.2 | 10.0 |
| 5. | Moshupa | 8 | 6 | 24.2 | 12.4 |
| 6. | Semarule | 6 | 0 | 14.1 | 2.7 |
| 7. | Thaone | 10 | 4 | 25 | 12.9 |
| TOTAL | 61 | 16 | 21.1 | 9.83 | |
The main reason for wanting to learn how to catch fish was for sale (65%) and the second reason was for home consumption (35%). Often both reasons were given.
It should be pointed out that the numbers of people interested in learning how to catch fish may be underestimated as often the survey respondent was answering on behalf of the whole household, with many members absent at the time of the interview.
The survey recorded a total of 63 (18%) households which stated that they did not eat fish of any kind. The breakdown of these households is given in Table 25 and shows that, with the exception of Semarule, the number of households that do not eat fish of any type does not exceed 20% of the total number of sampled households in each area. The proportion of non-fish eating households in terms of the total sample, is therefore quite small.
Although the questionnaire did not include questions on why households did not eat fish other than fresh, the main reasons why these households did not eat fresh fish were that they did not want to (54%) or that they did not like the appearance (34%).
Table 25 Households that do not eat fish
| Dam | Number of Non-Fish Eating Households | % of Total Total Sampled Households | |
| 1. | Mmakgodumo | 18 | 18 % |
| 2. | Gampudi | 1 | 11 % |
| 3. | Letlhakane | 5 | 16 % |
| 4. | Gakgatla | 0 | 0 % |
| 5. | Moshupa | 15 | 21 % |
| 6. | Semarule | 9 | 33 % |
| 7. | Thaone | 15 | 17 % |
| TOTAL | 63 | 18 % | |
Table 26 presents a comparison of these households with households that eat fish. There do not appear to be any significant differences between households.3
Table 26 Fish-eating Households Compared to Non Fish-eating Households
| Fish Eating Households | Non-fish Eating Households | |
| Number of Households: | 280 (82%) | 63 (18%) |
| Distance from dam | ||
Mean: | 3.0 (2.0) | 2.6 (1.5) |
| Age of Household Head: | ||
Mean | 52.4 (14.5) | 60.1 (13.3) |
| Household Heads: | ||
Male-headed | 38 % | 47 % |
De jure female headed | 31 % | 34 % |
De facto female headed | 31 % | 19 % |
| Household Size: | ||
Mean | 7.9 (3.4) | 6.8 (4.0) |
Note: Standard deviations in brackets ( ).
The survey covered two groups of people, the Bangwaketse (Southern District) and the Bakwena people (Kweneng District). All surveyed households with the exception of one, reported that there were no cultural taboos or beliefs that prevented them from eating fish of any kind. At Moshupa, one household said that as the crocodile is the totem of the Bangwaketse, they are not able to eat fish as this is associated with the crocodile. It would therefore be reasonable to conclude that there are no commonly known cultural taboos associated with eating fish.