![]()
![]()
![]()
This section presents the results of Survey 2 concerning the present level of fishing activity around dams.
In total, 37 fishermen were interviewed. No fishermen were identified or available for interview at Gampudi (Dam 2) and Gakgatla (Dam 4). Although the majority of interviews were held at the dam site, 9 people were interviewed from the sample households of Survey 1 whilst 7 other respondents were identified as leisure fishermen4 and with the exception of one person, were interviewed away from the dam.. The number of people interviewed by dam is given in Table 27.
Table 27: Number of interviews by Dam
| Dam | Number of Interviews | % of Total | |
| 1. | Mmakgodumo | 16 | 43% |
| 2. | Gampudi | 0 | 0% |
| 3. | Letlhakane | 1 | 3% |
| 4. | Gakgatla | 0 | 0% |
| 5. | Moshupa | 7 | 19% |
| 6. | Semarule | 11 | 30% |
| 7. | Thaone | 2 | 5% |
| TOTAL | 37 | 100% |
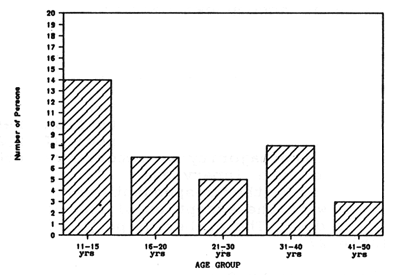
Just under 40% of respondents were between 16 and 20 years of age. The age structure of the respondents is shown in Figure 8. This may reflect the general population pyramid for Botswana, where an estimated 60% of the total population are below 24 years of age, or as stated earlier, it may reflect the fact that fishing is an activity mainly carried out by young people. Only two respondents were female, one of whom was between 11 and 15 years of age (at school) and the other between 21 and 30 years old (unemployed).
Figure 8 Age structure of Sample Survey of Fishermen
The results regarding economic activity are shown in Table 28 and are not surprising, given the proportion of young people in the sample.
Table 28: Economic Activity of Fishermen
| Economic Activity | Number of Respondents | % of Total Sample |
| unemployed | 9 | 24 % |
| at school/awaiting results | 8 | 22 % |
| crop production | 7 | 19 % |
| self-employed:registered business | 6 | 16 % |
| formal employment | 6 | 16 % |
| fishermen | 1 | 3 % |
| TOTAL | 37 | 100 % |
It is important to point out the relatively high proportion of people that were unemployed; most of whom were young men or youths. The results tend to support the hypothesis that the majority of Batswana that fish are young who are either at school or are looking for work. Only one youth stated that his main economic activity was fishing (the person identified in Survey 1).
With the exception of one Batswana man who had formal salaried employment, all leisure fishermen (16% of the total sample) were self-employed. Although these respondents were all male, they did report their families went fishing as well. Five of the respondents were between 31 and 40 years old, and 2 were between 41 and 50 years old. None of the respondents originated from eastern or southern Botswana which is significant in terms of the fact that all originate from countries where fish is more common in the diet (eg, South Korea, India). In the case of the Batswana leisure fishermen, he originated from northern Botswana where fish is also part of the usual diet.
The majority of respondents (80%) went to the dam solely to fish whilst the remaining 20% went to the dam to water cattle (at Mmakgodumo and Semarule Dams only) and fished as a secondary activity.
Twenty-nine (77%) of the respondents walked to the dam whilst the remaining 8 (23%) respondents used their own vehicle. The time taken to reach the dam obviously depended on the mode of transport, the condition of the route and the distance travelled, but the results indicate that, whatever the mode of transport, for 46% of the respondents it took less than 30 minutes, for 35% it took 30 minutes to 1 hour, and for the remainder (19%) it took 1 to 2 hours. No respondent said they travelled more than 2 hours to reach the dam.
No respondent said they required permission to fish, although some leisure fishermen indicated that in the past, local authorities at Kanye had once initiated a daily fee. The dam group chairman at Semarule expressed a wish to control the activities of leisure fishermen at weekends because they left too much litter, but currently no permission to fish was required.
All respondents said that they fished in summer, a result which corresponds well with results from Questionnaire l, as most households stated that fresh fish is mainly eaten in summer. Only 2 leisure fishermen said that they fished in autumn.
Taking into account that most fishing only takes place during the summer months as well as the fact that the survey was carried out during the summer, Figure 9 shows the frequency of fishing activity of the respondents and Figure 10 shows the last time respondents went fishing.
Figure 9 Frequency of Fishing Activity
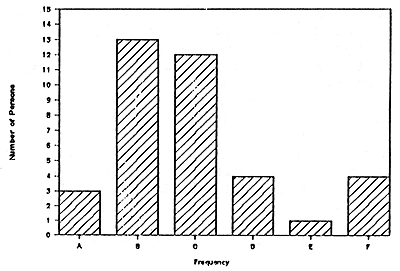
| A = every day | B = few times a week |
| C = once a week | D = 2–3 times a month |
| E = once a month | F = very rarely |
Figure 10 Last time respondents went fishing
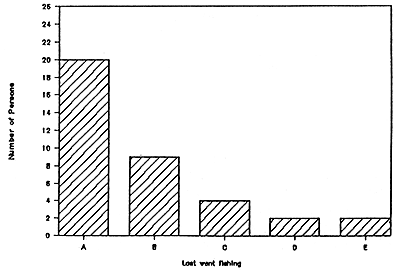
| A = this week | B = during last month |
| C = one month ago | D = during last year |
| E = long time ago |
Asked about the days they usually fished, 40% of the respondents stated that they went fishing only during weekends and holidays, 35% said they went fishing on no particular day, and 19% said they went fishing on weekdays only.
Although some respondents may fish all day, the survey revealed that the most popular time to go fishing is in the morning with 78% of all respondents saying they fished in the morning. 32% said they also (or only) fished in the afternoon, and 8% said they also fished in the evening. 16% of the respondents said there was no particular time that they fished.
Hook and line is the most common fishing method used, as shown in Table 29. The reasons for the popularity of this method are availability and expense. Fishing line, as well as hooks of some sizes are available at general stores in the main villages of Kanye, Moshupa and Molepolole. Traps, made of chicken wire, have been seen in use at Thaone and Mmakgodumo Dam, although only one respondent stated that they used a trap.
Table 29: Fishing Gear Used
| Fishing Gear | Number of Respondents | % of total |
| hook and line (no rod) | 26 | 70 % |
| rod and reel | 10 | 27 % |
| traps | 1 | 3 % |
| TOTAL | 37 | 100 % |
Although no respondents were using nets, informants have indicated that they are occasionally used at Semarule Dam by someone from Molepolole. No one was seen fishing with a net during four separate visits to the dam. At the same dam, some leisure fishermen also mentioned that there were men that set lines very early in the morning or in the evening and collected them 12 hours later. None of these fishermen were found during the field visits.
When asked about where they learnt how to fish, the respondents gave the following answers (Table 30) :
Table 30: From whom fishing was learnt
| Learnt fishing from: | Number of Respondents | % of total |
| from others living in area | 15 | 41 % |
| from family members | 10 | 27 % |
| taught myself | 7 | 19 % |
| watching leisure fishermen | 4 | 11 % |
| did not answer | 1 | 3 % |
| TOTAL | 37 | 100 % |
The most common species of fish caught was tilapia (bream) -78% of respondents said that they caught tilapia. Catfish (barbel) was the next most commonly caught species (22% of respondents) except at Mmakgodumo Dam (Number 1) which according to respondents, does not have any catfish. The two respondents who fish at Thaone dam reported only catching catfish, although Fisheries Unit and other informants indicate that tilapia is present in the dam. A very small number (3) of respondents at Moshupa, Semarule and Thaone reported catching silver barbel. Other species of fish which are caught but are thrown back or discarded are very small sardine-like fish and occasionally, eels.
Although most respondents usually catch tilapia only, of those that do catch other types of fish, tilapia was still the preferred species because people liked the taste. Tilapia caught at Semarule Dam are considered, by leisure fishermen who have fished elsewhere, to have the best taste of all tilapia found in dams in Eastern and Southern Botswana.
Results on the number of fish caught the last time the respondent went fishing indicate an overall mean of 7 fish, with a large standard deviation of 8 fish (as one person had caught nothing). However, these figures are more useful when broken down by dam, as shown in Table 31:
Table 31: Average Size of Last Catch by Dam
| Dam | NON FFE HOUSEHOLDS | FFE HOUSEHOLDS | |
| 1. | Mmakgodumo | 10 | 10 |
| 2. | Moshupa | 4 | 4 |
| 3. | Semarule | 7 | 3 |
| 7 | 8 |
Note: Letlhakane and Thaone Dam were omitted as sample was too small, 1 respondent (who caught nothing) and 2 respondents (who caught one fish each) respectively.
Asked whether they considered this last catch to be good, average or bad, respondents give the answers presented in Table 32.
Table 32: Opinion of Last Catch
| Dam | Good | Average | Bad | |
| 1. | Mmakgodumo | 19 % | 12 % | 69 % |
| 5. | Moshupa | 29 % | 71 % | - |
| 6. | Semarule | 20 % | 40 % | 40 % |
| TOTAL | 19 % | 32 % | 46 % | |
Although figures can only serve as an indicator for the size of fish in the dam, respondents were also asked about the largest and smallest size of the fish caught when they last went fishing. The results show that captured tilapia at Mmakgodumo Dam vary between 6 – 10 cm in size, whilst tilapia at Semarule range between 11 and 20 cm. Catfish which are caught at all dams range between 21 and 50 cm. Apart from throwing back the small sardine-type fish, only leisure fishermen return under-sized fish to the dam at Semarule Dam.
Questions regarding the treatment of fish which had just been caught, together with observations made at the dam sites revealed that respondents tend to leave the fish alive in water either in a sack or other container, or attached to a stick by its gills (dead), until they are ready to return to their household. At this stage, the fish is gutted and descaled (tilapia only). 35% of respondents indicated they dried their fish in the sun after cleaning and splitting the body open, either as soon as the fish had been caught or once they had returned to their household. As drying meat is a common method of preservation in Botswana, it is likely that the process would be considered applicable to fish as well.
All respondents reported that they ate the fish they caught, whilst 65% of respondents said they ate the fish together with other members of their household, and/or friends or neighbours (24%). It appears that most respondents tend to fish for home consumption.
Cooking of the fish is usually undertaken by the respondent (58%) or if married, their spouse (19%). A small percentage of respondents said that fish was cooked by their mother (8%) or by another relative, such as a sister, brother or grandmother (12%).
78% of respondents said that fish was eaten fried and 14% said that it was eaten boiled. Nobody reported that fish was roasted.
The results indicate that most people were currently fishing for home consumption. 54% of the respondents said that they kept all their catch for home consumption, and ten respondents said that they sold fish, none of these were leisure fishermen. Six of the fishermen who sold fish, caught fish at Dam 1 and three were fishing at Dam 6. The amount of catch which is usually sold is around 25% of their total catch, as most of the catch is for home consumption. Only 3 respondents, (all leisure fishermen) said that they gave away between 25% and 75% of their catch. Two of these fish at Semarule and say they mostly give away catfish and small tilapia, usually to small boys who are watching them fish.
Fish are sold either by taking them to customers homes, from the home of the fishermen, along the road, or at the dam site. Fishermen at Mmakgodumo stated that they commonly sell fish from their homes in Kanye, whilst fishermen at Semarule usually sell at the dam site. This is probably because households at Semarule are scattered whilst at Kanye they are relatively close. The two main groups of customer are general customers (ie. not relatives or friends) at Mmakgodumo and leisure fishermen (who have not caught any fish or the right size of fish) at Semarule. At all places, fish are sold according to size, and prices in all areas seem fairly consistent as shown in Table 33.
Table 33: Average Prices of Fish by Size
| Size Category | Definition | Tilapia Pula/each |
| Small | < 10 cm | 0.10 – 0.25 |
| Medium | 10 – 20 cm | 0.50 - 0.25 |
| Large | > 20 cm | 1.50 |
| Catfish Pula/each | ||
| Small | < 20 cm | 0.50 |
| Medium | 20 – 30 cm | 1.00 |
| Large | > 30 cm | 2.00 |
Respondents were asked to estimate the numbers and types of people fishing at the dam in order to obtain a very rough estimate of the level of fishing effort. These estimates were averaged for each dam and the results are shown in Table 34. Answers varied widely, the figures do suggest the relative importance of leisure fishermen (foreigners) compared to any other group. Leisure fishermen who were interviewed observed that over the last few years there has been an increasing level of interest shown by people living around the dam as well as an increasing number of Batswana who have taken up leisure fishing.
Table 34: Average Number of Persons Fishing at Each Dam
| Boys | Local People | Foreigners | ||
| 1. | Mmakgodumo | 28 (11) | 22 (10) | 35 ( 4) |
| 3. | Letlhakane | - | - | 4 ( 0) |
| 5. | Moshupa | 11 ( 1) | - | 13 (10) |
| 6. | Semarule | 17 ( 4) | 11 ( 7) | 23 ( 8) |
| 7. | Thaone | - | 13 ( 0) | 13 ( 0) |
Note: Figures in brackets = Standard Deviation
All leisure fishermen reported that they fish at other dams in the area, mainly at Gaborone, Mmakgodumo and Moshupa Dams. All respondents, except leisure fishermen, fished in the dams closest to their households; some also fished in the rivers.
In response to the question as to whether they would like to catch more fish and for what reason, most respondents expressed the wish to increase catch mainly for home consumption and secondly for sale. Those respondents that did not wish to increase their catch were all leisure fishermen who were already satisfied with their catch. Table 35 shows the results by dam.
Table 35: Interest in Increasing Catches and Reasons Why
| Dam | YES Consumption | Sale | NO | |
| 1. | Mmakgodumo | 27 % | 19 % | 3 % |
| 3. | Letlhakane | 3 % | 0 % | - |
| 5. | Moshupa | 16 % | 3 % | - |
| 6. | Semarule | 14 % | 11 % | 8 % |
| 7. | Thaone | 5 % | 5 % | - |
| TOTAL | 65 % | 38 % | 11 % |
![]()
![]()
![]()