![]()
![]()
![]()
Figures on the quantities of tinned and frozen fish purchased by trader by place of final sale are not available. However discussions with traders in Kanye and Molepolole confirm the results of Survey 1 on tinned fish consumption, as sales of tinned fish are regular but quantities bought are relatively small.
Wholesalers in Gaborone, confirmed that tinned pilchards in chili sauce are the most popular fish product currently purchased in Botswana. Tinned pilchards in tomato are the next most popular product. They also pointed out that Batswana are very brand-loyal and the best selling brand is Lucky Star which is imported from South Africa. Traders prefer to buy tinned fish in shrink wrap packs containing 48 or 24 tins of 155 grammes each. Larger sizes of tins are not as popular mainly because they are expensive and therefore difficult to sell.
Recent trends in the sale of tinned fish indicate that sales in Botswana are tailing off. There are two main reasons for this. Firstly, the supply of tinned fish from South Africa is becoming more unreliable and secondly, prices are increasing. Both are the result of a lack of raw material for canning in the South African canneries coupled with their need to import more expensive frozen pilchards to supply their canneries.
Frozen fish is eaten by a very small proportion of the population and turnover at most wholesalers is low largely because the fish are available only in large packs. However, the large chain supermarkets (OK, Spar) do stock one kilo packets of ‘redfish’ which they say sells fairly well. They think the main problem is that customers do not know how to cook the fish, and are thus reluctant to buy it.
According to suppliers, demand for frozen hake portions imported from South Africa and sold to take-away restaurants and cafes has increased over the last few years. For example, one cafe in Kanye orders 40 kilos/week, or 2 tonnes a year.
Demand for other frozen sea fish from South Africa mainly comes from the hotel and restaurant sector catering to European tastes and is too expensive for most Batswana.
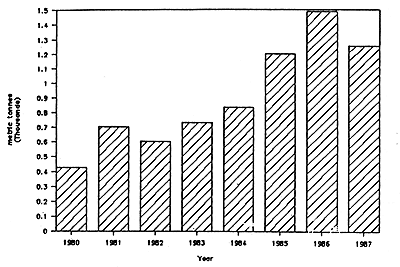
Import data for the years 1980 to 1987 (Figures 11 and 12) show an increase in imports of all categories of both fresh, chilled and frozen fish and for prepared fish in air tight containers (including tinned). Figures are not available for the years 1988 – 89, but the 1987 figure on tinned fish imports shows that imports have started to fall which, if wholesalers' predictions are correct, will also be reflected in the results for the subsequent years, when they are available.
Figure 11: Imports of fresh, chilled and frozen fish into Botswana 1980–87 (metric tonnes)
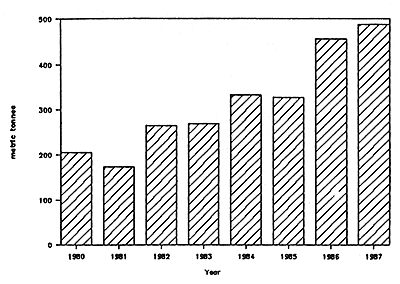
Figure 12: Imports of preserved fish in airtight containers (including tinned fish) into Botswana (thousand metric tonnes)
Results taken from the HIES on fish consumption (Table 36) show that during 1985/86, the national per capita expenditure on all fish products as a percentage of total expenditure on all food items was less than 1% and was lowest in rural areas. Figures by district are not available. In terms of 1985 retail prices, expenditure on fish in the HIES was roughly equivalent to two small (155g) tin of pilchards in chili sauce once a month for urban households, and once every 3 months for rural households. However, because results from earlier household income and expenditure surveys are not available, it is not possible to draw any conclusions as to whether fish consumption has increased over the last 10 – 15 years.
Appendix 3 provides more detailed figures taken from the HIES by average income group, showing that expenditure on fish as a percentage of total food expenditure remains fairly constant for income levels up to 1000 Pula/month indicating that fish (tinned fish most probably) for most households is considered neither a luxury good nor low-income good, but a food item that most households are willing to eat occasionally.
Table 36 Monthly Expenditure by all Households (Pula) on Fish
| Households | Fish | Total Food | Fish as a % of Total Food |
Urban | 0.9 | 81.29 | 0.1 % |
Rural | 0.2 | 37.64 | 0.05 % |
National | 0.39 | 49.20 | 0.08 % |
Source: Household Income and Expenditure Survey 1985/86
![]()
![]()
![]()