Ruvuma region is located in the southwestern part of Tanzania between latitude 9–12 degrees and longitudes 34–39 degrees (Van Enckevort et al., 1992). It is the sixth largest region of Tanzania and covers an area of 63,498 km2 of which about 5% is cultivated. Population density was 12 inhabitants per sq. km in 1988, which is lower than the national average of 26 inhabitants per km2 (Population Census, 1988). The region is composed of four districts: Songea urban, Songea rural, Mbinga and Tunduru, Songea town, the capital, is located in Songea urban district.
Agriculture accounts for the major part of the region's economy, providing over 90% of regional production and employment. Agriculture is predominantly carried out by small holders, cultivating about 2–5 acres. According to Van Enckwort et al. (1992), the region can be divided into five agro-ecological zones (refer Annex V for typologies of zones). Maize is by far the most important food and cash crop. During the 1991/92 season, over 20,000 tonnes of maize were exported from the region. Using the price of Ruvuma Cooperative Union, Tsh 30/kg, maize exports account for Tsh 625 million. In addition, a considerable amount of maize is transported to other regions through private traders. Dominant cash crops include coffee, tobacco and cashew nuts. In terms of value, coffee was the most dominant cash crop fetching a value of Tsh. 1,191 million, followed by tobacco (Tsh 338 million) and cashew nuts (Tsh 148 million) during the 1991/92 season.
Ruvuma is supplied with fish mainly from Lake Nyasa, situated in the south west of the region. Over 90% of fish production from Lake Nyasa, which is 20,000 to 30,000 mt of fish, are landed in Ruvuma region (Fishery Division, 1990). In addition to this fish from Lake Nyasa, about 100 mt of processed fish are imported to the region mainly from Mtera Dam and Lake Tanganyika. During the past years, fish landings from Lake Nyasa and fish supply from Mtera Dam have been declining. Consequently, per caput fish supply in the region has dropped from 38 kg in 1986 to 29.8 kg in 1990.
Fish farming started in the 1960s when Government-owned aquaculture stations were constructed in each district. In the 1980s, several donors supported aquaculture extension in the region. US Peace Corps Volunteers (PCVs) were active in the region from the early 1980s to 1991. PCVs were stationed for two to three years in villages and worked closely with fisheries officers and key farmers. Motor cycles were used for visiting villages and for transporting fingerlings. Some ponds were constructed by PCVs in order to keep fingerlings. Some key farmers were taught to reproduce fingerlings and to distribute them to neighbours.
In Mputa-Kitanda village of Numtumbo Ward, Songea rural district, a fish farming committee was organized under a wildlife reserve project along the river. The project included prohibition of fishing in the river. Fish farming was introduced to provide alternative sources of income and food production for villagers who traditionally fished in the river. The project has been supported by GTZ since 1987. Fingerlings were first brought from government ponds in Songea urban district. A USAID funded project “Training for Rural Development” was implemented in Magagua ward of Songea urban district between 1978 and 1985. The project had a multi-ministerial set up involving Ministries of Agriculture, Fisheries Division, and Ministry of Community Development (which was the leading agency, then under the Prime Minister's office). The project adopted a multi-sectoral approach which
There are some 70 fisheries officers in Ruvuma region. About 30 of them are focusing their activities on aquaculture extension. About 20 staff are stationed at the village level and are in day-to-day contact with fish farmers. In Songea rural district, one officer tends to cover a wide geographical area with a lot of farmers. In Tunduru, fisheries officers are stationed near to the district centre. Standard technical advice which the fisheries staff has been disseminating is summarized below. These standards were discussed during the regional annual conference organized by the Regional Fisheries Office. The fishery officers visit individual farmers or sometimes organize group meetings. They travel on foot and the frequency of visit to the farmers varies from once a week to once a month. Illustrated extension manuals were produced in Swahili during the 1980s by US PCVs but none of the officers have a copy.
According to the pilot survey results, the total number of FFUs in Ruvuma region as of August 1992 is estimated at 2,500, of which 2,050 are active FFUs3. The number of active FFUs in Songea rural and Songea urban districts is higher than in 1990/91, while in Tunduru and Mbinga the number of active FFUs has declined. Reasons for the decline: inaccessibility to fingerlings, poaching, damage by otters. Several ponds have lain idle because there were no fingerlings for restocking.
Table 3: Fish farming standards in Ruvuma region
| POND | |
| CONSTRUCTION | |
| Size | 20m × 15m (300m3 for family pond, 0.5 acres (2 000 m2) for institutional ponds |
| Number of ponds | In view of profitability, availability of feeding materials and time, it is advisable to own several small ponds rather than one big pond |
| POND MANAGEMENT | |
| Stocking | 2 fingerlings per m2 |
| Fertilizer | 4 * 20 litres animal manure (preferably cow dung) per pond |
| Feeding | once a day, maize bran, green leaves, termites |
| Harvesting | Intermittent harvest commences 3 months from stocking, batch harvest after 12 months from stocking, complete drainage of water and drying pond |
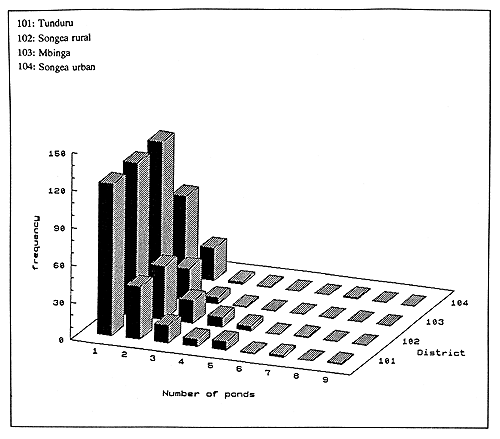
The mean number of ponds per FFU in Ruvuma region is one. In Mbinga, 80% of FFUs (124 out of 155) interviewed own only one pond. (Figure 1)
Table 4: Number of fish farming units in Ruvuma region
| Songea rural | Songea urban | Tunduru | Mbinga | Ruvuma total | |
| Fish Farming Units (1990)1 | 705 | 110 | 741 | 627 | 2183 |
| Fish Farming Units (1992) | 877 | 119 | 893 | 651 | 2539 |
| Active Fish Farming Units (1992)2 | 723 | 115 | 688 | 516 | 2042 |
2 Based on pilot survey estimates
Figure 1: Number of ponds per FFU

85% of FFUs are owned by household members. About 11% of FFUs conduct day to day management of ponds using hired workers. Less than 5% of FFUs belong to institutions such as schools, prisons, groups of youth or women. (Table 5)
Table 5: Types of pond ownership
| District | Family owned | School | Privately owned & managed by workers | Institutional | Total | ||||
| N | % | N | % | N | % | N | % | N | |
| Songea urban | 90 | 94.7% | 0 | 0.0% | 5 | 5.3% | 0 | 0.0% | 95 |
| Songea rural | 177 | 89.4% | 4 | 2.0% | 12 | 6.1% | 5 | 2.5% | 198 |
| Mbinga | 136 | 87.7% | 0 | 0.0% | 15 | 9.7% | 4 | 2.6% | 155 |
| Tunduru | 147 | 75.4% | 2 | 1.0% | 39 | 20.0% | 7 | 3.6% | 195 |
| Ruvuma total | 550 | 85.5% | 6 | 0.9% | 71 | 11.0% | 16 | 2.5% | 643 |
Almost all family-based FFUs are owned by males, often the household heads. There are few women who own their own ponds. Most of these women are either widowed, divorced or married women without children. Those women are generally have less burdened by household chores and are able to allocate their time and labour on fish farming. More details on women's perspective on fish farming are given in Chapter 5.
| District | Male | Female | Total | ||
| No. | % | No. | % | No. | |
| Songea urban | 91 | 95.8% | 4 | 4.2% | 95 |
| Songea rural | 190 | 97.9% | 4 | 2.1% | 194 |
| Mbinga | 148 | 98.7% | 2 | 1.3% | 150 |
| Tunduru | 188 | 98.9% | 2 | 1.1% | 190 |
| Ruvuma total | 617 | 98.1% | 12 | 1.9% | 629 |
Over 80% of the pond owners are primarily engaged in agriculture and consider fish farming as a secondary activity. There are quite a few government employees who own ponds. In these cases, pond management is often done by hired labourers.
Table 7: Main occupation of pond owners
| District | Agri-culture | Fish farming | Livestock | Trading | Hired labour | Employee | Others | Total | |||||||
| N | % | N | % | N | % | N | % | N | % | N | % | N | % | N | |
| Songea urban | 66 | 69% | 0 | 0% | 0 | 0% | 7 | 7% | 0 | 0% | 21 | 22% | 1 | 1% | 95 |
| Songea rural | 166 | 84% | 0 | 0% | 0 | 0% | 1 | 1% | 0 | 0% | 19 | 10% | 9 | 5% | 198 |
| Mbinga | 145 | 94% | 0 | 0% | 0 | 0% | 0 | 0% | 0 | 0% | 6 | 4% | 4 | 3% | 155 |
| Tunduru | 152 | 78% | 1 | 1% | 0 | 0% | 0 | 0% | 1 | 1% | 28 | 14% | 8 | 4% | 195 |
| Ruvuma total | 529 | 82% | 1 | 0% | 0 | 0% | 8 | 1% | 1 | 0% | 74 | 12% | 22 | 3% | 643 |
According to the survey, the number of ponds in the region is estimated to be about 3,700, of which about 3,000 are under operation. The proportion of non operating ponds is particularly high in Tunduru, at about 30% (Table 8).
| District | Survey observations | Regional estimate1 | ||
| Operational ponds | Non-operational ponds | Operational ponds | Non-operational ponds | |
| Songea urban | 125 | 7 | 184 | 10 |
| Songea rural | 323 | 42 | 1012 | 132 |
| Mbinga | 191 | 81 | 619 | 263 |
| Tunduru | 335 | 87 | 1170 | 304 |
| Ruvuma total | 974 | 217 | 2985 | 708 |
1 Based on the survey estimate
Average pond size is 279 m2, slightly below the standard size, 300 m2, recommended by the fisheries staff in the region. The average pond size is larger in Songea urban and Songea rural which are endowed with a lot of land suitable for pond construction. In Mbinga, where there is a shortage of arable land, the average pond size is fairly small at 129 m2 and 55% of ponds are under 100 m2 (Table 9).
Table 9: Number and average size of fish ponds
| District | Average size of ponds (m2) | Average area per FFU (m2) | Minimum Depth (cm) | Maximum Depth (cm) |
| Songea urban | 452 | 630 | 42 | 81 |
| Songea rural | 370 | 603 | 48 | 87 |
| Mbinga | 129 | 161 | 63 | 104 |
| Tunduru | 213 | 366 | 48 | 81 |
| Ruvuma total | 279 | 429 | 51 | 88 |
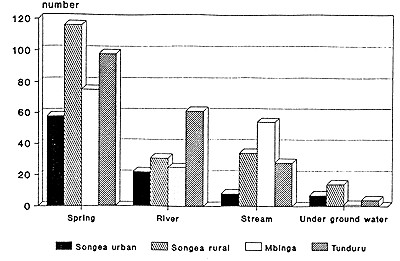
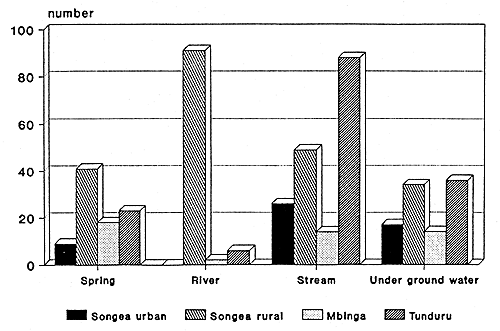
The majority of FFUs obtain water from springs. In addition, it is common to have water from ground water and streams. Often vegetables and beans are cultivated alongside the ponds making use of available water. (Figure 2, and tables 5.1 and 5.2 in the Annex V). Generally speaking, water is not a major limiting factor for expansion of aquaculture in the region. Multiple sources ensure sufficient water supplies for pond operation. Currently a regulation to restrict activities within the proximity of the water sources are being discussed and it is not clear to what extent fish farming operation will be affected. In some areas (ie. Mupta-Kitanda village of Songea rural district), conflicts between fish farmers have become rampant as the number of FFUs has increased and water becomes scarce.
The majority of ponds are stocked with O. niloticus which has originally been obtained from the government ponds. U.S. Peace Corp volunteers provided farmers with fingerlings obtained from Homboro Hatchery in Dodoma Region. In Mbinga, T. mwanza was often referred to, which is likely to be identical to O. niloticus. 46 out of 643 FFUs have stocked their ponds with more than two species types. (Table 10)
As Table 11 shows, most FFUs obtained fingerlings for the first time from neighbouring farmers. In Tunduru and Mbinga, few farmers keep their own fingerlings for restocking, and are also unable to continue fish farming after the batch harvest. Quite a number of farmers claim the lack of fingerlings as a reason for abandoning pond operation. It was also observed that stunted fish were mistaken as fingerlings. This discouraged farmers from continuing fish farming operations.
| District | O. Niloticus | T. Ruvumae | T. Melanopeura | Others1 | Total | ||||
| No. | % | No. | % | No. | % | No. | % | No. | |
| Songea urban | 72 | 76% | 1 | 1% | 23 | 24% | 1 | 1% | 95 |
| Songea rural | 138 | 70% | 17 | 9% | 36 | 18% | 13 | 7% | 198 |
| Mbinga | 17 | 11% | 0 | 0% | 5 | 3% | 136 | 88% | 155 |
| Tunduru | 194 | 99% | 1 | 1% | 28 | 14% | 1 | 1% | 195 |
| Ruvuma total | |||||||||
| 421 | 65% | 19 | 3% | 92 | 14% | 151 | 23% | 643 | |
1 Others includes “T. Mwanza” which may be O. niloticus.
Primary source

Secondary source

Table 11: Original sources of fingerlings
| District | River | Neighbour | Gov. ponds | Others | Total | ||||
| No. | % | No. | % | No. | % | No. | % | No. | |
| Songea urban | 0 | 0% | 89 | 94% | 6 | 6% | 0 | 0% | 95 |
| Songea rural | 4 | 2% | 159 | 80% | 30 | 15% | 5 | 3% | 198 |
| Mbinga | 2 | 1% | 93 | 60% | 45 | 29% | 15 | 10% | 155 |
| Tunduru | 1 | 1% | 126 | 65% | 62 | 32% | 6 | 3% | 195 |
| Ruvuma | 7 | 1% | 467 | 73% | 143 | 22% | 26 | 4% | 643 |
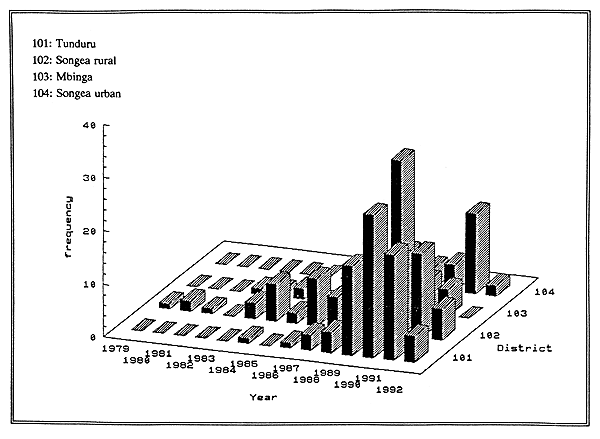
Figure 3 shows the year of first stocking by district. Most ponds started operation during the late 1980s when relatively frequent visits were made by fisheries officers with the assistance of PCVs who provided fingerlings.
Figure 3: Year of first stocking

While the majority of ponds in the region are drainable, those that depend on ground water are not completely drainable. Application of fertilizer is not as common as feeding. 28% of FFUs practice both intermittent and batch harvest.
Table 12 Characteristics of pond management
| District | Drainable | Fertilized | Feeding of fish | Intermittent Harvesting | Batch harvest | Total | |||||
| No. | % | No. | % | No. | % | No. | % | No. | % | No. | |
| Songea urban | 71 | 75% | 53 | 56% | 90 | 95% | 49 | 52% | 71 | 75% | 95 |
| Songea rural | 145 | 73% | 85 | 43% | 179 | 90% | 136 | 69% | 130 | 66% | 198 |
| Mbinga | 140 | 90% | 99 | 64% | 143 | 92% | 95 | 61% | 24 | 15% | 155 |
| Tunduru | 171 | 88% | 52 | 27% | 179 | 92% | 121 | 62% | 107 | 55% | 195 |
| Ruvuma | 527 | 82% | 289 | 45% | 591 | 92% | 401 | 62% | 332 | 52% | 643 |
The major sources of information about fish farming are neighbouring farmers. In Songea urban and Songea rural districts, where the number of active FFU is growing, neighbouring farmers are the most important source of information. In villages where Peace Corp volunteers (PCVs) stayed (e.g., Kidodoma of Tunduru and Mkako of Mbinga districts), a higher percentage of FFUs mentioned fisheries officers as a major source of information. (Table 13)
Table 13 Sources of information about fish farming
| District | Fisheries Officers | Agric. Extension Workers | Farmers | Total | |||
| No. | % | No. | % | No. | % | No. | |
| Songea Urban | 6 | 7% | 0 | 0% | 80 | 93% | 86 |
| Songea Rural | 31 | 18% | 7 | 4% | 136 | 78% | 174 |
| Mbinga | 81 | 55% | 0 | 0% | 66 | 45% | 147 |
| Tunduru | 87 | 47% | 5 | 3% | 95 | 51% | 187 |
| Ruvuma | 205 | 35% | 12 | 2% | 377 | 63% | 594 |