Most ponds are constructed on land which belongs to the owner's household or on land given free by relatives or village leaders. (Table 14) This land was often previously unused. In areas where arable land is becoming scarce, land is bought from the other farmers. There are some farmers who purchased several pieces of land for ponds through barter, usually in exchange of livestock.
Table 14: Type of land ownership for ponds
| District | Own land | Given Free | Leased | Bought | Unknown | Total |
| Songea Urban | 19 | 6 | 0 | 2 | 0 | 28 |
| Songea Rural | 82 | 21 | 2 | 7 | 0 | 114 |
| Mbinga | 20 | 12 | 1 | 3 | 1 | 37 |
| Tunduru | 35 | 39 | 2 | 9 | 5 | 93 |
| Ruvuma | 156 | 79 | 5 | 21 | 6 | 273 |
In most of the cases, farmers mobilized their own household labour for pond construction. Collaborative labour (“Ushirika”) is rarely applied, although it is a common practice for agricultural activities, such as harvesting and planting. (Table 15). This implies that availability of intra-household labour for construction of ponds is one of the determining factors for pond ownership.
Table 15: Type of labour used to construct ponds
| District | Own HH member | Hired Labour | Collective labour | own HH + hired labour | own HH + collective labour | Don't know | Total | |||||
| No. | % | No. | % | No. | % | No. | % | No. | % | No. | No. | |
| Songea Urban | 12 | 80% | 3 | 20% | 0 | 0% | 0 | 0% | 0 | 0% | 13 | 28 |
| Songea Rural | 74 | 84% | 9 | 10% | 3 | 3% | 1 | 1% | 1 | 1% | 26 | 114 |
| Mbinga | 7 | 78% | 1 | 11% | 0 | 0% | 1 | 11% | 0 | 0% | 28 | 37 |
| Tunduru | 35 | 59% | 20 | 34% | 0 | 0% | 2 | 3% | 2 | 3% | 34 | 93 |
| Total | 128 | 75% | 33 | 19% | 3 | 2% | 4 | 2% | 3 | 2% | 101 | 273 |
The dominant type of fertilizer is manure from domestic animals (Table 16). Since there are few cows kept in the region, manure from goats and pigs is often applied. In those cases where chickens are kept in cages, chicken droppings are also used.
Table 16: Types of fertiliser used by FFUs
| District | On-by farm product | Bought material | Total | ||||||
| Manure | Grass | Manure and grass | Inorganic fertilizer | ||||||
| No. | % | No. | % | No. | % | No. | % | No. | |
| Songea Urban | 14 | 88% | 2 | 13% | 3 | 19% | 0 | 0% | 16 |
| Songea Rural | 35 | 48% | 7 | 10% | 2 | 3% | 2 | 3% | 73 |
| Mbinga | 18 | 64% | 8 | 29% | 3 | 11% | 1 | 4% | 28 |
| Tunduru | 15 | 29% | 3 | 6% | 2 | 4% | 3 | 6% | 52 |
| Ruvuma | 82 | 49% | 20 | 12% | 10 | 6% | 6 | 4% | 169 |
The principal types of feeds used are farm by-products, such as maize bran, rice bran, cassava and vegetable leaves. During the rainy season when these materials become scarce, some FFUs apply purchased maize bran from maize mills or rice bran from neighbouring farmers. Kitchen wastes are less frequently used because only few ponds are located near homesteads.
Table 17: Types of feed used by FFU
| On-farm by-products | Purchased Feeds | Kitchen Wastes | Total | ||||||
| District | Maize Bran/Rice Bran/Millet | Cassava papaya/sweet potato leaves | |||||||
| N | % | N | % | N | % | N | % | N | |
| Songea Urban | 20 | 100% | 18 | 90% | 0 | 0% | 13 | 65% | 20 |
| Songea Rural | 48 | 92% | 44 | 85% | 3 | 6% | 23 | 44% | 52 |
| Mbinga | 33 | 100% | 18 | 55% | 0 | 0% | 14 | 42% | 33 |
| Tunduru | 50 | 96% | 47 | 90% | 1 | 2% | 11 | 21% | 52 |
| Ruvuma | 151 | 96% | 127 | 81% | 4 | 3% | 61 | 39% | 157 |
The majority of FFUs indicate a feeding frequency of two to three times a week (Table 18). It was noted, however, that during the rainy season (November to March) when both men and women are busy in cultivation of agricultural products, feeding become sporadic because of the lack of time and because of lack of availability of feed.
Table 18: Frequency of feeding by FFUs
| District | Every day | 2–3 times a week | Once a week | Occasionally | Don't Know | Total | |||||
| No. | % | No. | % | No. | % | No. | % | No. | % | No. | |
| Songea Urban | 4 | 20% | 13 | 65% | 2 | 10% | 1 | 5% | 0 | 0% | 20 |
| Songea Rural | 10 | 19% | 26 | 50% | 11 | 21% | 3 | 6% | 2 | 4% | 52 |
| Mbinga | 8 | 24% | 9 | 27% | 5 | 15% | 10 | 30% | 1 | 3% | 33 |
| Tunduru | 9 | 17% | 26 | 50% | 12 | 23% | 3 | 6% | 2 | 4% | 52 |
| Total | 31 | 20% | 74 | 47% | 30 | 19% | 17 | 11% | 5 | 3% | 157 |
Intermittent harvests are done once or twice a month and on special occasions only. In Mbinga district, intermittent harvests are less frequent. At the time of the survey, most households had completed the harvest of agricultural products; the responses may have been biased in favour of a higher frequency of intermittent harvest (Table 19).
Table 19: Frequency of intermittent harvesting
| District | Special Occasion | 1–2 times/month | 1–2 times/week | >3times/week | Total | ||||
| No. | % | No. | % | No. | % | No. | % | No. | |
| Songea Urban | 3 | 19% | 8 | 50% | 3 | 19% | 2 | 13% | 16 |
| Songea Rural | 16 | 22% | 36 | 49% | 12 | 16% | 9 | 12% | 73 |
| Mbinga | 16 | 57% | 11 | 39% | 0 | 0% | 1 | 4% | 28 |
| Tunduru | 20 | 38% | 23 | 44% | 7 | 13% | 2 | 4% | 52 |
| Ruvuma | 55 | 33% | 78 | 46% | 22 | 13% | 14 | 8% | 169 |
It is common to start intermittent harvesting after five to six months from the date of stocking. (Figure 4). The mean number of months between stocking and the first intermittent harvest is seven. 83% of FFUs do not commence intermittent harvesting until six months after stocking.
The average quantity of fish harvested during the last intermittent harvest is estimated to be about 4.2 litre8. About half of small fish with an average weight of 80 g. It must be noted that the survey coincided with the end of the production cycle for most of the ponds. Therefore the data may overestimate the quantities harvested intermittently during other periods of the year.
Figure 4: Interval between stocking and first intermittent harvest
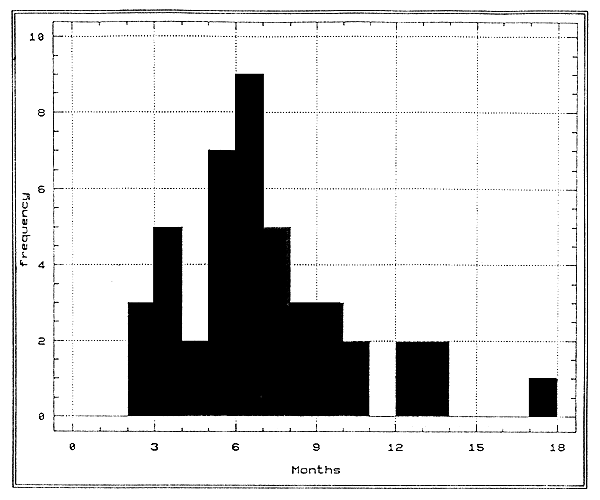
Table 20: Production from the last intermittent harvest
| District | Big fish | Small fish | Total | ||
| Production per harvest | Production per harvest | ||||
| lit. | SE9 | lit | SE | lit | |
| Songea urban | 1.7 | 0.6 | 2.8 | 1.6 | 4.6 |
| Songea rural | 1.5 | 0.2 | 1.8 | 0.6 | 3.4 |
| Mbinga | 4.6 | 1.0 | 1.6 | 0.8 | 6.2 |
| Tunduru | 2.0 | 0.4 | 2.1 | 0.6 | 4.1 |
| Ruvuma | 2.2 | 0.2 | 2.0 | 0.4 | 4.2 |
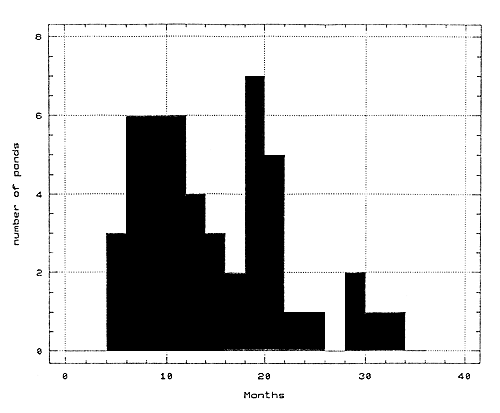
Table 21 and Figure 5 show the distribution of the number of months between stocking and batch harvest. 54% of the ponds have had total harvest within 15 months from stocking.
Table 21: Number of months between stocking and batch harvest (number of ponds)
| No. months | <6 | 6–8 | 9–11 | 12–14 | 15–17 | 18–20 | 21–23 | >24 | NA | DK | Tot |
| Songea Urban | 1 | 1 | 6 | 2 | 2 | 0 | 2 | 2 | 4 | 8 | 20 |
| Songea Rural | 0 | 7 | 4 | 8 | 4 | 6 | 3 | 13 | 26 | 41 | 112 |
| Mbinga | 2 | 0 | 0 | 0 | 0 | 0 | 1 | 2 | 27 | 7 | 39 |
| Tunduru | 3 | 8 | 5 | 6 | 3 | 2 | 2 | 5 | 26 | 37 | 97 |
| Ruvuma | 6 | 16 | 15 | 16 | 9 | 8 | 8 | 22 | 83 | 93 | 275 |
Figure 5: Number of months between stocking and batch harvest
The commonly applied method of batch harvest is partial drainage of water (Table 22). Fish are manually collected since seine nets are not owned by FFUs. The Regional Fishery Office owns one seine net and rents it out at 200 Tsh per day, but it is accessible only to farmers living in Songea urban area. Ponds are seldom drained completely.
Table 22: Methods of batch harvesting
| District | Partial Draining | Complete Draining | Seining | Don't Know | Total | ||||
| No. | % | No. | % | No. | % | No. | % | No. | |
| Songea Urban | 9 | 56% | 0 | 0% | 7 | 44% | 0 | 0% | 16 |
| Songea Rural | 26 | 59% | 6 | 14% | 12 | 27% | 0 | 0% | 44 |
| Mbinga | 0 | 0% | 0 | 0% | 3 | 43% | 4 | 57% | 7 |
| Tunduru | 14 | 44% | 2 | 6% | 15 | 47% | 1 | 3% | 32 |
| Ruvuma | 49 | 37% | 8 | 6% | 37 | 28% | 5 | 4% | 133 |
Average production from batch harvesting is 22.7 litres (Table 23). About 66% of the production from the batch harvest was sold, mainly to neighbours at an average price of 351 Tsh (1.1 US$) per kg of big fish and 134 Tsh (0.4 US$) per kg of small fish (Tables 24 and 25). On average, a batch harvest yields a gross revenue of 6,100 Tsh including the value of fish kept for auto consumption.
Table 23: Quantity of fish from last batch harvest
| District | Production per pond | Total production | ||||
| Big fish | Small fish | per pond | 100M2 | |||
| lit | SE | lit | SE | lit | kg | |
| Songea urban | 22.0 | 4.3 | 15.8 | 4.3 | 37.7 | 8.3 |
| Songea rural | 16.4 | 2.0 | 10.0 | 2.0 | 26.4 | 3.8 |
| Mbinga | 5.1 | 2.7 | 2.5 | 1.7 | 7.6 | 5.9 |
| Tunduru | 12.7 | 2.1 | 6.9 | 1.5 | 19.6 | 9.2 |
| Ruvuma | 14.1 | 1.2 | 8.5 | 1.1 | 22.7 | 8.1 |
Table 24: Quantity and value of fish sold during the last batch harvest (1991/1992 price)
| District | Big fish | Small fish | Total | % of total harvest | ||
| quantity sold | quantity sold | |||||
| lit. | SE | lit | SE | lit | % | |
| Songea urban | 19.2 | 3.9 | 8.8 | 4.0 | 28 | 74 |
| Songea rural | 12.6 | 3.2 | 5.1 | 2.0 | 17.7 | 67 |
| 59 | ||||||
| Mbinga | 3.9 | - | 0.6 | - | 4.5 | |
| Tunduru | 8.2 | 2.7 | 3.1 | 2.0 | 11.3 | 58 |
| Ruvuma | 10.7 | 1.9 | 4.2 | 1.3 | 14.9 | 66 |
Table 25: Value of fish (1991/1992 prices)
| District | Big fish | Small fish | ||
| T.sh/lit | T.sh/fish | T.sh/lit | T.sh/fish | |
| Songea urban | 559 | 75 | 120 | 10 |
| Songea rural | 369 | 49 | 131 | 11 |
| Mbinga | 133 | 18 | NA | NA |
| Tunduru | 220 | 29 | 158 | 13 |
| Total | 351 | 47 | 134 | 11 |
Table 26 shows the average stocking density of the ponds. The average of 0.8 fingerlings per m2 is far lower than the recommended stocking density (2 per m2). Songea urban, where the government pond is located and allows farmers better access to fingerlings, records the highest stocking density. The second highest stocking density was observed in Mbinga district, where average pond sizes are smaller.
Table 26: Average stocking density
| District | Average no. of fingerlings per pond | Average no. of fingerlings per m2 |
| Songea urban | 325 | 1.39 |
| Songea rural | 235 | 0.63 |
| Mbinga | 151 | 1.17 |
| Tunduru | 182 | 0.85 |
| Ruvuma | 219 | 0.78 |
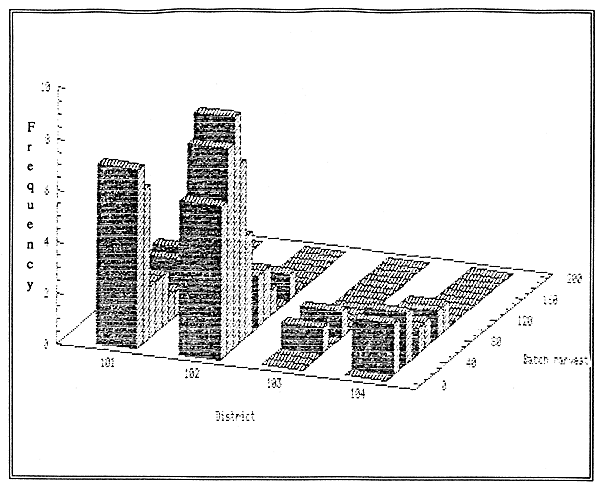
Based on the survey results, average annual production is estimated at 35 kg per pond (Table 27). Average production per FFU is highest in Songea urban district (71.8 kg) where average pond size is larger. It is also because the quantity of batch harvest is skewed toward higher production in Songea urban district, while in Tunduru and Songea urban districts, figures are concentrated on lower range (Figure 5). On the other hand, unit area productivity is the highest in Mbinga district (31.5 kg per 100 m2), where average pond size is smaller, while stocking density and feeding frequency are higher, than in other districts. It is notable that the unit area productivity is inversely related to pond size.
Table 27: Estimate of production 9
| District | Kg per pond | Kg per 100 m2 | Kg per FFU |
| Songea urban | 51.3 | 11.3 | 71.8 |
| Songea rural | 36.3 | 9.8 | 58.1 |
| Mbinga | 26.2 | 20.3 | 31.5 |
| Tunduru | 31.9 | 15.0 | 54.2 |
| Ruvuma | 35.2 | 12.6 | 52.8 |
Figure 6: Distribution of production by batch harvest
Dagaa (dried fresh water sardine) is considered as the second important source of protein after beans. Dagaa from Lake Tanganyika is preferred the most followed by those from Lake Nyasa and Lake Victoria. Dagaa from Lake Victoria is least liked due to its bitterness. Lake Tanganyika dagaa fetches the highest price among the three types of Dagaa are available throughout the year10. Dagaa from Lake Nyasa can be found only during the dry season (May-August).
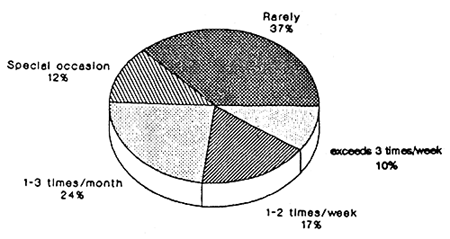
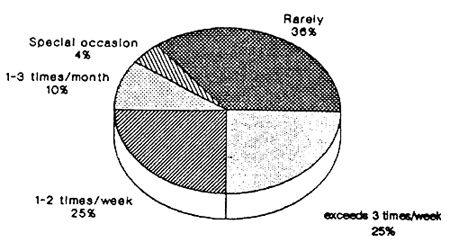
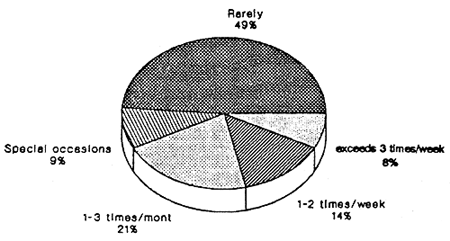
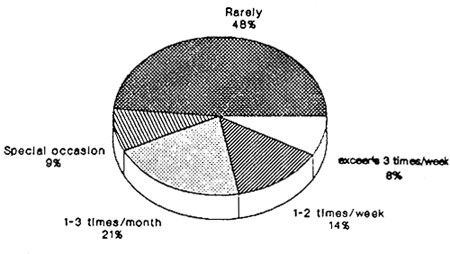
Figure 7 reveals that the pattern of consumption of fish from ponds is similar to that of meat. In other words, pond fish is not a substitute for the regular consumption of dried fish, but eaten on special occasions as with meat. Fish from the ponds are usually consumed fresh. Excess fish is either sun dried, smoked or fried for preservation. Processed fish is kept for two to three days mainly for home consumption. Generally fish is eaten more frequently during the dry season, after harvesting, when more disposable income is available within households.
Ruvuma Region imports meat (particularly beef) from neighbouring regions: Iringa, Dodoma and Shingida.
Figure 7 Frequency of consumption of fish from ponds and other animal protein food
| Fish from ponds | Dried fish |
 |  |
| Eggs | Meat |
 |  |
Maize is the most common source of income for FFUs in Songea urban and Songea rural districts. In Mbinga and Tunduru, cash crops such as coffee, cashew nuts and tobacco provide the major income. Over 30% of FFUs indicated fish farming as the third most important source of household income (Figure 8 and tables 2.1, 2.2 and 2.3 in the annexes).
Table 28: Comparison of gross revenue from fish farming, maize, tobacco and coffee cultivations
| Types of cultivation | Annual gross revenue per households (T.sh) |
| FISH FARMING1 | 15,300 |
| Total | |
| -Revenue from intermittent harvests | 9,200 |
| venue from batch harvest | 6,100 |
| MAIZE CULTIVATION2 -maize (2.6 acres) | 59,000 |
| TOBACCO CULTIVATION3 -tobacco (1.5 acres) | 150,000 |
| COFFEE CULTIVATION -coffee (1.8 acres)4 | 23,736 |
1 Detailed calculations are shown in Table 30.
Table 28 compares average gross earnings from fish farming with indicative earnings from maize and tobacco, which are the major food and cash crops in the region. It shows that the economic contribution of fish farming is not insignificant for fish farming households, particularly for those depending mainly on maize production. As recovery of cash for maize sales takes several months, most farmers are forced to sell part of the harvest to private traders who come with lorries in order to meet immediate expenditures. The traders offer about 40 % lower prices than official prices. It is notable that the average revenue from a batch harvest provides the equivalent of 300 kg of maize at private trader price, which is a significant cash inflow for the household, particularly for those dependent on maize production. Since prices of agricultural inputs, particularly fertilizer, have tripled due to removal of government subsidy, the economic importance of fish farming may be still higher in terms of net income.
Figure 8: Sources of income of fish farming households
| Secondary source | |
| Sources of income | 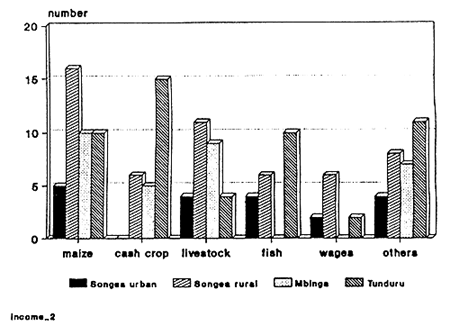 |
| Main source | Third source |
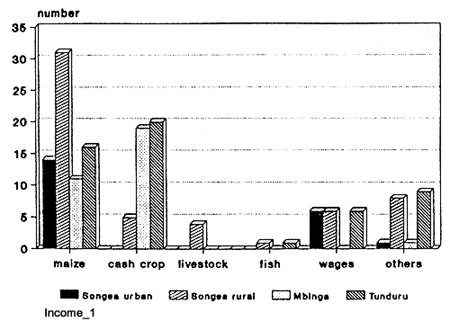 | 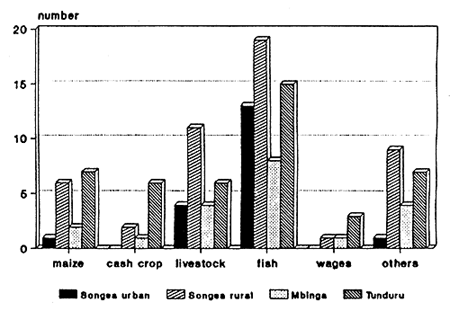 |
Figure 9: Use of income from fish farming
| Secondary use | |
| Uses of income from fish farming | 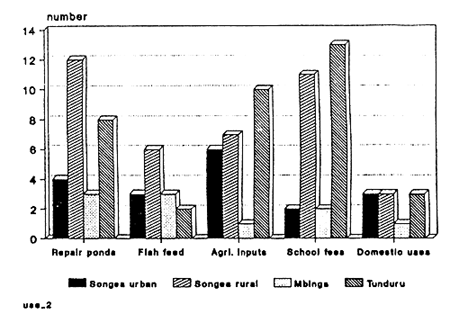 |
| Main use | Third use |
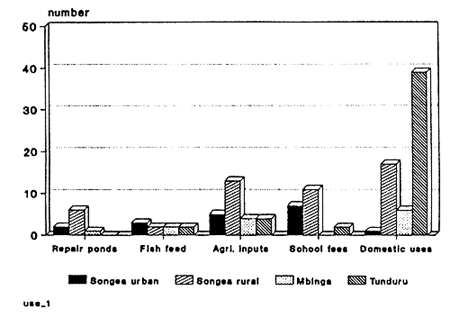 | 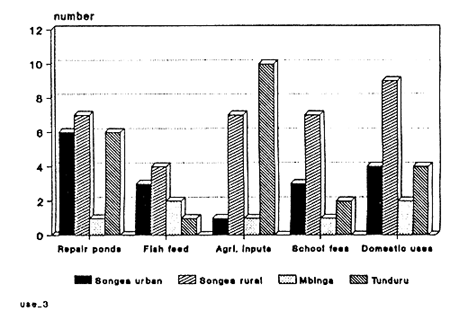 |
A typical FFU in Ruvuma region obtains a net income of about 4,600 Tsh through one year of pond operation, including the value of fish for household consumption (Table 30). The gross income from the sales of fish after the batch harvest of about 6,000 Tsh is the major component of income from fish farming. The major use of income is for purchasing domestic necessities including cooking oil, salt, sugar, cloth etc. and purchase of agricultural inputs, more specifically fertilizer. FFUs use cash income from fish sales of intermittent harvests in order to meet ad-hoc cash outlays.
It is rare that income derived from fish farming is directly re-invested in fish culture operations. (Figure 9 and Tables 4.1, 4.2 and 4.3 in Annex VI). Some farmers use income from fish farming as seed money to start businesses such as buying and selling of salt, sugar, and soup and to raise enough money to construct additional ponds.
Less than 40 % of the interviewed FFUs sell fingerlings to neighbours at about 4–5 Tsh per fish. This price is higher than that of fingerlings from the government pond (Tsh. 2 per fish). 300 to 400 fingerlings are sold by FFUs in one year. Sales of fingerlings also provide additional income to the FFUs.
Table 29: Sales of fingerlings by FFUs
| District | Sales of fingerlings by FFUs | Number of F.lings sold | Price per F.lings (T.sh) | |||
| Yes | No | DK | Total | |||
| Songea urban | 15 | 13 | 0 | 28 | 303 | 4 |
| Songea rural | 42 | 67 | 5 | 114 | 450 | 4 |
| Mbinga | 9 | 28 | 0 | 37 | 284 | 4 |
| Tunduru | 38 | 44 | 11 | 93 | 340 | 5 |
| Ruvuma | 105 | 152 | 16 | 273 | 371 | 4 |
Table 30: Indicative costs and earnings of aquaculture in Ruvuma region14
| Revenue | Items | Tsh./year |
| - Revenue from int. harvest | 9,200 | |
| - Revenue from batch harvest | 6,100 | |
| Total gross revenue | 15,300 | |
| Costs | Items | Tsh/year |
| Fixed costs | 6,080 | |
| - Maintenance of pond | 5,600 | |
| - Fingerlings | 480 | |
| Variable costs | 4,600 | |
| - Feeding, fertilizing | 3,100 | |
| - Labour for batch harvest | 1,500 | |
| Total costs | 10,680 | |
| Net income | 4,620 |
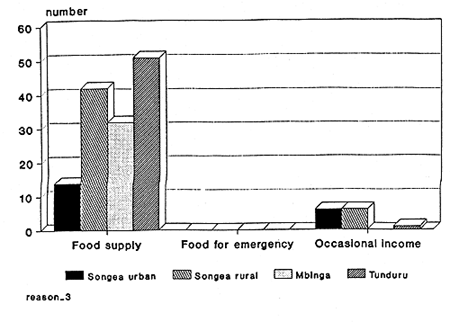
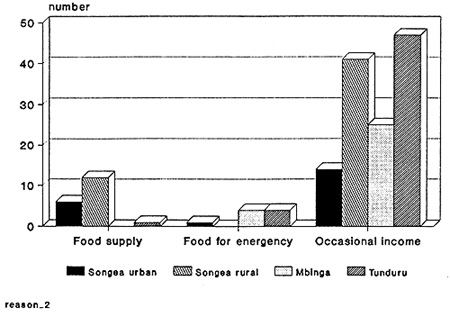
Fish farming is carried out occasionally to supply relish for household members and secondly to generate cash income to meet occasional expenses. (Figure 9) It was often mentioned that fish ponds serve as a ready source of cash in time of need (i.e., school fees, purchase of medicine, oil and other household essentials). Some farmers have compared a fish pond to having one's own bank account.
FFUs belong to slightly larger agricultural holders compared to the regional average of agricultural holdings of 5 acres. In Mbinga district, it was mentioned that a number of the pond owners were relatively old and had smaller agricultural holdings. Further comparative analysis between FFHs and the non-FFHs can be made when the results of the pilot agricultural census become available for Ruvuma region.
Table 31: Agricultural land holding of fish farming households
| District | Maize | Tobacco | Coffee | Cassava | Rice | Total No. |
| % | % | % | % | % | ||
| Songea urban | 95 | 81 | 0 | 0 | 48 | 21 |
| Songea rural | 100 | 87 | 2 | 2 | 80 | 55 |
| Mbinga | 84 | 78 | 75 | 0 | 6 | 32 |
| Tunduru | 90 | 90 | 4 | 69 | 65 | 52 |
| Ruvuma | 92 | 85 | 17 | 23 | 56 | 161 |
Table 32: Average agricultural holding of fish farming households (Land area in acres)
| District | Maize | Tobacco | Coffee | Cassava | Rice | Others |
| Songea urban | 2.62 | 0.98 | 0 | 0 | 0.4 | 0.80 |
| Songea rural | 3.32 | 1.17 | 0.04 | 0.05 | 0.85 | 1.13 |
| Mbinga | 2.55 | 2.1 | 1.8 | 0 | 0.06 | 1.12 |
| Tunduru | 3.92 | 3.69 | 0.25 | 5.22 | 2.83 | 2.81 |
| Ruvuma | 2.64 | 1.52 | 0.45 | 1.09 | 0.65 | 1.01 |
Figure 10: Reasons for fish farming
| Main reason |
 |
| Secondary reason |
 |
Due to the existence of Tsetse flies, Ruvuma is known for low density of livestock. Suluti Agricultural Experimental Station of Uyole Research Institute in Namtumbo village of Songea rural district has initiated the distribution of 16 female calves. Chickens are the most common livestock kept, but the number has been decreasing due to disease. Other types of livestock include pigeon, ducks and rabbits.
Table 33: Average livestock holding of fish farming households
| District | Chickens | Goats | Cows | Pigs | Others |
| Songea urban | 10 | 4 | 0 | 0 | 4 |
| Songea rural | 14 | 4 | 0 | 1 | 5 |
| Mbinga | 11 | 2 | 0 | 2 | 2 |
| Tunduru | 8 | 1 | 0 | 0 | 4 |
| Ruvuma | 11 | 3 | 0 | 1 | 4 |