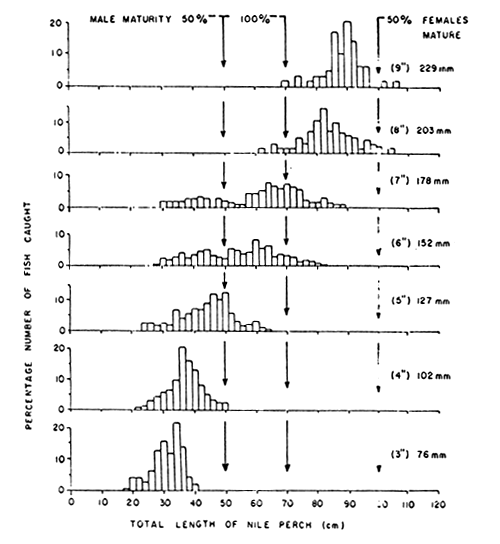
Figure 1. The length frequency distribution of Nile perch caught by gillnets of different mesh sizes expressed as a percentage of the catch for each 2 cm length classes of the fish for each mesh size.

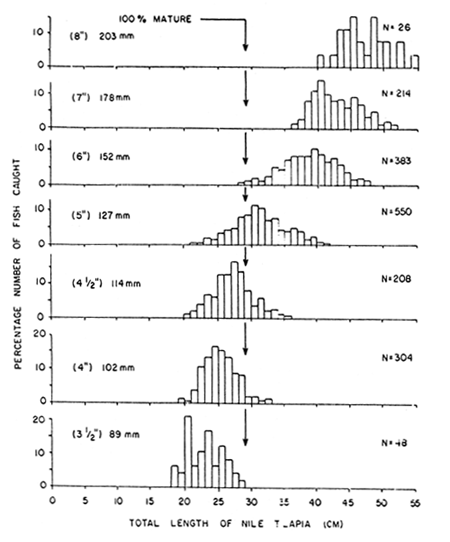
Figure 2. The length frequency distribution of Nile tilapia caught by gillnets of different mesh sizes expressed as a percentage of the catch for each 1 cm length classes of the fish for each mesh size.

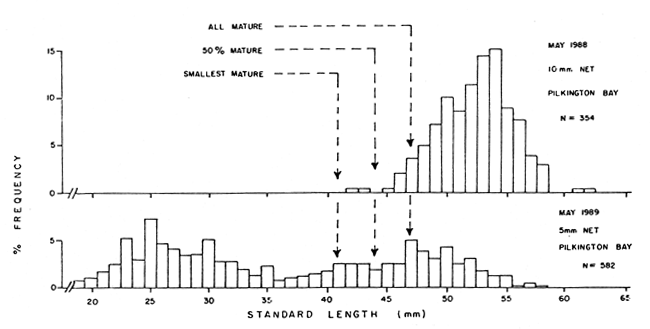
Figure 3. The length frequency distribution of Mukene retained in commercial seine nets in Lake Victoria. The sizes at which 50%, and all fish are mature and those of the smallest mature individuals are indicated.