![]()
![]()
![]()
BY J. WADANYA
Abstract |
| This report describes twin trips that were made to Tororo
Region, firstly with the specific objective to brief the Regional
Fisheries Officer and his survey team on the methodology and
procedures of the Frame Survey and to get it started and secondly
the Frame Survey monitoring trip made during the Frame Survey
implementation on Lake Victoria. Observations made on the general
aspect of the fishing industry and its related activities in the
region are brought to the fore. |
OCTOBER, 1990
INTRODUCTION :
The first Frame Survey (FS) trip to Tororo Region was carried
out on the 28th September, 1990. This became possible after
successful repairs had been done on the Region's wooden canoe
which had been brought in the Fisheries Training Institute
Workshop in Entebbe to be given fibre glass coating. It was
aimed at taking survey inputs to the Region in preparation for
survey implementation. The work done on this trip is fully
described in chapter two below.
The second trip was organised to monitor the FS performance and
progress in the field. The activities of this second trip are
described in chapter 3.
2. FIRST FS TRIP ACTIVITIES :
The day after arrival, the Ag. Regional Fisheries Officer (RFO) signed for the survey items as well as cash for fuel purchases at his office. Thereafter, an exhaustive review of the region's survey programme was done. The timing was adjusted to 3rd October, 1990. The route and fish landings to be visited for a start remained the same as in the original programme. Later on, the rest of the members on the survey team assembled and a re-orientation briefing was again done, particularly stressing accountability to project equipment including careful handling to maximise survey output. Items delivered to the region are shown in Appendix I.
On the afternoon of the 27th September, myself accompanied by Mr. L. Nambokwe (AFDO, Sigulu Islands), drove with the Fisheries Department Lorry carrying the survey boat to Majanji Landing.
Together, we witnessed its proper unloading and later the launching at the beach. No leakage was observed on the boat. A complete list of persons met is shown in appendix II.
The Frame Survey implementation in Tororo Region began on the 3rd October, 1990, as scheduled. Members on the Regional survey team were Mr. P. Nkwanga (RFO, Tororo); Mr. L. Nambokwe (AFDO, Sigulu Islands); and Ms. R. Gimbo (FA, Busia). The fishing industry in this region revolves around the Sigulu Islands complex and the mainland landings of Lake Victoria. However, for survey purposes, a series of other islands in the lake, though belonging to Jinja Regional Office administratively, were covered by this survey team from Tororo Fisheries Region. For the successful implementation of this survey, clearance had to be obtained from both the Tororo District Administration and the Iganga District Administration. This arrangement was carefully accomplished by the Regional Fisheries officer, Tororo, before plunging fully into survey execution.
3. SECOND FS MONITORING TRIP :
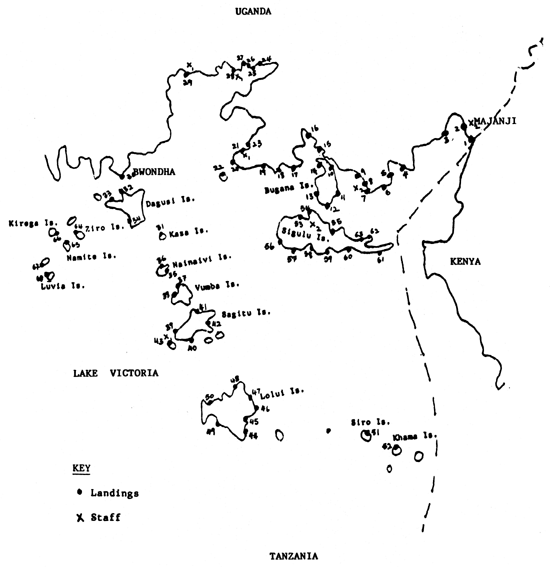
After eight days on water, the Survey team was joined by the author from the project headquarters in Entebbe from the 11th – 19th October, 1990 at Bwondha Landing in Iganga District. Details of the team's travel in the Islands is depicted in the map (Annex I). A list of the Landings and their map codes is given in Annex II.
During the period with the survey team, up to fourteen landings on separate Islands (Sirinyabi, Bumba, Sagitu, Masulya and Lolwe) were covered. The itinerary followed is shown in Appendix III.
The most salient observation made upon reaching the islands is
that practically all of them have no resident fisheries staff.
As the survey progressed, it became clear that visits to these
landings by some fisheries staff are only made occasionally.
Even then, most of their work concentrates on law enforcement
instead of extension work and fisheries statistics collection.
As fishermen reported a number of times in various Islands, they
have not as yet come to know anything about Uganda's fishing
regulations, since the extension officers merely go to harass
them and so end up making their visits very abrupt and short
lived.
There is still a lot of ground to be covered in this area in order to achieve a viable system of data collection. Mutual trust has not been established as yet between the fishing community and the fisheries staff in a number of these islands. This is evidenced from the fact that fishermen still run away on seeing an approaching boat, particularly one from the Fisheries Department.
At several landings, quite some time was taken up trying to explain the purpose of the survey to one or two who may have stayed around. But for filling in the questionnaire, there is need to have the majority of them present. By the time all were gathered, a great deal of time was already lost.
4. SURVEY ACTIVITIES :
The objective of joining the survey as it progressed was to monitor the progress so far scored in the survey implementation, to assess the level of interpretation of the questionnaire by the survey team and to guide the team in the specific questions where they may have found difficulties.
From all observations, it was clear that the team adopted an approach which did not arouse suspicions of the fishermen about the whole exercise. Right from the beginning it was explained to the fisherfolk that this was only an information seeking survey connected with taking inventory of the fishing industry and was not in any way connected with law enforcement. This explanation alone allayed most of the unfounded fears about the intentions of the activity and led to good response from the fishing community throughout most landings.
FRAFORM.A2 which deals with individual boat particulars was the easiest to fill out. The only single difficulty was in the case where a boat is owned by say 3 people who may not even be in a co-operative but the card caters for only one ownership.
It is not easy to always find all the boats at the landing beaches by the time you arrive there. Moreover, the interview process may take place in the village itself. As such, a list of the fishermen from the head fishermen (Gabungas) of the landings were always helpful though not absolutely conclusive. At the time of arrival, information about absentee boats from landings was always obtained from the whole available group present, including the three people always chosen to represent the fishermen of the particular landing for the purpose of filling in the forms.
In this manner, the entries for remarks on FRAFORM.A2 represent the suggestions or even needs of a particular boat owner. These remarks throw a lot more light on the level of activity of that particular boat owner and present the level of investment and likely earnings, at least by extrapolation.
FRAFORM.A1, which captures all information about every landing, posed some problems for the survey team. By the time the author joined the team, a total of up to thirty-four (34) landings had been covered. This far, the survey was reported to be going fine i.e without problems. However, examination of some already completed forms for the earlier landing places revealed that some questions were not properly understood and interpreted. Prominent among these were questions 7, 11, 12 & 13.
For question 7, the team had all along not been able to separate the items that go into the questionnaire TRANSPORT ONLY canoes. This was explained and made very clear on subsequent questionnaires from then on.
For question 11 part (b), i.e about other markets to be specified by the persons interviewed, was not satisfactorily answered. This is because, although it is a well known fact that more than anything else, fish from Uganda waters is sold in Kenya, not a single fisherman wants to reveal that information. At least for all the eight days on the lake, all fishermen only talked about Uganda markets as the only destination for their catch. Reference to Kenya markets was always in reference to “unknown” boats which buy fish on the water.
In many questionnaires, question 12 sub-item bicycle was tentatively substituted with visiting boat. This originated from the fact that in these islands what acts like bicycles are actually the daily visiting boats from Kenya. These boats come in to collect fresh fish that was not sold off on the water or fish that is available at the landings due to late hauling of gear or from catches of illegal gear like the beach seines.
In question 13 sub-item (b), there had already occurred the general mistake of not including a specific numeral against the particular type of boat(s) that may have been involved in the accident.
Outside these errors of ommission and sometimes commission, the team was proceeding well with practically having all the questions filled. This definitely removed the element of vagueness in the individual questions.
5. OVERALL OBSERVATIONS ABOUT THE FISHERIES IN THE REGION :
1. The Sigulu islands is a complex of ten smaller islands, namely : Jdagusi, Kaza, Sirinyabi, Bumba, Sagitu, Masulya, Lolwe, Khama, and Siro with Sigulu main included. The fishery in this region is generally based on gillnets and longlines. Most fishing boats are of the planked Sesse type. There are also a few dug-outs fishing in sheltered waters. Masulya landing has the biggest fishing activities in the region. It has over 80 boats concentrated on this stony island all having outboard motors ranging between 25 & 55 hp. Ten (10) of these are specially transport boats whose main activity is to ferry fish to Kenya, particularly to landings of Sio Port and Mulwanda. Because of this mastery of the water, due to use of engines, fishing is mostly done in the extreme southern waters around the islands of Siro and Khama, which are borderline islands with Tanzania waters.
2. There is absolute necessity to keep the fishery in the hands of the Ugandan nationals. At present, throughout the islands, Uganda waters have become a common property resource even to the Kenyans. Kenyan registered boats are found freely fishing in the Uganda waters side by side with the Ugandan boats. On the side of fish marketing, buying of fish generally takes place on water where fish is sold to the Kenyan fishmongers with the result that very little fish reaches the Uganda landings in fresh form. There is some smoked Nile perch on Uganda landings as all the tilapia is sold off in the water in fresh form. This smoked perch is the only product that sells in Uganda and never goes to Kenya. Throughout the day, one is able to observe Kenya transport boats plying between every landing to purchase the little fish there is on the landings and thereafter take off again.
3. The Fisheries Department has yet to make its presence felt
in the area. This far, all the islands are almost supervised by
one AFDO from Tororo who mostly stays on Sigulu main Island.
However, this officer has no waterborne transport and has made
least impact in the area as he may only visit each landing once
in a year. It is also true, as fishermen themselves indicated,
that such an officer has done little in extension work or even
statistics collection.
The 1990 fish catch estimates of 813.7 tons are on the low side
(Table 1). These are based on sampled totals at only 12 fish
landings out of 68 identified ones in the whole region. No
attempt is made to estimate for the rest of the landings since
fishing effort in these areas is not known.
4. Fishing activity in all the islands except Masulya has
generally gone down. Fishermen themselves say that this is
because of lakewide thefts of fishing gear by the Kenya bound
boats while on their way from Uganda. As a result of these
thefts, the fishermen on the rest of the islands have become so
poor as the majority of them have lost all the gear and are long
out of fishing. The few who remain in the fishing have very few
gears and even then these are gears which have become too old to
catch fish. There is constant fear of venturing with new gear
into the lake since these would be quickly stolen.
The final result of thefts on the lake has been the
resurgence of beach seines and night fishing for Rastrineobola
argentea, using “mosquito” nets. Another emerging gear is the
cast net which can be seen being applied throughout the day time
and late evenings on various areas of the lake.
5. Catch assessment and Socio-economic surveys in this region will need to be carefully planned at implementation time. Thereafter, a critical analysis should be given to the results. This will entail detailed baseline knowledge about the peculiarities of this fishery in order to propose recommendations for the development, planning and monitoring of this fishery.
6. SURVEY COMPLETION :
The Frame survey in the region came to an end on 3rd November,
1990 after covering the Sigulu main Island and the extreme
southern islands of Khama and Siro. This last leg of the survey
was done by the three junior members of the survey team after a
break of five days.
The Regional Officer's report indicates that in the rest of the
islands covered last, there was general indifference by fisherfolk
to the frame survey interview. The basic reason is that
these islands are almost wholy occupied by people of Kenyan
origin and as such did not want to give information to a Ugandan
survey team. On Siro and Khama, the other reason may be that,
for a long time, their fisheries have been managed by Kenyan
Fisheries administration and it is only recently that Uganda has
gained hold on them but the fisheries department does not yet
have a staff there.
During office editing of the Frame Survey forms, the R.F.O. and
the survey team decided that for question 12 of FORM.A1, the
entry on the number of bicycles visiting the landing should
remain N/A. During the survey it had been entered as the number
of visiting boats to the landing.
A number of FS forms remain to be collected from the mainland
landings of Bwondha, Bugoto and Idhokwe. The preliminary
analysis of FS results is shown in Appendix III.
APPENDIX 1 : LIST OF DELIVERED ITEMS.
APPENDIX II : LIST OF PERSONS MET IN THE FIELD.
Mr. P. Nkwanga RFO Tororo.
Mr. H. Makanga Ag. RFO Tororo & in-charge Sigulu Islands.
Mr. L. Nambokwe AFDO Sigulu Islands.
Ms. R. Gimbo FA Busia.
Mr. D. Olokojo FO Iganga District.
Mr. J. Bikala AFDO Iganga.
Mr. L. Okiria FA Bwondha Fish Landing.
Mr. L. Sunday FA Bwondha Fish Landing.
Mr. C. Oronon F/G Bwondha Fish Landing.
Mr. J. Ogesa coxwain on the Frame Survey.
APPENDIX III : FRAME SURVEY ITINERARY IN TORORO REGION.
| 11th/10/90 | Entebbe to Bwondha. |
| 12th/10/90 | Bwondha---Entebbe---Iganga. |
| 13th/10/90 | Iganga--Bwondha--Nainara Landing on Sirinyabi Island. |
| 14th/10/90 | Buyako & Bukabembe Landings on Bumba Island. |
| Busweta & Ddembe Landings on Sagitu Islands. | |
| 15th/10/90 | Naluwerere & Maganda Landings on Sagitu Island. |
| 16th/10/90 | Masulia Landing on Masulia Island. |
| 17th/10/90 | Singira, Mangoda & Butanira (a/b) on Lolwe Island. |
| 18th/10/90 | Mwango & Bukhangaba Landings on Lolwe Island. |
| 19th/10/90 | Kandege Landing on Lolwe Island. Proceed Entebbe. |
APPENDIX III : LIST OF LANDINGS AND THEIR CODES IN TORORO REGION.
| CODE | LANDING | ACTIVE BOATS |
|---|---|---|
| 01 | Madua | 17 |
| 02 | Majanji | 16 |
| 03 | Busime | 15 |
| 04 | Nalyoba | 17 |
| 05 | Businikho | 2 |
| 06 | Lugala | 26 |
| 07 | Buyundo | 9 |
| 08 | Busiro | 22 |
| 09 | Nabweyo | 26 |
| 10 | Bubwibo | 34 |
| 11 | Jela Ndogo | 11 |
| 12 | Buduma | 36 |
| 13 | Namafundu | 23 |
| 14 | Bukana | 12 |
| 15 | Lufudu | 61 |
| 16 | Sidome | 12 |
| 17 | Lugaga | 20 |
| 18 | Lubango | 18 |
| 19 | Luanda | 13 |
| 20 | Bumeru (A) | 26 |
| 21 | Bumeru (B) | 21 |
| 22 | Yebbe Island | 18 |
| 23 | Buchimo | 5 |
| 24 | Matiko | 15 |
| 25 | Maruba | 16 |
| 26 | Idokwe | 93 |
| 27 | Lwenge | 13 |
| 28 | Wakawaka | 27 |
| 29 | Bugoto | 177 |
| 30 | Bwondha | 127 |
| 31 | Khasa | 21 |
| 32 | Busabala | 13 |
| 33 | Gori Beach | 18 |
| 34 | Mubembe | 19 |
| 35 | Nainara Beach | 7 |
| 36 | Mulukoba | 11 |
| 37 | Buyako | 30 |
| 38 | Bukabambwe | 12 |
| 39 | Busweta | 22 |
| 40 | Dembe | 4 |
| 41 | Naluwerere | 19 |
| 42 | Maganda Beach | 11 |
| 43 | Masulya | 71 |
| 44 | Singila | 8 |
| 45 | Mwangoda | 1 |
| 46 | Butanira (A) | 16 |
| 47 | Butanira (B) | 6 |
| 48 | Mwango | 15 |
| 49 | Bukangaba | 8 |
| 50 | Kandege | 18 |
| 51 | Simo | 46 |
| 52 | Khama Beach | 35 |
| 53 | Bugoma | 19 |
| 54 | Musenye | 6 |
| 55 | Mukeri | 22 |
| 56 | Hasusuni | 8 |
| 57 | Bugege | 4 |
| 58 | Rabachi | 11 |
| 59 | Buyanga | 3 |
| 60 | Buhoba | 8 |
| 61 | Buraba | 26 |
| 62 | Matolo | 16 |
| 63 | Buyoga | 9 |
| 64 | Laboro | 2 |
| 65 | Namiti | 10 |
| 66 | Kirewe | 39 |
| 67 | Makaraga | 9 |
| 68 | Lubia | 71 |
TABLE 1 : PRODUCTION ESTIMATES FOR TORORO REGION, 1990
LAKE VICTORIA (wt in m. tons)
| SPECIES | Lates | Tilapia | Clarias | Protop | Rastr. | Sample Total | Annual Estimate |
| LANDINGS | |||||||
| Majanji | 53 | 4.1 | 0.2 | 0.05 | 3.12 | 60.47 | 90.7 |
| Maduwa | 19.59 | 0.1 | 0.12 | 0.1 | 19.91 | 29.86 | |
| Nalyoba | 14.4 | 14.4 | 21.6 | ||||
| Busime | 4 | 4 | 6 | ||||
| Buhoba | 53.7 | 4.55 | 58.3 | 87.45 | |||
| Buraba | 94.6 | 94.6 | 141.9 | ||||
| Bugoma | 54.6 | 54.6 | 81.9 | ||||
| Bugege | 50.9 | 3.6 | 54.5 | 81.75 | |||
| Bukana | 5 | 25.5 | 30.5 | 45.75 | |||
| Bumalenge | 85.5 | 9 | 12 | 106.5 | 159.7 | ||
| Buyanga | 8.4 | 8.4 | 12.6 | ||||
| Bukeri | 33.5 | 2.8 | 36.6 | 54.45 | |||
| Total | 431.3 | 76.2 | 0.22 | 2.9 | 31.67 | 542.3 | 813.7 |
Source : Fisheries Department, Monthly Reports 1990.
ANNEX I : A MAP SHOWING LANDINGS AND STAFF IN TORORO REGION.
![]()
![]()
![]()