![]()
![]()
![]()
BY
J. WADANYA
22nd November – 4th Dec, 1990.
| Abstract |
| This report specifically describes the trip that was made to
Lakes Kyoga and Kwania with the ADP Survey team based in Jinja.
The aim was for the author to acquaint himself with the Catch Assessment
Survey activities presently being undertaken on these
lakes by the ADP team. Consequently, in this report, observations
on these activities and appraisal of the problems pertaining
to statistical data collection on these lake systems will be
tackled. |
December, 1990.
1. INTRODUCTION:
Following the second monthly meeting between the Agricultural Development Programme (ADP) and the UGA/87/007 (FISHIN) Projects personnel in Jinja in October 1990, a proposal was made to the effect that the two projects should exchange officers at regular intervals in order to get them acquainted with each other's work in Entebbe and Jinja respectively. The proposal emanated from the fact that these two projects were handling a common aspect of work relating to the improvement of the statistical data collection and monitoring in the country but operating differently in time and space. However, the Department of Fisheries, wishes to adopt a common approach to the design and implementation of a permanent statistical system with defined methods and procedures in data collection throughout the country.
ADP has already accomplished two frame surveys on the lake Kyoga water system. The first frame survey was conducted in 1987. This survey was, however, restricted to only 78 landings on the southern part of the lake. Another frame survey, which we can term comprehensive, has recently been done on the entire Kyoga system. This one comprised the two lakes of Kyoga main and the smaller Lake Kwania. On Kyoga main, 94% and on Kwania, 79% of the registered landings were covered. In total, 134 landings were visited (Hartsuijker et al, 1990, unpubl.).
At present, the ADP effort is focused on Catch Assessment Survey
(CAS) activities in lakes Kyoga and Kwania.
The ADP members and other fisheries staff met in the field are
shown in Appendix I.
2. CAS OBSERVATIONS:
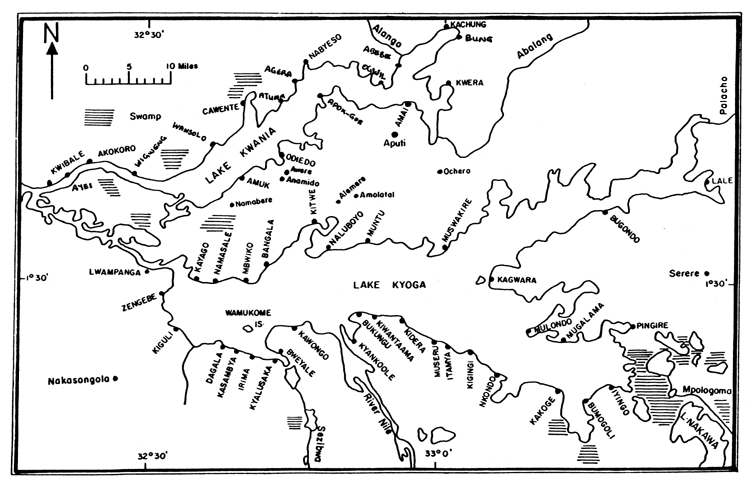
This trip saw the team venture out to Lake Kwania for the first time (Annex I. map).
In the twelve days of the trip, the following landings were visited, namely : Kayago, Atuma, Nabieso, Agweng, Apok-Gor, Odiedo, Ogwil, Abebe, Aoa, Kachum, Bambara, Ayei, Wigweng and Wansolo (Appendix II). At many of these landings, the actual work of catch assessment was conducted by the survey team.
2.1 CATCH AND EFFORT ON LAKE KYOGA:
Kayago is a large landing on Kyoga before crossing to Kwania. It
was the first station to stop and work in order to have a comparative
picture of the state of the fishery on the two lakes.
Kayago is one of the biggest landings on main Kyoga when based on
the number of fishing boats. During the ADP Frame Survey it had
up to 150 fishing canoes.
At the time of this visit, there were 100 active fishing canoes.
About 50 canoes were reported to have migrated to other landings
during the normal migrations which are so phenomenal on this
lake.
Most of the canoes here are parachutes (planked dug-outs) forming
60% of the boat population (the other canoes 40% consists of
large planked canoes).
The present gillnet fishing method utilises a maximum per canoe of 5 gillnets from the range of 4–4.5 inch. mesh. Out of the 150 fishing canoes, only five fish with engines. The rest are hand propelled.
After landing the fish from the gillnets, the same boats are used over again by beach seiners as well as by those who do cast netting during day time. There are seven beach seines and over 60 cast nets at the landing. The catch from beach seines is composed of 80% Nile perch and about 20% tilapia while that from cast nets is mostly tilapia. Generally fish arrives at the landing unsorted by species. Fishing on Lake Kyoga does not call upon very heavy investment. A boat typically carries few gears at a time. Thus the majority of boats return with their gears to the landing.
The present species catch composition at the landing stands as follows:
| Oreochromis niloticus | 60% |
| Lates niloticus | 37.5% |
| Bagrus docmac | 0.5% |
| Protopterus aethiopicus | 0.5% |
| Mormyrus sp. | 0.5% |
| Clarias sp. | 0.5% |
| Barbus sp. | 0.5% |
| Average catch/boat/day | 32.6 kg. |
There are five (5) transport canoes with engines. These transport people as well as processed fish across to Bukungu Landing in Kamuli District. From here the fish is then transported as far as Jinja and Busia markets by lorries and pickups.
Fish processing methods at the landing are sundrying and smoking. There are 20 smoking kilns in working condition. 90% of the total catch is processed and the magnitude of this processed fish at the landing is broken down as follows :
| Sundried | 40% |
| Smoked | 30% |
| Salted | 20% |
2.2 CATCH AND EFFORT ON LAKE KWANIA :
The recent FS on Lake Kwania revealed the existence of 669
canoes. However, at the time of our visit, it became clear that
a few more landings exist which had not been mapped by that survey.
This is attributed to a non-complete coverage by 21% (op. cit.
1990) and of course the emergence of new landings since the earlier
frame survey.
The fisheries administration of lake Kwania falls under Lira Regional office. For 1990, official figures were submitted on only 17 out of over 45 landings on the lake and for a period of only three months. These figures, based purely on sample totals and poor estimation procedures, indicate a total catch of only 5,960 tonnes and an estimated value of 967.7 million (U) shillings for the year 1990 (table I & II). However, based on FS results from these seventeen landings which had 356 canoes and a derived catch per unit effort of 46 kg/canoe/day and fishing for 350 days, the annual catch estimate for the 669 canoes on the lake is 10,770 tons.
The catch per unit effort revealed in the estimate above may be on the maximum side. This is evident from the observations made while in the field. The observed catch per unit effort ranged from the low 16.2 kg per boat to the high 42 kg per boat, without accounting for seasonal variation or the extent of coverage.
It is now widely believed that big Nile perch is very rare in lake Kyoga main, possibly due to use of very small mesh sized nets. However, on lake Kwania, Nile perch of up to 10 kg are present and are being caught in gillnets of 10 inch. mesh size (sighted at Atuma Landing).
The fishing canoes on Kyoga are mainly the smaller (15 feet) three-planked canoes, commonly called parachutes. Those on Lake Kwania are mainly planked canoes of about 20 feet in length. There are very few dug-outs on this lake. This discrepancy in craft arises because lake Kwania has relatively higher waves, yet this characteristic is not very pronounced on lake Kyoga.
Fishing on Lake Kwania is predominantly passive gillnet setting. The nets have a mesh range of 2.5 – 4.5 inch. and each boat carries only 3 to 4 nets at a time. This contrasts sharply with lake Kyoga main where active night and day fishing is the norm. Other fishing gear is the beach seine, used rampantly on most big landings of the lake. The industry on Kwania is basically a Nile perch fishery with Tilapia coming second. Other species caught include Protopterus sp., Clarias sp., Bagrus sp., Mormyrus sp. and a number of Tilapia hybrids. The present commercial species catch composition is as follows:
| Lates niloticus | 65% |
| Oreochromis niloticus | 13% |
| Others | 22% |
3. THE ADP CAS STRATEGY ON LAKES KYOGA AND KWANIA :
ADP is a resource assessment project geared towards appraising the present level of fish stocks in the lake Kyoga system. As such, the project's terms of reference do not embody the setting up of a coherent statistical system like the permanent statistical system being tried in Entebbe under the funding of UNDP/FAO. The data being collected now is tailored to suit biological stock assessment. In this way, ADP is only implementing a CAS that helps them collect data that is geared towards a specific objective. They are not all out to work on a defined statistical design and implement it. If this were the true objective behind their present effort on the lake, then a statistical proposal with a methodology and rules of procedure would be in frame. However, the information being collected to date and the ground experience being gained by the survey team is a tremendous boost to the required knowledge about the suitability of the present methods of data collection on the lake.
3.1 ADP METHODS AND PROCEDURES OF DATA COLLECTION :
The survey team is fully equiped with a fishing boat, camping equipment, CAS requirements like plastic pails for weighing, stationery, pencils and clipboards.
Upon reaching a landing, the team first seeks to see the resident fisheries staff on the landing. If there is no staff, contact is made with the head of fishermen (Gabunga) or the administrative chief of the area. The purpose of the trip is explained in detail to both fishermen and their chiefs before actual work can begin. The team prefers to camp in one place and use it as an operational station for at least three to four days before breaking camp to another place. A fisheries staff found at the landing may join the survey team on that landing. At the end of the day, he is paid some allowance for his assistance.
The team uses a combination of methods: ‘sampling’ and complete
enumeration of canoes. For every selected canoe the fish is
grouped by species and is all weighed using a small 100 kg.
scale.
The recorder also does the work of interviewing the fisherman and
also asks questions on number of gears used and days fished in a
week.
Knowledge of landing times for various landings is very important. In some landings, like Kayago, landing time is 4.30 am. To be able to get the best out of a day's survey activities, the team must wake up very early and mobilise to be at the landing. Forward planning is necessary before setting off to the next landing and reach there before boats have landed in order to get the best results. However, this is difficult where there are no established statistical criteria on which to base the selection of fish landings. The selection of landings to be sampled is opportunistic by merely following the coastline or just crossing to any nearby landing.
At big landings, a sample of boats is selected. The fish in any chosen boat is sorted by species and weighed. However, at smaller landings, all the fishing boats are enumerated. The fish in each boat is sorted by species and weighed. As recording of this information on the field forms takes place, the fisherman is interviewed on the number of days fished per week and the number of nets in that boat.
3.2 SOURCES OF BIAS IN THE COLLECTED DATA :
3.2.1. The timing of landing hours is most crucial in the sampling scheme of lakes Kyoga and Kwania. Fish is landed very early, even before day break. Sometimes, setting off very early at dawn will help arrive at the chosen fish landing just in time when boats start landing. When this is not done you easily end up with a situation where a number of selected days go without actual survey work being done. This is costly in terms of time and money.
3.2.2. The catch assessment on both lakes needs to take fishing methods and different gear into consideration when being executed. At a number of landings, a boat is used more than once in a day by different fishermen who use different gear, like beach seines and cast nets or those going into the lake in the afternoon to practice active fishing. In the normal sampling at the landings, this separation is not done. Thus, in the results obtained, the estimates given as catch per unit effort may be understated.
3.2.3. Inspection of the boat and gears before the sampling process begins should be emphasised. This is because a number of canoes arrive at the landings with some fish hidden in the nets or under the boat seats and covered with nets. Such fish in a day's sample, if not recorded, leads to loss of information.
3.2.4. The purchase of fish on water is very rampant on lake Kyoga. A transport boat buys from a number of canoes. Upon arrival at the landing, it may be sampled without interviewing the fishmongers on the question as to from how many canoes they may have bought the fish. This not withstanding, if the canoes from which the fish was bought arrive at the landing and have some fish, they may still be sampled. There is need for a set-up of a statistical standard on which to base the sampling of such canoes in order to reduce the present bias in the data collected.
3.2.5. The beach seiners are always reluctant to declare the actual catch. The fish, mostly Nile perch, is sorted on the water. The illegal size fish is hidden away. Only the size required by law is then declared.
4. PROBLEMS OF STATISTICAL DATA COLLECTION IN THE REGION :
4.1. The present level of statistical data collection on Lakes Kyoga and Kwania is far from satisfactory. Foremost is the absolute lack of statistical inputs like weighing scales, stationery, weighing sheds etc. at all visited landings.
4.2. The staff at most landings are the untrained Fish guards who are from time and again appointed by the RFO's. Each Fish guard may be in-charge of about five other landings. A number of them only collect qualitative data or scribble non intelligible data on scrap papers which subsequently can not even be understood by themselves. A number of them have no working knowledge of their work.
4.3. There is very poor coverage of landings to be sampled. A Fishguard who has many landings may visit a landing for purposes of data collection only once in a month and submit the data recorded to the visiting Fisheries Assistant for onward transmission to the Regional office. In one instance, the Fish guard and the Fisheries Assistant working on the same landings independently submit their estimates to the RFO. Their sampling activities can only be described as opportunistic.
4.4. The accuracy of the collected data is highly questionable in that the monthly estimates are made for all the 30 days when in fact the actual number of fishing days in that period of time is less. In reality, and according to interviews, there is variation in the number of days fished in a week between landings. The average number of days fished per canoe in a year needs to be ascertained in order to derive reliable annual estimates.
4.5. There is a crucial need to have trained fisheries staff at the grass roots do their work at assigned landings. In all landings visited there was no resident AFDO or FA despite the fact that these regions have these respective officers. Those assistants whom the team met live in urban towns of Lira and Apach. The AFDO in-charge of Apach District came down to join us after hearing that the team was in his region.
4.6. The regional data and information summaries are presently inadequate. A quick review of the months on which statistical data were submitted to the headquarters in 1990 shows only three months in that year! These reports show gaps and do not use a uniform format from month to month. They look to be hastily put up to fulfil submission requirements at the headquarters. No attention is given to detail in analysis or even accounting for the minimal coverage of landings from month to month.
4.7. The ADP scheme of survey on these lakes is presently restricted only to project personnel. There is no linkage with RFO's or even FA's at the landings. Thus, the whole purpose of a CAS methods and procedures will never be replicated anywhere on the lake when such a project ends. If continuity of sustaining CAS method is to be maintained, there must be an accelerated integration of these staff in the foreseen training seminars and workshops by the ADP. This step will impart to them useful skill which they can put to use upon return to their stations.
APPENDIX I : LIST OF ADP STAFF AND OTHER FISHERIES STAFF MET IN THE FIELD.
| 1. | D. Kibwiika | F.O | ADP/Counterpart. |
| 2. | J. Kedi | AFDO | ADP Survey team. |
| 3. | G. Odong | AFDO | ADP Survey team. |
| 4. | H. Ziraba | coxwain | ADP Survey team. |
| 5. | J. Gonga | Technical | Assistant survey team. |
OTHER FIELD STAFF.
| 1. | I. Okori | FA | i/c Nabieso area. |
| 2. | J. Odong | F/G | Dogbot/Atuma/Agweng Landings. |
| 3. | S. Tibby | AFDO | Akokoro county. |
| 4. | E. Bua | F/G | AOA Landing. |
| 5. | T. Gao | FA | Ayei Landing. |
| 6. | P. Ebong | F/G | Wigweng/Wansolo Landings. |
| 7. | P. Ebange | FA | Kayago Landing. |
APPENDIX II: ITINERARY FOLLOWED DURING THE KYOGA TRIP :
| 22– 23rd Nov, 90 | - | Entebbe - Jinja - Bukungu- Kayago Landing. |
| 24th | - | Work at Kayago Landing. |
| 25th | - | Work at Atuma Landing. |
| 26th | - | Work at Nabieso and Agweng Landing. |
| 27th | - | Work at Apok Gor Landing. |
| 28th | - | Work at Odiedo Landing. |
| 29th | - | Work at Ogwil Landing. |
| 30th | - | Work at Abebe and Aoa Landing. |
| 1st– Dec, 90 | - | Work at Kachum and visit Bambara Landing. |
| 2nd | - | Work at Ayei and Wigweng Landings. |
| 3rd | - | Work at Wansolo and depart to Bukungu. |
| 4th | - | Depart Bukungu - Jinja - Kampala - Entebbe. |
TABLE 1 : FISH PRODUCTION ESTIMATE FOR LAKE KWANIA, 1990.
(wt. in m.tons)
| SPECIES LANDINGS | Lates | Tilapia | Protop. | Mormy. | Clarias | Bagrus | Total |
| Owinyi | 10.8 | 1.20 | 0.1 | 12.1 | |||
| Abebe | 3.2 | 1.2 | 0.002 | 0.001 | 4.40 | ||
| Ogwil | 2.5 | 7.8 | 0.03 | 0.04 | 10.4 | ||
| Aromi | 1.01 | 8.6 | 0.02 | 0.04 | 9.8 | ||
| Dogbot | 2.0 | 9.4 | 0.06 | 0.03 | 11.5 | ||
| Agela | 1.1 | 0.21 | 0.06 | 0.2 | 1.6 | ||
| Atuma | 0.23 | 0.1 | 0.01 | 0.003 | 0.34 | ||
| Abali | 5.6 | 1.6 | 0.21 | 7.41 | |||
| Ayira | 2.0 | 1.52 | 0.08 | 0.2 | 3.80 | ||
| Gweng | 3.6 | 1.32 | 0.05 | 0.04 | 5.01 | ||
| Abei | 11.4 | 1.63 | 0.07 | 0.22 | 13.32 | ||
| Kiga | 1.6 | 2.80 | 0.40 | 0.25 | 0.4 | 0.04 | 5.5 |
| Wansolo | 6.5 | 53.9 | 10.1 | 0.5 | 0.25 | 71.3 | |
| Wigweng | 47.5 | 17.1 | 11.5 | 0.21 | 0.60 | 0.05 | 77.01 |
| Ayei | 970 | 185 | 18.3 | 0.08 | 0.04 | 1173 | |
| Kwibale | 14.5 | 10.0 | 0.7 | 0.02 | 0.11 | 0.3 | 25.7 |
| Akokoro | 4.5 | 52.5 | 0.7 | 0.04 | 0.02 | 0.005 | 57.76 |
| Totals | 1088 | 355.9 | 42.4 | 0.60 | 2.44 | 0.64 | 1490 |
| Estimate | 4352 | 1424 | 169.7 | 2.4 | 9.8 | 2.56 | 5960 |
Source : Fisheries Department, Monthly Reports 1990.
TABLE II : BEACH SALES VALUE FOR LAKE KWANIA, 1990.
(Value in m.ush)
| SPECIES LANDINGS | Lates | Tilapia | Protop | Mormy. | Clarias | Bagrus | Total |
| Owinyi | 0.04 | 0.01 | 0.01 | 0.05 | |||
| Abebe | 0.13 | 0.01 | 0.01 | 0.003 | 0.15 | ||
| Ogwil | 0.15 | 0.50 | 0.003 | 0.005 | 0.65 | ||
| Aromi | 0.05 | 0.50 | 0.003 | 0.003 | 0.56 | ||
| Dogbot | 0.40 | 0.09 | 0.01 | 0.005 | 0.50 | ||
| Agela | 0.05 | 0.05 | 0.02 | 0.01 | 0.14 | ||
| Atuma | 0.06 | 0.01 | 0.004 | 0.001 | 0.07 | ||
| Abali | 1.01 | 0.55 | 0.02 | 1.58 | |||
| Ayira | 0.22 | 0.13 | 0.01 | 0.01 | 0.37 | ||
| Gweng | 0.44 | 0.15 | 0.003 | 0.004 | 0.60 | ||
| Abei | 1.05 | 0.22 | 0.004 | 0.01 | 1.28 | ||
| Kiga | 0.30 | 0.90 | 0.02 | 0.07 | 0.11 | 0.003 | 1.40 |
| Wansolo | 16.20 | 7.60 | 0.81 | 0.07 | 0.04 | 24.78 | |
| Wigweng | 15.58 | 8.20 | 0.65 | 0.04 | 0.8 | 0.002 | 25.29 |
| Ayei | 120 | 37.00 | 2.80 | 0.01 | 0.06 | 159.87 | |
| Kwibale | 0.80 | 12.57 | 0.06 | 0.003 | 0.01 | 0.04 | 13.49 |
| Akokoro | 0.55 | 10.50 | 0.07 | 0.004 | 0.003 | 0.001 | 11.13 |
| Totals | 157 | 79.07 | 4.50 | 0.12 | 1.10 | 0.09 | 241.93 |
| Estimate | 628.2 | 316 | 18 | 0.48 | 4.4 | 0.36 | 967.7 |
Source : Fisheries Department, Monthly Reports 1990.
ANNEX 1: SOME PROMINENT LANDINGS ON LAKES KYOGA AND KWANIA.
![]()
![]()
![]()