by
V.A. Shevchenko
Institute of General Genetics
Academy of Sciences
Moscow, U.S.S.R.
Any group of intrabreeding organisms united by heredity structures is called a population. Evolution and selection affect the genetic structure of populations. Heredity laws, new mutations, natural and artificial selection and a number of other phenomena are characterized by exceptional complexity of the reproductive conditions of entire populations. Research in this field has brought about a new branch of science - population genetics. The beginning of modern population genetics dates from 1908 when Hardy and Weinberg independently published their works dealing with intrabreeding populations. They mathematically proved that any population by its genetic structure is subject to the Mendelian laws of heredity, which in this case hold not only within the limits of a single cross, but in the whole group of organisms, the heredity of which was affected by intrabreeding during the entire history of the population. Regularities in the distribution of genotypes occurring, in this case, in populations, are known as the Hardy-Weinberg law and are the basis for analysis of genetic structure of populations. However, the rise of population genetics as a new branch of science dates from 1926 when S.S. Tschetverikoff published his work “On some features of evolution from the view-point of modern genetics”. This work not only showed the importance of the Hardy-Weinberg law for population genetics, but formulated the main principles of genetics of populations and showed their importance in the analysis of problems of evolution. Later, a number of investigations were made which laid the foundations of the theory of modern population genetics. From 1930 to 1932, the following works were published: In 1930 - “Genetical Theory of Natural Selection” by R. Fisher; in 1931 - “Genetico-automatic Processes and Their Role in Evolution” by N.P. Dubinin and “Evolution in Mendelian Populations” by S. Wright; in 1932 - “The Causes of Evolution” by J.B.S. Haldane and “Genetic Structure of the Species and its Evolution” by N.P. Dubinin and D.D. Romashov. In the same years, experiments with wild populations of Drosophila carried out by S.S. Tschetverikoff and others (1928) and N.P. Dubinin and others (1930–1936), laid the foundations of experimental analysis of the problems of population genetics.
In the 30 years that followed, and especially in the recent decade, population genetics made great progress. During this time the factors ensuring the prosperity of species and their population were discovered, and the problems of evolution, and theory and methods of selection were raised to a new level.
Analysis of a simplified model of a population will help to reveal the main characteristics of populations without taking into account integrative aspects of the genotype, multiple alleles, temporary effect of different evolutionary factors and other complicated phenomena. We shall assume that it is possible to pick out a single locus from its environment and place it in any conditions we like.
Populations consisting of specimens that cross with each other are usually called Mendelian populations. A population is called panmictic if its specimens cross at random. Within the limits of such a population each specimen has an equal chance to mate with any specimen of the opposite sex. The expectant frequency of crossings of the given type is equal to the product of the frequencies of males and females of the respective types.
Evidently, complete panmixia in natural conditions does not exist or occurs very rarely. One of the reasons for this is that related specimens live close to one another and therefore mate more frequently. In such cases, pairs do not mate at random, and the genetic structure of the population includes some element of inbreeding.
Before proceeding to analyse regularities of allele distribution in the population, it is necessary to introduce some genetic terms which will be required later. Serebrovsky has defined the totality of genetic information of the given population as “gene pool” of the population. We shall deal only with distribution of information concerning a particular locus in the gene pool.
One of the main notions of population genetics is gene frequency. Assuming that the locus in question is represented by two alleles (A and a) and that there are N diploid specimens, D may stand for the amount of homozygotes of one allele of the given locus (AA), H for the amount of heterozygotes and R for the amount of homozygotes of the other allele (aa). Thus we can state that there are three types of specimens, which together bear genes of two types, and that D+H+R=N. The amount of A genes (P) in the population is:

This proportion is known as the gene frequency of A. The frequency of the other allele (a) is usually denoted by q. As in the given locus, there are only two alleles p+q=1 and hence q = 1 - P.
Genetic structure of populations fulfills two main purposes which are vital for any species. The first purpose is to secure the ability of the population for expedient or adaptational reaction to changes in the environment, preserving its genetic structure, i.e., genetic homeostasis. Genetic homeostasis depends on a number of adaptational systems within the genetic system of the whole population. Knowledge of the genetic system of populations is necessary for understanding the hereditary system that affords adaptability of organisms to concrete present-day environmental conditions. The second purpose of the genetic system of populations is to secure stable hereditary flexibility, i.e., ability to unlimitedly evolve in reaction to future changes in the environment. This is conditioned by the fact that genetic systems of populations are initially based on a versatile process of mutation. Ability for unlimited evolution may be defined as evolutional homeostasis. Loss of the evolutional homeostatic system of a species, caused by different factors, results in the extinction of the species.
In any intrabreeding population each pair of alleles (A,a) has quite regular correlations of genotypes (AA, Aa and aa) described by Hardy and Weinberg (1908) and known as the Hardy-Weinberg law. This law is formulated as follows. If in a large panmictic population there are alternative forms of an autosome gene, without mutation, selection and differential migration, the initial numerical correlations of these alleles (P1, P2, P3… Pn) will be the same from generation to generation; and after one change of generations, the frequency of genotypes will again obtain an equilibrium state. Equilibrium frequencies of genotypes correspond to the terms of the expression obtained by squaring the formula (P1+P2+P3+… Pn).
Under these conditions Mendelian populations are characterized by genetic inertia. If mutation, selection, certain changes in the choice of parent pairs, and reduction of the size of the population cause no imbalance, the genetic structure of the population remains unchanged.
In natural populations such conditions are unobtainable, though the analysis of the distribution of alleles in an unlimitedly large population under these conditions reveals the main tendencies of the distribution of genotypes in natural populations and provides a basis for understanding the role of disturbances caused by the above-mentioned factors.
The Hardy-Weinberg law describes the regular ratio of homozygotes and heterozygotes for any random mating population. This regular ratio forms the basis of the concentration of genes in the population. Gene concentration is related to the frequency of genes in the population. If the amount of the dominant gene A in a population is P, its recessive allele in the same population has naturally a concentration equal to 1 - p or q.
Equal distribution of genes among males and females results in the fact that among ova as well as among spermatozoa, we find gametes out of which p bear A genes and q gametes bear a genes. Table 1 gives the most probable recombination of male and female gametes when intrabreeding.
Table 1
| Sperm | Ova | |
| pA | qa | |
| pA | p2AA | pqAa |
| qa | pqAa | q2aa |
By summing up the data of the table, we obtain p2AA + 2qpAa + q2aa. This expression is the formula of the Hardy-Weinberg law. According to this formula, the amount of heterozygotes is equal to the double product of the concentrations of both alleles.
When dealing with populations existing in reality, determining the genetic concentration proves to be difficult due to the fact that many genes turn out to be recessive and their concentrations in populations are very low.
For instance, albino frequency, i.e., frequency of white-haired and red-eyed specimens, averages 1 : 20 000. From the genetic point of view, human albinos are specimens of homozygotes of the recessive gene d which causes complete absence of pigment. Among normal individuals there are homozygous specimens with the normal allele DD and heterozygous ones with Dd. We can determine the concentration of gene D and find the number of heterozygous individuals whose offspring will be albino. The concentration of the gene d (albinism) is:

The concentration of the gene D (with pigment) is equal to:

The frequency of homozygotes of the dominant allele (DD) is equal to

The frequency of phenotypically equal heterozygotes (Dd) is equal to

Thus, in spite of the fact that albinos (homozygotes dd) occur in human populations with a frequency of 1:20 000, the frequency of heterozygotes (Dd) of individuals who beget albino offspring averages 1:70. This shows that even with a small number of homozygotes the number of heterozygotes in a population necessary for their emergence is relatively great. In marriages of relatives the probability of meeting heterozygotes resulting in the emergence of different defective genes increases abruptly.
Distribution of genotypes in a population depends on the concentrations of the dominant allele (p) and of the recessive allele (q). Changes in concentrations of alleles distributed around 0.5 do not essentially affect the number of heterozygotes (Fig.1). Frequencies of heterozygotes begin to undergo noticeable changes only in cases of considerable variation in concentrations of alleles. This relationship has been determined by Lush (1945).
If in a population there are specimens of different genotypes, their crossing is quite probable. It is evident that changes in concentrations of alleles determine the probability of meeting specimens of different genetic structure. Obviously if in a population both males and females of genotype (AA) occur in the concentration p2, the probability of their crossing is p2 × p2 = p4. In addition to the crossing of homozygotes with the dominant allele (AA × AA) and the recessive allele (aa × aa) four more types of crossing may occur: Aa × Aa; AA × Aa; aa × AA and Aa × aa. For each crossing-type it is possible to calculate its probability for populations with different concentration of alleles. In Fig.2 are shown curves drawn according to Lush, illustrating the ratio of frequencies of different crossings in populations with concentrations varying from 0 to 1. We can see the pattern of these relations and notice that irrespective of the value of concentrations of genes, the frequency of meetings of heterozygotes (Aa × Aa) is always twice as high as the frequency of meetings of homozygotes (aa × aa, AA × AA).
In combinative variation when along with a pair of alleles (A and a) we find another independent pair (B and b) or a few pairs of alleles, there manifests the law of probable distribution by three-term formulas for each independent allele. In this case even if such a population happens to lose its equilibrium state, i.e., its relative concentration of alleles changes but it will again obtain a state of equilibrium within one generation.
The crossing which transforms the former equilibrium distribution of population genotypes into a new equilibrium state based on new relative concentrations of alleles is known as stablizing-cross.
It goes without saying that in real populations none of the conditions necessary for the realization of the equilibrium law is observed. It does not, however, mean that the Hardy-Weinberg law ceases to be important. The formula of the distribution of genotypes in a population is of utmost importance. Analysis of this formula allows the genetic structure of a population to be revealed by ascertaining concentrations of different alleles. However, this formula holds only for a single frame (the present generation) of a continuous film with which may be compared the dynamic development of generations. This permanent development in the genetic structure of populations associated with isolations, migrations, mutations and selections is the internal side of all life processes of different units of the species in different parts of its habitat.
One of the most evident characteristics of any population is the number of individuals at the given moment. Very large populations may number billions of specimens (micro-organisms, algae and fish populations) or less than a hundred specimens, as with populations of rare endemic plants. The number and distribution of specimens in large populations are permanently changing and the rate of this process is varying. Changes in the size of the population bear various effects on its evolution. Thus the size of the population affects the tempo of random oscillations in the concentrations of alleles caused by probable disturbances characteristic of any limited group of specimens.
Dubinin, Romashov and Wright established that stationary concentrations of alleles in conditions of absence of mutations, selection and migration are impossible in principle. They showed that in any limited population, concentrations of alleles undergo quite stochastic changes which result from errors in the limited choice of gametes under the emergence of the next generation. These phenomena are known as genetic-automatic processes (S. Wright called them “random genetic drift”).
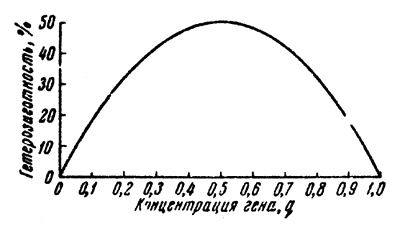 | 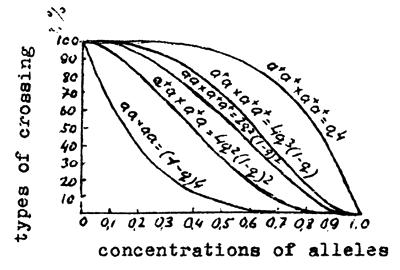 |
Fig.1 Relative distribution of frequencies of heterozygotes under different concentrations of alleles | Fig.2 Frequency of different types of crossing in populations under different concentrations of genes |
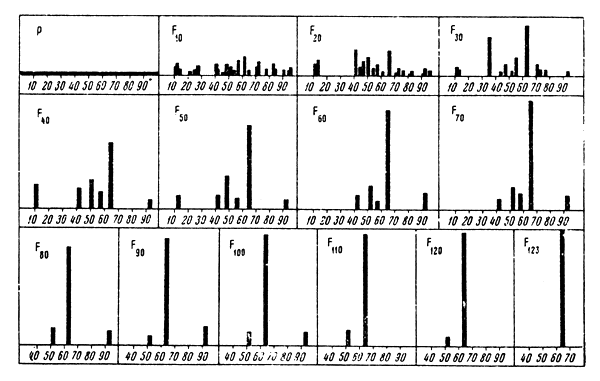 | Fig.3 Fluctuations in concentrations of genes based on genetic-automatic processes. Model size: 50 specimens/100 alleles |
Fig.4 Fluctuations in concentrations of genes based on genetic-automatic processes. Model size: 5 specimens/ 10 alleles | 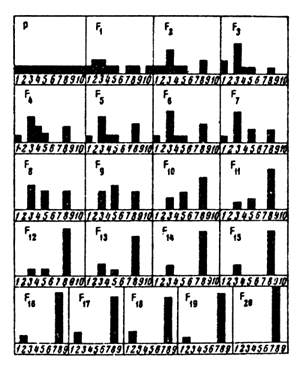 |
This process is based on the fact that in a limited population the given concentration of genes from generation to generation is conveyed not absolutely in the same proportion (as assumed on the basis of Hardy's equilibrium law), but only as a mathematical expectancy. In other words, in a limited population with any initial concentration of the gene, there is always a certain probability of a change in this concentration in the next generation in the positive or negative direction. The above statement is of decisive importance in the analysis of the main processes occurring in a limited population, as any change in the initial concentration is of consequence in the further destiny of the gene. This change brings the concentration to a new level which is the starting point for subsequent development. Non-direction of changes in the concentration is often a cause of the complicated course of these changes, which as a rule take place in many successive stages of different directions. At the same time these occasional oscillations through rather a large number of generations result in a development that leads to radical changes in the structure of the population, since after a number of successive random drifts the initial concentration may greatly deviate from its initial value. As a result of this, these deviations in a limited population result either in elimination of the gene (0 percent concentration) or in its domination in the population (100 percent concentration); i.e., in both cases the population ultimately becomes homozygous. This transformation is inevitable, because in any limited population there is ultimate probability of the whole succession of changes in the concentration (the process is non-directional in each stage) from any initial state to homozygous, though very often this ultimate probability is a very small value. However, this ultimate probability is always present, and if so, it must be realized throughout a large number of generations.
The inevitable realization of this probability directs the whole random motion of alleles in such a way that without mutational development or any form of selection, any limited population through the mechanism of random mating throughout a certain average number of generations comes to the homozygous state through one or another allele. This process is very important for the understanding of the main phenomena taking place in gene composition of a population and may be defined as isogametation (extinction of variation). Mean duration of isogametation and consequently the rate at which it occurs, i.e., the reciprocal of the duration of isogametation, depends on the size of the population.
Dubinin and Romashov (1932) carried out two series of statistical experiments with models of uniformly multiplying populations with 100 percent initial variety of alleles. In the first series of experiments the initial pool consisted of 100 balls with different numbers. Each drawing comprised 25 scoopings, two balls being taken at a time. The number of the first of the two balls stood for the perishing allele and the other for the multiplying allele. Thus in each generation 25 percent of the balls were removed from the pool and the other 25 percent doubled. Drawings were carried on until all the balls in the pool had the same number, i.e., when the whole population became homozygous. The second series of experiments differed from the first one in the size of the population. In this case the initial pool consisted of 10 different balls.
The drawings showed that mean duration of isogametation in the first series was equal to 268 generations. Fig.3 gives the results of one of the experiments of this series. It can be seen that in the 123rd generation there is only one allele from the initial 100 percent variety which seizes the whole population.
In the second series of experiments, which differed from the first in that the size of the population was 10 times less, the mean duration of isogametation was equal to 29 generations. Fig.4 shows the results of one of these experiments. Isogametation in the given case goes through 20 generations. In conditions of uneven multiplication, genetic-automatic processes occur most intensively.
The general scheme of uneven multiplication in stationary conditions from generation to generation and the numerical size of a population may be described in the following way. Each mating parent pair leaves a very great number of zygotes whose independent probability of survival is very low. Ultimately on the average only one pair of the offspring of a parent pair manage to survive in the next generation. But this is only an average estimation and the actual importance of various pairs for the next generation is different. There are pairs which leave no offspring and there are those that leave one, two, three or more offspring. This form of reproduction, which is dominant in a population with a stationary numerical size, was mathematically analysed by Fisher (1930) and Wright (1931). Fisher has proved that in this case with small concentrations of genes varying from individual genes to concentrations giving rise to homozygous forms it is possible, with a certain approximation, to apply Poisson's series. On the basis of this series it proved possible to calculate the rate of elimination and replacement of genes. Table 2 shows that with this form of multiplication the number of mutant genes lost by the population in each generation is equal to 37 percent (in evenly multiplying populations this amount comprises 25 percent). This value also affects replacement and multiplication development of other genes.
Table 2
Probability of elimination and preservation of individual mutations in an unevenly multiplying population with a stationary numerical size calculated according to Poisson's series.
| Generation | Probability | Average number of genes in preserved mutations | |
| elimination | preservation | ||
| 1 | 0.3679 | 0.6321 | 1.58 |
| 3 | 0.6259 | 0.3741 | 2.67 |
| 7 | 0.7905 | 0.2095 | 4.77 |
| 15 | 0.8873 | 0.1127 | 8.87 |
| 31 | 0.9411 | 0.0589 | 16.98 |
| 63 | 0.9698 | 0.0302 | 33.11 |
| 127 | 0.9847 | 0.0153 | 65.36 |
| . | . | . | . |
| . | . | . | . . |
| . | . | . | . |
| . | . | . | . |
| n | 1 – | ||
According to Fisher, with a great number of generations the probability of preservation
for an individual mutation is ![]() , and the mean number of mutations preserved in n
generation is
, and the mean number of mutations preserved in n
generation is ![]() .
.
In small populations genetic-automatic processes may be of essential importance and in large populations they may be insignificant. For instance, in a population numbering 50 specimens these processes will be 100 times more intensive than in a population numbering 5 000 000 specimens. This example relates to the multiplying part of the population, which is the group of mature specimens of the given generation which are able to produce offspring. For instance, Fig.5 shows two quite different types of populations with equal values for living populations and different multiplying parts. The difference in the rate of isogametation in both populations is very great and is in inverse relation to the value of their multiplying parts. In the four populations shown in Fig.6 the rate of isogametation is equal inspite of great difference in the values of living populations as the multiplying parts of these populations are equal.
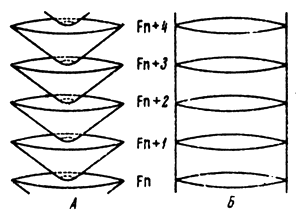 | 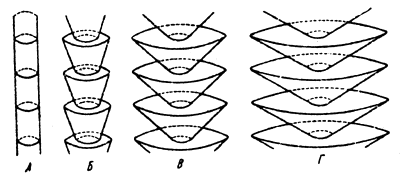 |
Fig.5 Populations with different ratios of living and propagating parts; under great difference (a) and equality of parts (B) | Fig.6 Four types of populations with different ratio of living and propagating parts. |
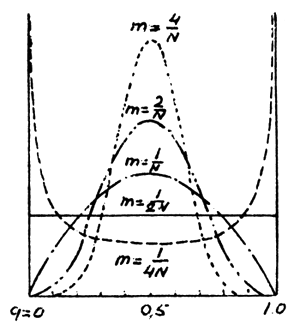
Fig.7 Distribution of gene frequencies among different populations under gene frequency of immigrants: p=q=0.5
So it is possible to conclude that genetic-automatic processes continue throughout the life of a population. They take place in populations of stationary numerical size. They are especially intensive in periods when the multiplying part of the population decreases. This period is characterized by an abrupt change in the whole genetic composition of the population. The same processes take place with increasing numerical size of the population. Even though in this case they are very slow, they facilitate uninterrupted differentiation of the hereditary content of the species, and determine the continuous development of the genetic composition. Thus the study of genetic-automatic processes radically changed the conception that inside a population there is a stationary ratio of genes based only on the equilibrium properties of the genotypes surviving throughout any number of generations.
One of the interesting consequences of the theory of genetic-automatic processes is the analysis of the processes taking place when populating new territories by a limited group of migrants or even by one fertilized female.
Mayr (1942) formulated the so-called principle of the founders of the population. According to him the population that forms due to the populating of a new territory has only the alleles that were brought by the migrants that founded the population. These alleles are only a small part of the total genes of the initial large population. As a result of this, in individual colonies, in populations at the periphery of a species, habitat, etc. occur genetic differentiation and speciation. The role of such populations in the evolution of the species may be considerable.
One of the properties of a population, which is not characteristic of its organisms, is distribution in space. Generally speaking, the distribution area is the minimum geographical area including all territories which in usual conditions are populated by the given organisms. Populating of a territory by different organisms is uneven. Unevenness of geographical distribution of specimens is usually accounted for by inter-relations of the organisms with animate and inanimate components of the environment.
Of basic importance for the dynamics and history of the hereditary pattern of populations of a species are different forms of isolation and, contrarily, the migrations connected with the mixing of populations.
In reality there are no species which are of united intra-breeding populations. Within the ecological-geographical area each species, due to various factors of both complete and incomplete isolation, falls into a great number of populations that comprise a species.
Isolation factors determining the segregation of the species into more or less independent populations are of great variety. For instance, very frequent are isolations caused by physical barriers such as mountains, islands, etc. Of interest is isolation of generations in time. Then we should mention physiological isolation. Physiological isolation is expressed in the form of the border of fertility, owing to which new deviations prove to be more fertile when mating with each other than with the initial form. In this case, in the same habitat appear several groups of specimens physiologically isolated from each other.
Of great interest is ecological isolation resulting from the adaptation of the species to the specific conditions of the station in which it lives. Stations do not completely cover the habitat, which results in the isolation and disintegration of the species. This form of isolation most evidently occurs on the borders of the habitat which break as the stations wedge themselves in the border areas of the adjacent ecological-geographical region.
Lastly, of great importance is partial isolation in vast, densely inhabited areas. This isolation occurs because of the limited mobility of the specimens. Thus each species is a complicated system of reasonably isolated populations of various dimensions. In each of these populations occur clearly directional genetic-automatic processes which account for the great differentiation of the genetic material of the species in the numerous isolates.
However, along with isolations, all forms of which have not been described in this short report, each species is affected by factors quite opposite to isolation, leading to the mixing of populations and to a certain state of real panmixia. This mixing takes place on the borders of incompletely isolated populations and increases with more or less considerable movements of specimens or whole populations, and finally reaches its climax in periods of migrations resulting from abrupt increase in the numerical strength or changes in the environment in critical periods of the life of the species. Waves of panmixia in different periods of the life of the species spread over its habitat, uniting to some extent disintegrated populations into a united whole. Panmixia, of course, does not cause simultaneous and complete integration of all the populations of the species all over its distribution area. A wave of panmixia (for instance, in the dispersal of adaptational forms from a certain nidus) is immediately followed by disintegration of the species into individual populations.
Mixing of populations is characterized by processes quite opposite to those described for isolation. Integration results in abrupt decrease in concentration of individual genes which were characteristic of individual populations. Different genes evenly disperse throughout the whole population, and the phenotypic differences which were quite distinct before begin to disappear due to the common phenotypic homogeneity of the species. Ultimately migrations result in a certain mean concentration for each mutation in all the populations. Calculations have shown that the rate of the process of smoothing the unevenness of concentrations of genes is subject to the following formula:
∆q = m(q - qm)
where m is the number of migrating specimens divided by the value of the population which takes them, q is the frequency of genes in this population and qm - the frequency of genes in the immigrating group.
Fig.7 shows the distribution of gene frequencies with varying m or N, the gene frequency of immigrants being equal to 0.5. Curves similar to those in the figure are known as stationary distributions of frequencies. Each curve is the function of the density of probabilities of the following series:
y - Cq4Nmqm-1 (1-q)4Nm(1-cm)-1
where C is uniformity multiplier and the rest of the symbols stand for the same values as above. Such a function may show the pattern of the distribution of probabilities of possible developments. The area under each curve is equal to 1, and the area between any length of the curve and the corresponding length of the X-axis (axis q) corresponds to the probability that gene frequency will be within the limits of the length q.
Thus it is quite clear from the figure that under the given conditions, the probability
of q lying within the limits of 0.4 and 0.6 with ![]() is far less than with
is far less than with ![]() .
.
Calculations have shown that there is a critical value of migrations below which the
distribution of concentrations of genes occurs under a certain effect of genetic-automatic
processes, and above which processes of mixing of populations and levelling of concentrations
of genes begin to prevail. This value is equal to ![]() (N stands for the multiplying
part of the populations). It means that it is enough for the populations to exchange only
one specimen in a generation and the differentiating effect of genetic-automatic processes
will retreat under the levelling influence of migrations.
(N stands for the multiplying
part of the populations). It means that it is enough for the populations to exchange only
one specimen in a generation and the differentiating effect of genetic-automatic processes
will retreat under the levelling influence of migrations.
The type and volume of migratory genetic information (flow of genes) inside the population or among populations are an important factor in determining their evolution. When members of a group of semi-isolated sub-populations exchange genetic information (island model) at random, it is quite different from the situation when a one-way flow of genes occurs along the linear successions of sub-populations (flow model). In their turn they both differ from the third situation where a group of organisms is uninterruptedly distributed over a large area. Though it is possible that in this case there may be no semi-discrete groups of specimens, the probability of mating of two remote specimens may be very slight due to their mutual remoteness. According to Wright (1931), local differentiation inside such a population depends mostly on the size of panmictic concentrations which comprise this population. A population divided into semi-isolated sub-populations, with some elements of inbreeding characteristic of the population as a whole, will have a decreasing frequency of homozygotes.
It is necessary to note that a one-sided, abrupt and prolonged effect of isolation leads to negative consequences. In such conditions genetic-automatic processes facilitate the disintegration of the population into groups with different divergent genetic systems which are not adaptationally important.
On the other hand, unlimited migrations leading to the mixing of species populations are also a drag on evolution. In this case the emergence of gigantic united populations with uniform distribution of mutations occurring in accordance with the laws of their low concentrations becomes the cause of a very slow rate of evolution of such forms.
Maximum evolutionary flexibility of a species is gained on the basis of the differential dynamic system which emerges under the optimal correlation of the isolation and mixing of populations.
Thanks to the optimal correlation of isolation and panmixia, the hereditary content of the species is permanently in a state of tension resulting from dynamic condensation of concentrations of genes and different ecogenotypes.
The optimal correlation of isolation and migrations creates a gigantic trial and error mechanism for individual populations of the species, which is the basis for the progress of the species.
As a rule, the frequency of direct mutations is many times as high as the frequency of back mutations. Thus, due to recurrent mutation pressure, populations absorb certain mutational forms. However, owing to back mutations, the pattern of the pressure is characterized by factors of direct and reverse mutation occurring in opposite directions. Each gene mutates from a wild normal allele to a mutational allele and each mutational allele mutates to another allele or back to the normal state. In large populations without selection, the correlation of the number of normal genes and their mutational alleles will depend on the correlation of the rate of direct and reverse mutation. Let us denote the concentration of the dominant allele (A) by q; then 1-q is the concentration of the recessive allele (a), u is the frequency of mutations from the dominant allele to the recessive (A → a) and V the frequency of mutations from the recessive allele to the domiant (a → A). It is quite clear that the number of certain mutations in a population depends on the distribution of the given allele in the population. It is expressed as the product of the rate of mutation and the concentration of the gene (uq) for direct mutation and V(1-q) for reverse mutation. If mutations occur in the same direction, that is, if only recessive alleles emerge from dominants (A → a) and back mutations do not occur, then the whole population is gradually filled with the gene a. Under such conditions the allele A will be completely eliminated under mutation pressure. However, such cases are very rare. As a rule, both direct and reverse mutations occur.
The correlation of frequencies of direct and reverse mutation is of great importance for the distribution of mutations in nature. Denoting the rate of changes in the concentration of the gene under mutation pressure by ∆ q we shall obtain the equilibrium concentration when ∆ q = 0 (in neutral mutations).
If direct and back mutations occur at the same rate the equilibrium concentration will be established when the number of normal alleles in the population equals the number of mutational alleles (q=1-q=0.5). With an unequal rate of direct and back mutations, the equilibrium concentration will depend on the difference in the rate of mutation. For instance, if the rate of one mutation type is 100 times as high or as low as that of the other mutation type, the equilibrium concentration will be q = 0.991 and 1 - q = 0.009. Hence 99.1 percent of chromosomes in the population will bear the gene A and 0.9 percent the gene a. If the equilibrium concentration is broken, the population, after successive changes in the concentrations, will again reach an equilibrium state. The rate of these changes (∆ q) is determined by the formula
∆ q = V(1 - q) - uq
or by the number of direct mutations V(1-q) minus the number of back mutations (uq).
However, neutral mutations are rare. Most mutations are subject to selection. Thus the main factor in the mutation pressure at the moment of absorbing mutational forms is natural selection, which eliminates the majority of mutations.
A short outline of evolutionary processes in relation to population genetics has been presented. One of the fundamental concepts of biology is the Hardy-Weinberg law, according to which the frequencies of alleles in autosome loci in ideal populations without evolutionary factors do not change, and the quantitative correlations of genotypes within one generation gain an equilibrium state. The Hardy-Weinberg law is the starting point of the whole population genetic analysis.
The discovery of genetic-automatic processes (occasional drift of genes) has introduced statistical principles in the analysis of the destiny of mutations in a population. The tempo of oscillations in concentrations of alleles caused by probable disturbance is inversely related to the size of the population. When analyzing the drift of genes we disregarded the processes of mutation, selection and migrations. We have analyzed isolated populations of different sizes.
When treating populations bound to certain real conditions of different qualitative importance will be the occasional drift of genes. Its influence on the destiny of the genetic content of these populations will depend on the mechanism of isolations and migrations.
Isolated populations are characterized by clearly directional genetic-automatic processes which result in great differentiation of genetic material of the species in numerous isolates.
With mixing of populations, the concentrations of genes characteristic of individual populations abruptly decreases. In each population there occurs a certain mean concentration for each mutation. In real conditions there is interaction of these opposite processes. This interaction of isolations and migrations is one of the most important factors of evolution.
One of the factors impeding the Hardy-Weinberg equilibrium is mutation. It has been shown that in a population meeting all the requirements of the Hardy-Weinberg equilibrium except the requirement for the absence of mutations, the equilibrium value of the gene frequency is determined by the rate of direct and back mutation in the given locus.
Treating populations as changing and interacting systems characterized by gene frequencies allows the data to be analysed with a certain precision. In natural populations gene frequency in any locus is subject to the combined effect of a number of factors. The task of future investigations is to calculate the combined effect of all evolutionary factors (depending on the environment) which are exerted on the whole genotype.
The development of computing techniques makes it possible to hope that this task will be solved. At present we have to be satisfied with manipulating models which are only a rough approximation of the original.
Dubinin, N.P., 1931 Genetico-automatic processes and their role in evolution. J.exp.Biol. (Russian), 7:463–79
Dubinin, N.P. and D.D. Romashov, 1932 Die genetische struktur der Art und ihre Evolution. Biol.Zh., 1:52–95
Dubinin, N.P. et al., 1936 The genetical structure of the population and its dynamics in wild Drosophila melanogaster. Biol.Zh., 5:939–76
Fisher, R.A., 1930 The genetical theory of natural selection. Clarendon Press, Oxford
Haldane, J.B.S., 1932 The causes of evolution. Harper & Bros., New York and London
Hardy, G.H., 1908 Mendelian proportions in mixed populations. Science, 28:49–50
Lush, J.L., 1945 Animal breeding plans. 3rd ed., Iowa State Coll. Press, Ames
Mayr, E., 1942 Systematics and the origin of species. Columbia Univ. Press, New York
Tschetverikoff, S.S., 1926 On certain features of the evolutionary process from the viewpoint of modern genetics. J.exp.Biol. (Russian), 2:3–54
Tschetverikoff, S.S., 1928 Uber die genetische Beschaffenheit wilder Populationen. Z. indukt.Abstamm.-u.Vererb Lehre, Suppl. Bd.II
Weinburg, W., 1908 Uber den Nachweis der Vererbung beim Menschen. Jh.Ver.Naturk.Württemb., 369–82
Wright, S., 1931 Evolution in Mendelian populations. Genetics, 16:97–159