 |
food outlook | No.2, June 2005 |
| global information and early warning system on food and agriculture(GIEWS) | ||


|
Roundup
Latest indications continue to point to a decline in global cereal production in 2005, although the size of the reduction may not be as large as anticipated earlier. With more of the crop seasons well advanced or at least underway in the major producing countries, FAO now forecasts global output in 2005 at 1 996 million tonnes, which would be only 2.8 percent below the record 2004 crop. However, although still a relatively good, above-average crop, this level of output would not meet expected utilization so a drawdown in global cereal stocks is forecast in the new 2005/06 marketing year. Based on these current forecasts, the global cereal stock to utilization ratio, which compares the level of inventories at the close of a season to utilization in the next1/, would fall from 23 to 22 percent. However, it should be noted that while aggregate global stocks are forecast to fall, the aggregate inventories of the major exporting, developed countries, which provide the main buffer against unexpected shocks in cereal supply or demand, are forecast to increase for the second consecutive year. This reflects their expected good production, coupled with lower domestic utilization and weaker world import demand. 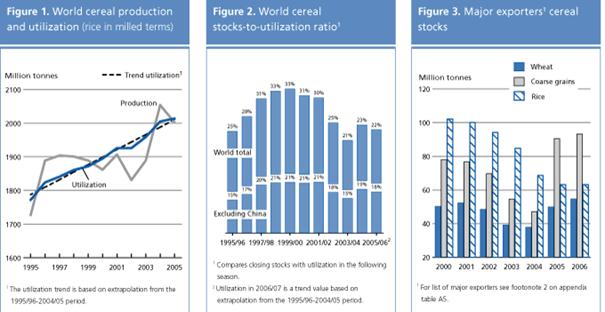
Table 1. Basic facts of the world cereal situation (million tonnes)
1 Data refer to calendar year of the first year shown. 2 Production plus opening stocks.
3 For wheat and coarse grains, trade refers to exports based on July/June marketing season. For rice, trade refers to exports based on the calendar year of the second year shown. Up to 2003/04 includes EU15, 2004/05 includes EU25.
4 May not equal the difference between supply and utilization because of differences in individual country marketing years.
5 For definition, see country classification note. 6 For wheat and coarse grains, imports based on July/June marketing season. For rice, imports based on the calendar year of the second year shown. 7 July/June.
Virtually all the decline in global cereal output in 2005 is expected among major producing (and exporting) developed countries. The bulk of the decrease is expected in coarse grains production in the United States and Europe, where yields are expected to return closer to average after record levels last year. The aggregate world coarse grain crop is forecast at 969 million tonnes, 5.2 percent down from 2004. Wheat output is also expected to drop somewhat, but less sharply, by 2.5 percent to 612 million tonnes. Again, reduced output in Europe, after last years record crops, will account for a large proportion of this reduction, although a significant drop is forecast also in North Africa because of drought. By contrast, for rice, early forecasts point to a further increase in global production in 2005, by 2.7 percent to 415 million tonnes (in milled terms). However, the main seasons are just starting in some major producing countries in the northern hemisphere so the outlook is still very tentative. Among the developing countries, latest information points to a marginal increase in the 2005 aggregate cereal output, mostly on account of better prospects in parts of Asia. Output in Africa may fall for the second consecutive year reflecting drought in the north of the region, which more than offset a slight increase expected in sub-Saharan Africa. In the group of Low-Income Food-Deficit Countries (LIFDCs), the 2005 cereal production is also forecast only marginally up from 2004.
FAOs first forecast for global cereal trade in 2005/06 points to a decline of just over 3 million tonnes, or 1.3 percent, in exports compared to the upward revised level of the previous year. Although global cereal production is forecast to decline, adequate carryover stocks in several countries where output is expected to drop will reduce their need for larger imports. The decline in trade stems mostly from expectation of lower shipments of wheat as those of coarse grains are anticipated to increase marginally. At this early stage, rice trade in calendar year 2006 is tentatively forecast to remain almost unchanged to the estimate for the current year.
FAO expects a modest growth of just 0.3 percent in world cereal utilization in 2005/06, compared to 2.3 percent in the previous year. Cereal food usage is foreseen to grow on par with growth in population to keep per caput consumption virtually unchanged in nearly all regions and in both developing and developed countries. In the LIFDCs the volume of cereals used for food consumption is expected to increase and on a per caput basis consumption will remain close to last years level of 158 kg per caput. Utilization of cereals for animal feed is expected at the same record level of 2004/05, but that for other uses is envisaged to decline slightly from the high level of last year.
Given the decline in cereal production forecast this year, and the modest growth in utilization, world cereal output in 2005 would not be sufficient to meet expected utilization in 2005/06 so a reduction of world cereal stocks is anticipated after the substantial build-up in the previous year. Total world cereal inventories by the end of countries' marketing seasons in 2006 are forecast to fall to 445 million tonnes, which would be some 19 million tonnes, or 4 percent, below the revised opening level. The drawdown is expected to occur mostly among the developing countries, particularly in China where the declining trend of the past few years is seen to continue. The aggregate cereal stocks of the developed countries is anticipated virtually unchanged from last year but those held in major exporting countries will increase for the second consecutive year. As a result, their shares of global stocks are now seen to increase to 31 percent for wheat and 49 percent per coarse grains.
Wheat prices remained well below the previous years levels in recent weeks under pressure of large exportable supplies and given generally favourable prospects for the 2005 crops against a generally weaker world import demand outlook. The situation is unlikely to change significantly during the new marketing season. Coarse grains export prices strengthened marginally in recent weeks, mostly in response to actual increased import purchases and weather concerns, but May quotations remain well below their levels of a year earlier. International rice prices have come under seasonal downward pressure as new supplies of rice from the secondary 2004 crops have become available on markets. Table 2. Cereal export prices (US$ per tonne)1
1 Prices refer to the monthly average. For sources, see tables A6 and A8 in the Statistical appendix.
Although the FAO dairy product price index has dropped slightly since its high level in January, prices for dairy products remain strong and well above the levels a year ago, largely in response to reduced exportable supplies in some major exporting countries. While global milk output is forecast to rise by about 2.8 percent in 2005, the bulk of the growth is expected among developing countries, particularly in Asia and South America, whose global share of production is increasing. In the developed countries, milk output is anticipated to remain stable. Dairy prices may strengthen further in the short term if the lower supplies in Oceania and EU exporters are not fully offset by increased supplies from the United States and South American exporters, especially in the face of growing international import demand. Consumption of dairy products is rising particularly in several developing country regions where income growth is a key factor.
The prospect of a record global oilseed production in the current 2004/05 season (October/September) has led to weaker prices for oilseeds, meals and cakes compared to a year ago. Aggregate production of oilseeds is now forecast to reach 373 million tonnes, 12 percent up from the previous years level. The bulk of the increase is expected to come from soybeans, the oilcrop with the highest meal content. As a consequence, oilmeal and cake production is also forecast to increase sharply in 2004/05 while the growth in output of oils and fat will be less pronounced. Regarding utilization, consumption of both oils and meals is forecast to increase in the current year. Increased demand for oils/fats is largely concentrated in southeast Asia - China and India in particular - and stems from increased incomes, but an important factor is also an exceptional rise in non-food use such as oil-crop based biodiesel. For oilmeals/cakes, the increase in demand is mainly a result of higher growth rates in global livestock production and generally depressed prices. Following from the increased oilseed production during the year, and even allowing for the increased utilization expected, inventories of both oils/fats and oilmeals/cakes are expected to rise by the end of the season. Early indications for a reduction in global oilseed production in 2005/06 are not expected to influence markets much, as the inventories accumulated this season should be sufficient to offset any production shortfall.
Global pulse production in 2005 is forecast virtually unchanged from the previous year at about 61 million tonnes with larger outputs among the developed countries mostly offset by reduced crops in the developing country group. This situation is expected to lead to an increase in global trade, with larger flows of pulses from the exporting developed countries where output is forecast to increase coinciding with increased demand from the traditional importing developing countries where domestic crops are seen to be reduced. This applies particularly to dry beans, prices of which are expected to stay relatively strong in the short-term, and dry peas, prices of which could recover after stagnating at a relatively low level for several months.
World sugar production is forecast to increase by 2 percent in the current 2004/05 season (October/September), to reach almost 144.8 million tonnes (raw sugar equivalent), and two-thirds of the growth is anticipated among the developing countries particularly in Latin America and the Caribbean. However, continuing growth in consumption, expected at 1.8 percent this year, would lead to a total utilization of over 145 million tonnes, and implies a shortfall in supplies still exists. As a reflection of this, world sugar prices remain relatively high and well above the levels last year, despite weakening slightly in the past few weeks.
International prices of banana weakened somewhat in March and April, as production recovered in several Latin American countries after a period of reduced supply while demand remained stable in the main markets. Coffee prices in March and April remained well above the low levels a year earlier, sustained by the current market fundamentals of reduced output, growing world consumption and an anticipated fall in stocks. The early outlook for 2005/06 points to a further output reduction, which could support a continuing upward trend in prices for the rest of the year further increasing export revenues in exporting countries (see box). International cocoa prices fell 10 percent in April, after strengthening in the previous six months against a backdrop of reduced cocoa harvests in major producing countries and an expected increase in grindings, which would imply a drawdown of stocks. Prices are expected to fluctuate in a narrower range until the end of the crop year in September. Tea prices increased further in March, largely reflecting firm demand against smaller traded volumes in the major Mombasa and Calcutta markets. In April, prices fell to US$1.63 per kg slightly higher than the seasonal average for April which was US$1.59 per kg over the last 6 years. World cotton prices continued to strengthen in the past months, largely due to expectations of reduced production in 2005 and prospects of a significant increase in import demand from China. 1. Utilization for 2006/07 is a trend value based on extrapolation from the 1995/96-2004/05 period. |
||||||||||||||||||||||||||||||||||||||||||||||||||||||||||||||||||||||||||||||||||||||||||||||||||||||||||||||||||||||||||||||||||||||||||||||||||||||||||||||||||||||||||||||||||||||||||||||||||||||||||||||||||||||||||||||||||||||||||||||||||||||||||||||||||||||||||||||||||||||||||||||||||||||||||||||||||||
