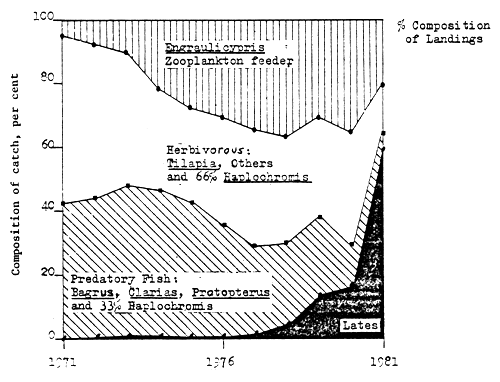
4.4.1 General. The total estimated catch from the Kenyan waters of Lake Victoria has recently increased from 14 918 t in 1971 to 45 667 t in 1981 (Table 10). This represents an annual increment of 27.8%, although a substantial portion of this increase occurred during the last year. The fishery exhibited a steady rise since 1971 and a sudden rise in 1978 due to an increase in canoe numbers (Table 27). The following years saw a dramatic rise in Lates niloticus catches (Fig. 18; Table 28) and today this species predominates, contributing up to 60% of the total catch. Average yield in the Kenyan waters of Lake Victoria now averages 121 kg/ha/yr, the highest of all Kenyan lakes (Table 9) and amongst the highest in Africa (Fryer and Iles, 1972).
It should be noted here that this change in productivity might be related to the interpretation of fishery statistics, present surveys generally tending to suggest a higher productivity. The relative value of present statistics is also questionable (Sec. 4.4.5).
The First Session of the Sub-Committee for the Development and Management of the Fisheries of Lake Victoria, of the Committee for Inland Fisheries of Africa (CIFA), was held in Mwanza, Tanzania, from 12 to 14 October 1981. Major topics were a review of the status of the Lake Victoria fishery and of the main fisheries development and management issues, as well as the definition of a future international action programme to be implemented by the three bordering countries to support the future development and management of the fishery (CIFA, 1982).
4.4.2 Private sector of the Lake Victoria fishery. The Fisheries Department estimate that there were 19 500 fishermen engaged in fishing activities during 1981, 35.7% of them full-time, 24.3% part-time, and 40% occasional fishermen. These fishermen used about 5 000 boats, generally sesse canoes 7 – 9 m long fitted with a sail. Mean catch per unit effort was estimated to be 45.2 kg/canoe/day.
An earlier survey by Butcher and Colaris (1975) indicated that in 1971 there were 4 320 boats fishing on the lake. If these were to increase in the same proportion as estimated from fisheries statistics (Table 27), then today there would be approximately 7 000 canoes on the lake. This corresponds to a total figure arrived at by a Nordic survey of fishing cooperatives, conducted by Hansen (1981). His results (Table 29) indicate that there are now over 200 landing beaches used by just over 31 000 fishermen operating from 8 503 canoes and 73 motorised boats. Of these, 8 480 fishermen are registered with 36 co-operatives, but only 48.5% of them are active members.
The Nordic survey was conducted in some detail, but no indication is given of the source of information. However, if 8 500 boats are effectively fishing, on the basis of a mean catch per canoe (CPC) of 45.2 kg/day, this would suggest a total yield of 73 000 t in 1981, much higher than actual estimates (Table 27).
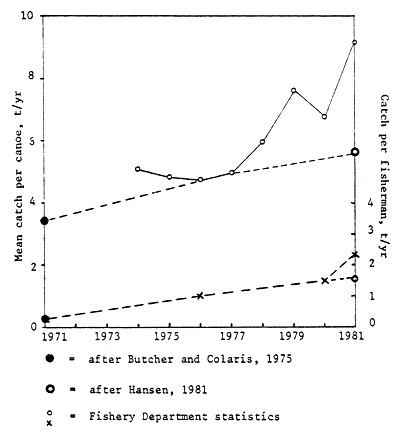
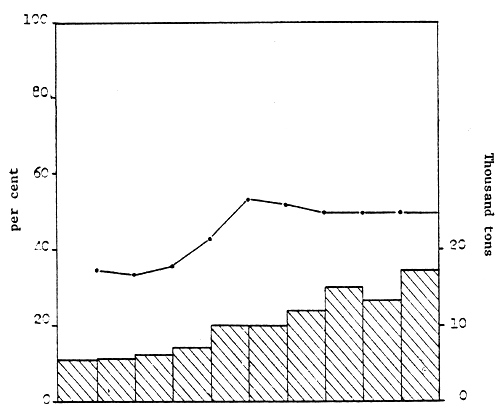
From data available, the CPC and the mean catch per fisherman (CPF) have shown a steady increase since 1976 (Fig. 19). Even if Hansen's canoe estimate is adopted, the mean catch per unit of effort would still appear to be increasing. This might well imply that Lake Victoria has yet to reach its maximum sustainable yield and that it is not yet being over-fished. But it might also imply that the fishing power of the boats has regularly increased (better gear, better training, longer fishing time …) and/or that there has been changes in the fishing gear being used.
Fishing gears most of ten are gillnets (tilapias and Lates), beach seines or scoopnets (Haplochromis and Engraulicypris), longlines (Clarias, Bagrus and Lates), and fixed traps (tilapias and anadromous species such as Labeo and Protopterus). Trolling with artificial lures is also used by sport fishermen to catch Lates.
Fishing cooperatives. The fishermens cooperatives man most landing beaches and provide limited onshore facilities for which a 10% commission is charged. But inefficiency of management has led to a general dissatisfaction with the cooperatives.
4.4.3 Specific composition of the catch
(a) Geographic variation. The specific composition of the catch is given per selected landing beach (Table 30). This is illustrated in Figure 20 and compared against total catches for 1971 and 1981. During this period, it would appear that tilapias have disappeared from all but those catches from the Rusinga Channel and the Nyakach Bay. They are still found, but to a lesser extent in open water stations such as Karungu (in the South) and Port Victoria (in the North). The most striking feature of all catches except for Karungu is the lack of diversity in species composition, a feature which was also typical of the catches made earlier in the decade. Lates niloticus predominates in most catches, except where the Engraulicypris fishery is high.
Such variation in catch data could be dependent on the local use of different fishing techniques, but unfortunately no data are available on the distribution of fishing gears which could help ascertain such hypothesis.
Nevertheless, the data are useful to understand the biology of the lake. An in-depth study as to why tilapias predominate only in certain restricted zones, and in particular T. nilotica (Okemwa, 1981), could reveal whether its disappearance elsewhere is due to over-fishing or a lack of sheltered breeding grounds.
Species composition of catch at various landing beaches at Lake Victoria, 1981
(adapted from J. Arunga, 1981a)
| Landing Beaches | Lates | Engraulicypris | Haplochromis | Tilapia | Clarias | Protopterus | Bagrus | Others | Total | |||||||||
| t | % | t | % | t | % | t | % | t | % | t | % | t | % | t | % | t | % | |
| Port Victoria | 119.9 | 82.4 | 0.03 | 0.02 | 0.04 | 0.03 | 10.7 | 7.3 | 1.5 | 1.0 | 1.3 | 0.9 | 2.8 | 1.9 | 9.2 | 6.3 | 145.5 | 4.6 |
| Misori | 115.7 | 29.4 | 60.1 | 15.3 | 12.0 | 3.0 | 142.9 | 36.4 | 23.3 | 5.9 | 1.3 | 0.3 | 11.3 | 2.9 | 26.3 | 6.7 | 392.9 | 12.4 |
| Naya | 741.0 | 74.8 | 104.7 | 10.6 | 8.3 | 0.8 | 67.8 | 6.8 | 28.7 | 2.9 | 8.0 | 0.8 | 0.5 | 0.5 | 31.4 | 3.2 | 990.4 | 31.2 |
| Kaloka | 64.9 | 36.8 | 102.3 | 58.0 | 3.9 | 2.2 | 1.5 | 0.9 | 2.2 | 1.2 | 0.7 | 0.4 | 0.06 | 0.03 | 0.94 | 0.5 | 176.5 | 5.6 |
| Dunga | 150.8 | 56.4 | 104.6 | 39.1 | 0.2 | 0.08 | 2.2 | 0.8 | 4.6 | 1.7 | 2.1 | 0.8 | 0.7 | 0.3 | 2.0 | 0.7 | 267.2 | 8.4 |
| Kusa | 28.2 | 11.9 | 133.3 | 56.3 | 11.9 | 5.0 | 36.9 | 15.6 | 11.4 | 4.8 | 2.9 | 1.2 | 0.07 | 0.03 | 12.2 | 4.6 | 236.9 | 7.5 |
| Kendu | 474.4 | 92.4 | 0.3 | 0.05 | 1.3 | 0.5 | 1.2 | 0.3 | 0.9 | 0.2 | 0.2 | 0.04 | 0.1 | 0.02 | 34.8a | 6.8 | 513.2 | 16.2 |
| Homa Bay | 22.0 | 10.3 | 176.9 | 83.2 | 3.1 | 1.5 | 2.9 | 1.4 | 5.4 | 2.5 | 0.2 | 0.1 | 0.03 | 0.01 | 2.17 | 1.0 | 212.7 | 6.7 |
| Luanda Gembe | 77.5 | 63.5 | 2.6 | 2.1 | 0.4 | 0.3 | 33.4 | 27.4 | 4.1 | 3.4 | 1.5 | 1.2 | 0.2 | 0.2 | 2.3 | 1.9 | 122.0 | 3.8 |
| Karungu | 23.6 | 20.4 | 0.6 | 0.5 | 21.7 | 18.7 | 8.3 | 7.2 | 17.8 | 15.3 | 0.5 | 0.4 | 11.5 | 9.9 | 31.9a | 27.5 | 115.9 | 3.6 |
| Total | 1 818.2 | 57.3 | 685.4 | 21.6 | 62.8 | 2.0 | 307.8 | 9.7 | 99.8 | 3.1 | 18.7 | 0.6 | 27.3 | 0.9 | 153.3 | 4.8 | 3 173.3 | 100.0 |
Figure 18. Annual landings and species composition, Lake Victoria 1971–81
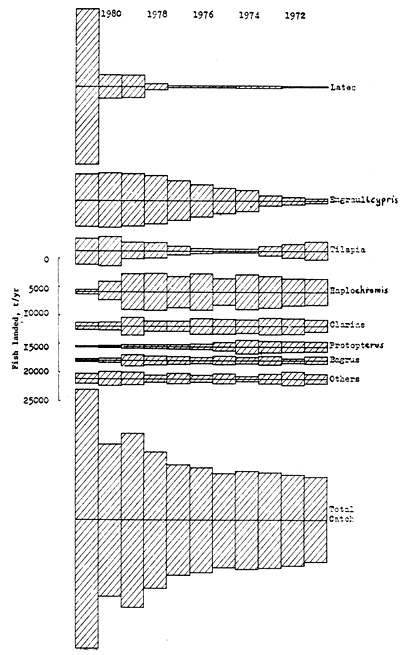
Figure 19. Lake Victoria: average catch per canoe and per fisherman, 1971 – 81
(b) Overall evolution of the total catch. From a compilation of all landing beach data since 1971, it has been possible to show a change in species composition (Table 28 and Fig. 18).
Lates, introduced in 1959 (Table 21), has arisen mostly since 1979 from insignificance to nearly 60% of the catch. There is, however, a corresponding drop in Haplochromis spp., a fish which is considered to make up to 30% of the Lates diet (Arunga, 1981b). It could have diminished as a result of high predation pressure, but also following the increased use of larger mesh-size gillnets better adapted to the capture of the Nile perch.
Bagrus, Protopterus, Clarias, Labeo and Barbus have also declined in numbers, but it is felt that this is a direct consequence of overfishing (especially for anadromous species), rather than due to increased Lates predation alone.
The total catches of tilapias, contrary to general belief (Wambayi, 1981), have not decreased. The quantity landed in 1981 is in fact substantially higher than a decade ago. What has happened is that the catch of T. esculenta has radically decreased (Table 31, Fig. 21). Between 1931 and 1961, six exotic species of tilapia have been introduced into Lake Victoria and its catchment waters (Table 32). Among these species, T. nilotica (or at least what appears to bear the distinctive features of this species but could be a hybrid according to electrophoretic tests - MacAndrew, pers. comm.) has displaced indigenous stocks.
Undoubtedly there exists some confusion amongst Fisheries Department staff and local consumers as to the true identity of each tilapia species. Although such uncertainty could be due to hybridization, it also points out to poor taxonomic training. A checklist (Table 33) gives major distinguishing characters to help alleviate this problem and it should be distributed and posted at all field stations.
(c) Ecological balance of the fish species. A high proportion of the commercially important species caught in Lake Victoria are of a predatory nature. Lates, Bagrus, Protopterus, and one-third of all Haplochromis species (Lowe McConnell, 1975) are considered piscivores. Generally the predatory species have comprised 30 – 40% of the biomass landed (Table 34) and established an apparent balanced predator: prey relationship. But lately this balance appears to have been upset by Lates and predators now comprise 64.4% of the yield (Fig. 22).
It is possible that such an imbalance might result in a future decline in catches, although Lates might replace other stocks and actually maintain fishery productivity as happened for example in Lake Kioga, Uganda (Arunga, 1981b). It is felt that this would last as long as the freshwater prawn (Caridina) population is not overexploited (Litterick, pers. comm.). Lates would displace other fish species, develop a short food chain (plankton/detritus-Caridina-Lates-Lates) and through cannibalism it would be likely to inflict its own population self regulating control.
A better understanding of the food chains in Lake Victoria is therefore essential to determine the peak point of the Lates population. An indication of mean size of fish caught would be useful in determining when fishing pressure becomes excessive and such that the breeding population is being depleted.
4.4.4 Marketing of the fish catch. A very small portion of the catch is actually consumed by the fishing community, which lives around the lake shores. During the past decade only 7.8% has been eaten fresh locally (Table 35). The total amount has remained relatively constant at 1 645 t ± 190 t/yr. This gives the impression that the proportion consumed by the fishermen is small when expressed as a percentage of total catch (Fig. 23). This may indicate that the fish eating community around the lake has remained relatively constant and that all the surplus is sold. The inference would also imply that, although most of the catch is Lates, a non-traditional table fish, the fishermen have adapted their ways and are consuming this fish also.
Species composition of the tilapia catch, 1971-81
(acc. Fisheries Department Statistics, 1971-81)
| Date | T. nilotica | T. esculenta | Other tilapias | Total t | |||
| t | % | t | % | t | % | ||
| 1971 | 591 | 18.8 | 1 934 | 61.6 | 617 | 19.6 | 3 142 |
| 1972 | 580 | 24.5 | 967 | 40.8 | 822 | 34.7 | 2 369 |
| 1973 | 488 | 28.8 | 304 | 18.0 | 900 | 53.2 | 1 692 |
| 1974 | 411 | 43.0 | 57 | 6.0 | 488 | 51.0 | 956 |
| 1975 | 202 | 31.5 | 28 | 4.4 | 412 | 64.2 | 642 |
| 1976 | 421 | 41.8 | 49 | 4.9 | 537 | 53.3 | 1 007 |
| 1977 | 465 | 32.4 | 42 | 2.9 | 928 | 64.7 | 1 435 |
| 1978 | 972 | 37.3 | 180 | 6.9 | 1 454 | 55.8 | 2 606 |
| 1979 | 962 | 35.1 | 94 | 3.4 | 1 683 | 61.4 | 2 739 |
| 1980 | 1 184 | 23.6 | 90 | 1.8 | 3 739 | 74.6 | 5 013 |
| 1981 | 2 213 | 47.4 | 166 | 3.6 | 2 289 | 49.0 | 4 668 |
List of the tilapia species introduced into Lake Victoria and its catchment waters (acc. Odero, 1979)
| Species | Date first introduction | Location | Origin |
| T. spilurus nigra | 1931 | L. Bunyoni, Uganda | L. Naivasha |
| T. nilotica | 1936 | L. Bunyoni, Uganda | L. Edward, Uganda |
| T. leucosticta | 1951 | L. Victoria | L. Edward, Uganda |
| T. zillii | 1953 | L. Victoria | L. Edward, Uganda |
| T. rendalli | 1953 | L. Victoria, Kianmu | unknown |
| T. mossambica | 1961 | L. Victoria catchment | unknown |
A check list of some of the diagnostic features of the tilapia species likely to be found in the Lake Victoria catchment area modified after Copley (1958) and Greenwood (1958)
| Status in Kenya | Indigenous | Exotic | ||||||
| New Genetic Name | Oreochromis | Tilapia | ||||||
| Species | variablilis | esculenta | mossambica | spilurus nigra | nilotica | leucosticta | zillii | rendalli |
| Morphological Features | ||||||||
| Dorsal Fin: Spine count | 15–16 | 16–17 | 14–16 | 14–16 | ||||
| : Ray count | 10–12 | 11–15 | 10–13 | 12–13 | ||||
| Longitudinal scale count | 29–33 | 31–35 | 28–31 | 28–32 | ||||
| Gill rakers - Lower part first gill arch | 18 + | 14 + | 14–23 | 14–23 | 18–26 | 14 + | 8–13 | 8–13 |
| Anal Fin: Spine count | 3 | 3 | 3 | 4–5 | 3 | 3 | 3 | |
| : Ray count | 9–10 | 8–11 | 7–10 | 9–10 | ||||
| Mouth Size: Enlarged | x | x | ||||||
| Dentation between eye and snout | hump | x | x | |||||
| Colouration | ||||||||
| Body Flanks | blue grey | brown yellow | green black | green blue | green grey | green black | green yellow | green olive |
| Chin and Cheeks | dark | white | yellow orange | red | red | red | ||
| Dorsal Fin: General | black | blue spots | white spots | yellow | green | |||
| : Border | scarlet | red | red | orange | red | yellow | ||
| Pectoral Fin | grey | grey | red | purple | dark | yellow | ||
| Pelvic Fin | grey | grey | blue | dark | rust | |||
| Caudal Fin: General | plain | black | striped | spots | ||||
| : Tip | scarlet | red | orange | red | ||||
| Eye | grey | amber | ||||||
Predator/prey relationship in Lake Victoria fish catch, 1971–81
| Year | Predators, % total catch | Prey, % total catch |
| (Lates, 33% Haplochromis, Clarias, Bagrus and Protopterus) | (Engraulicypris, 66% Haplochromis, Tilapia and others) | |
| 1971 | 42.6 | 57.4 |
| 1972 | 44.3 | 55.7 |
| 1973 | 48.3 | 51.7 |
| 1974 | 46.6 | 53.4 |
| 1975 | 42.5 | 57.5 |
| 1976 | 35.7 | 64.3 |
| 1977 | 29.3 | 70.7 |
| 1978 | 30.1 | 69.9 |
| 1979 | 38.3 | 61.7 |
| 1980 | 28.8 | 71.2 |
| 1981 | 64.4 | 35.6 |
| Mean | 41.0 | 59.0 |
| 2 SE x | 5.9 | 5.9 |
Processing and local consumption of the Lake Victoria fish catch, 1971–81
(acc. Fisheries Department Statistical Reports)
| Date | % Catch Processed | % Catch Consumed Fresh Locally | Weight (t) Processed | Weight (t) Consumed Fresh |
| 1972 | 34.6 | 10.5 | 5 531 | 1 683 |
| 1973 | 33.2 | 12.7 | 5 573 | 2 126 |
| 1974 | 35.8 | 9.6 | 6 145 | 1 642 |
| 1975 | 43.0 | 10.2 | 7 134 | 1 696 |
| 1976 | 53.1 | 7.2 | 9 921 | 1 355 |
| 1977 | 51.5 | 5.7 | 9 948 | 1 101 |
| 1978 | 49.8 | 5.6 | 11 925 | 1 332 |
| 1979 | 49.4 | 6.9 | 15 113 | 2 116 |
| 1980 | 49.1 | 6.3 | 13 210 | 1 694 |
| 1981 | 49.2 | 3.7 | 22 454 | 1 705 |
| Annual Mean | 44.9 | 7.8 | 10 695 | 1 645 |
| ± 2 SE | 4.5 | 1.6 | 3 118 | 190 |
Figure 20. Species composition of the catch at various landing beaches, Lake Victoria
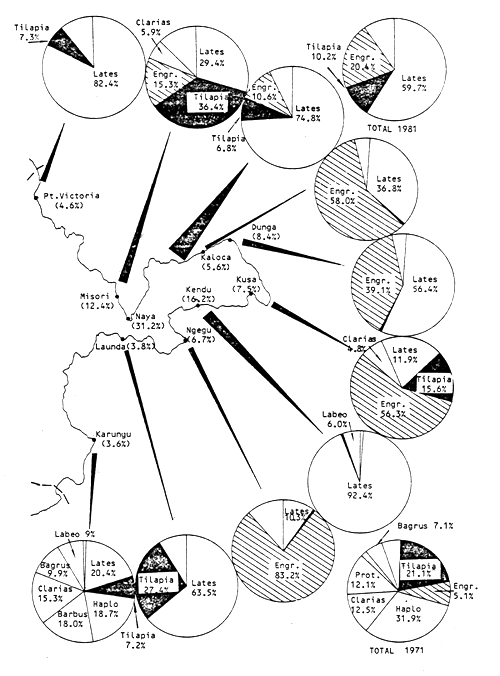
Figure 21. Tilapia catch and its species composition, Lake Victoria 1971–81

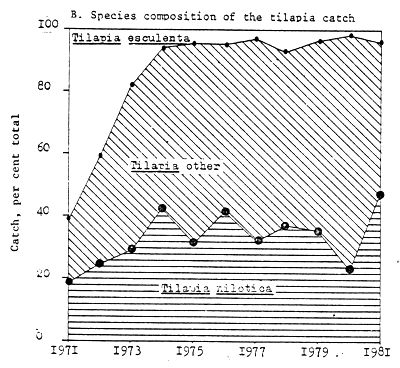
Figure 22. Predator-prey relationship in annual fish catch, Lake Victoria 1971–81
Similarly, for the period 1976–1981, the percentage of fish processed (i.e. dried, smoked, or deep fried) has remained constant at about 50% (Fig. 23). Thus, although catches have increased by 27 000 t during this period, the fish dealers have been sufficiently skilled to be able to handle and process the surplus, suggesting that new outlets and methods have been developed for the marketing of fresh and processed fishery products.
Not all landing beaches, however, exhibit the same trend (Table 36). At Naya beach for example, a very low portion of the catch is consumed locally, whereas at Ngegu and Karungu beaches the local consumption is high. This could reflect local preferences. Striking is also the fact that Port Victoria and Karungu beaches process a relatively small portion of their catch (Fig. 24), suggesting that the fish may be easily sold fresh, most likely across the border in Tanzania and Uganda.
Using Figure 24, it can be determined which areas would in the future benefit from better processing techniques such as ice plants at Port Victoria and Karungu, and improvement of smoking/drying units at Naya, Ngegu and Launda beaches.
The value of the Lake Victoria fishery was slightly over Ksh. 102 million in 1981 (Table 10). Value and consumers preferences for tilapias will be discussed in this section.
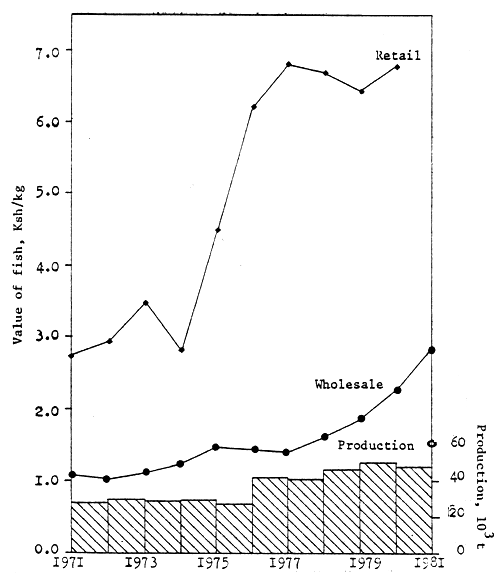
Tilapias are among the highest priced freshwater fish in Kenya. They are certainly double the value of other fish from Lake Victoria although the national average is slightly lower (Fig. 25). A survey of six markets done during the the course of this mission indicates that the present system of selling by pieces rather than by weight means that tilapias retail at Ksh. 18–20/kg (Table 13), a price which is five times the wholesale value.
Customers preference is for a fish size which is within the financial means of the household (Sec. 2.7.1), but this size preference varies according to area (Table 13). Generally, consumers prefer a 250 g fish, though smaller fish of 50 g are readily bought, retailing at a price equivalent to that of 250 g fish. Similarly, at the Dunga market, a survey showed that Lates size was a most decisive factor, the definite preference being for small fish (Table 14). This is perhaps the size for which traditionally the housewife has experience in its preparation for the table and at which the palatability is not affected by the general fatty texture of larger fish. It is also of interest to note that larger fish cost proportionately more, may be because of its potential higher value for sale outside of the lake community.
Generally, fisherman fetch 20–30% only of the wholesale value of the fish (Fig. 26).
4.4.5 Lake Victoria fishery statistics. The statistical catch data for Lake Victoria are based on the continuous monitoring of the fish landings at ten selected landing beaches distributed around the lake shore (Fig. 20 and Table 37). From detailed catch data available for 1978–1981, it may be seen that three of these ten beaches (Naya, Kendu and Misori) yield over 50% of the total catch. The catches of the sample beaches also represent only a very small portion of the total estimated catch. In 1978–1981, this representation varied from 2.8–7.0%. The significance of the sampling is therefore doubtful. It is further offset by the report of Hansen (1981) who estimated that half of the boats fishing in the lake appear to be associated with the sampled beaches. If this were so, the estimated total catch should be proportionately lower.
The 1981 total catch estimate for Lake Victoria was derived (Ngugi, 1976) from multiplying the total number of canoes by the number of fishing days and by the mean catch per canoe (CPC), considering that:
Processing and local consumption of the fish catch at selected landing beaches,
Lake Victoria, 1978–81
(acc. Fisheries Department Statistical Reports)
| Landing Beach | Processing, Percent | Local Consumption, Percent | ||||||||
| 1981 | 1980 | 1979 | 1978 | Mean | 1981 | 1980 | 1979 | 1978 | Mean | |
| Port Victoria | 1.2 | 0 | 0.6 | 6.2 | 10.6 | 8.4 | ||||
| Misori | 50.5 | 21.1 | 31.6 | 23.0 | 31.5 | 3.0 | 2.2 | 10.2 | 4.0 | 4.8 |
| Naya | 73.0 | 25.5 | 49.2 | 1.1 | 0.8 | 0.9 | ||||
| Kaloka | 55.1 | 52.9 | 67.3 | 66.2 | 60.4 | 5.9 | 5.1 | 4.7 | 6.1 | 5.4 |
| Dunga | 29.0 | 68.5 | 75.4 | 74.0 | 61.7 | 4.1 | 4.3 | 3.1 | 2.0 | 3.4 |
| Kusa | 53.5 | 72.9 | 75.7 | 67.4 | 6.6 | 4.3 | 2.7 | 4.5 | ||
| Kendu | 30.8 | 63.8 | 47.3 | 1.6 | 6.6 | 4.1 | ||||
| Ngegu | 86.5 | 77.8 | 65.1 | 47.5 | 69.2 | 5.9 | 9.5 | 15.8 | 17.3 | 12.1 |
| Homa Bay | 15.9 | 28.4 | 22.1 | 5.9 | 12.6 | 9.2 | ||||
| Launda | 55.7 | 69.7 | 63.0 | 75.5 | 66.0 | 6.7 | 6.2 | 5.2 | 3.6 | 5.4 |
| Karungu | 3.4 | 12.0 | 39.1 | 18.2 | 20.9 | 28.3 | 12.5 | 20.6 | ||
Catch data collected at the Fisheries Department sample beaches,
Lake Victoria, 1978–81
(acc. Fisheries Department Statistical Reports)
| Sample beach DOF | 1981 | 1980 | 1979 | 1978 | Mean | |||||
| t | % | t | % | t | % | t | % | t | % | |
| Port Victoria (Marenga) | 145.5 | 4.6 | - | - | - | - | 41.3 | 6.1 | 93.4 | 4.7 |
| Misori | 392.9 | 12.4 | 340.2 | 28.7 | 176.6 | 19.3 | 183.0 | 27.1 | 273.2 | 13.7 |
| Kaloka | 176.5 | 5.6 | 133.3 | 11.3 | 176.9 | 19.3 | 155.3 | 23.0 | 160.5 | 8.0 |
| Naya | 990.4 | 31.2 | - | - | 99.3 | 10.8 | - | - | 544.8 | 27.2 |
| Dunga (Kisumu) | 267.2 | 8.4 | 166.5 | 14.1 | 111.4 | 12.2 | 31.8 | 4.7 | 144.2 | 7.2 |
| Kusa | 236.9 | 7.5 | 257.9 | 21.8 | 49.8 | 5.4 | 100.3 | 14.8 | 161.2 | 8.1 |
| Kendu | 513.2 | 16.2 | 100.7 | 11.0 | - | - | - | - | 306.9 | 15.3 |
| Ngegu | 212.7 | 6.7 | 119.2 | 10.1 | 50.5 | 5.5 | 67.8 | 4.1 | 102.5 | 5.1 |
| Homa Bay | - | - | - | - | 56.1 | 6.2 | 39.8 | 5.9 | 47.9 | 2.4 |
| Launda | 122.0 | 3.8 | 97.1 | 8.2 | 94.7 | 10.3 | 90.5 | 13.4 | 101.7 | 5.1 |
| Karungu | 115.9 | 3.6 | 69.3 | 5.9 | - | - | 6.4 | 1.0 | 63.7 | 3.2 |
| Total | 3 173.3 | 1 183.5 | 916.1 | 676.2 | - | |||||
| Total catch est. | 45 667 | 26 914 | 30 592 | 23 856 | - | |||||
| % Representative Sample | 6.9 | 4.4 | 3.0 | 2.8 | - | |||||
Figure 23. Fate of the total fish catch, Lake Victoria 1971–81
A. Portion of Landings Processed
B. Portion of Landings Consumed Locally
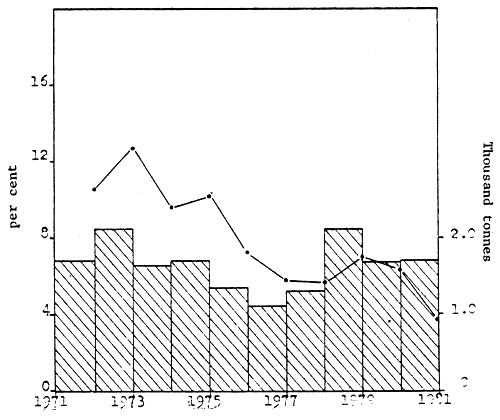
Figure 24. Fish processing and local consumption at various landing beaches. Lake Victoria
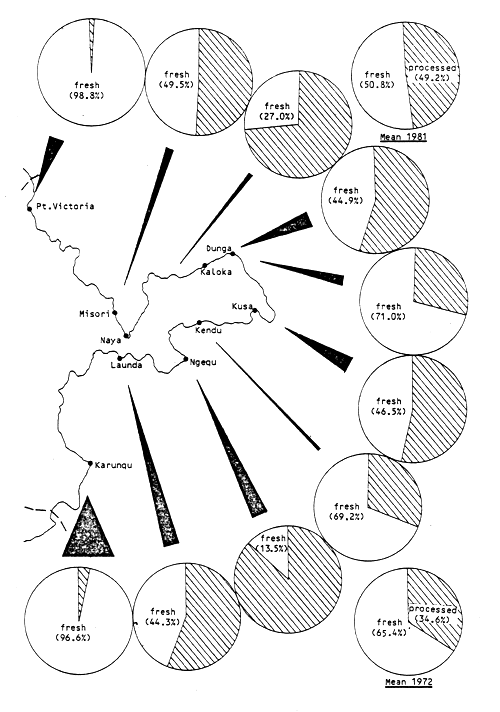
Figure 25. The wholesale value of fish to fishermen and fish farmers, 1971–81
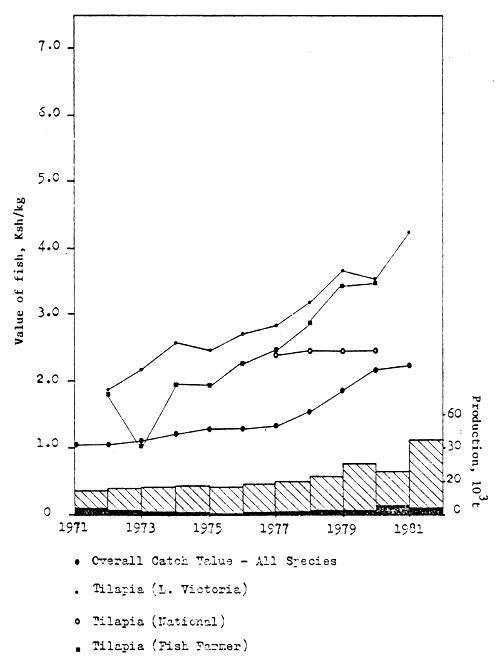
Figure 26. Wholesale and retail fish prices, 1971–81
This formula, although theoretically correct is sensitive to data inputs which in this case appear questionable:
Number of canoes. As already mentioned in Section 4.4.2, the Hansen's survey suggests 8 500 canoes (Table 29); on the other hand, a rapid survey of the fishing boats registration records (DOF/Western) indicates 23 500 boats registered in 1981, a totally unrealistic figure.
CPC. Mainga (1981a) in an independent survey of sample beaches between July-November 1981, estimated a daily catch per boat averaging 63 kg/day, when official fishery statistics simultaneously indicate a CPC = 47.6 kg/day, a 32.3% discrepancy.
Fishing time. It appears that 190 days/year fishing time is an underestimate because:
boats are generally owned by 4–5 fishermen; if one of them is ill or absent due to other commitments, the remaining crew is still able to fish;
nets are mended during non-fishing hours;
boat repairs should not be much time-consuming as the fishermen can ill afford an extended non-fishing period and boats are maintained regularly.
Loss of nets and weather therefore would be the major factors affecting fishing time. A further consideration is that as almost 50% of the boats are not operator-owned, the owner is likely to want maximum return from his investment. He is likely to allow fewer non-fishing days, by employing part-time fishermen in the absence of a regular crew. Fishing time could therefore be as high as 300 days/year.
Illegal fishing. No allowance is made for beach seines, traps, non-registered boats, general illegal fishing and sport fishing catches. This is likely to be as high as 25% of the total catch.
Assuming the above to be true, then recalculated values for 1981 could be either:
Taking the average value of these various possibilities gives an estimated total yield of 64 550 t. This is a substantially higher yield which implies that a more stringent control on management and certainly on data collection and analysis is essential. This recalculated catch is equivalent to 175 kg/ha/yr which surpasses all previous estimates of maximum sustainable yield (Table 9).
At the recent meeting of the CIFA Sub-Committee for the Development and Management of the Fisheries of Lake Victoria (CIFA, 1982), the three riparian countries agreed to a double course of action: (a) FAO was requested to provide assistance to study the existing statistical systems and to harmonize them; (b) a working party on fishery statistics should be established to regularly bring together the fishery statisticians of the countries involved.
4.4.6 Fishery research on Lake Victoria. Research includes studies on Lates (Arunga, 1981b and Ogari, pers. somm.), Tilapia (Wambayi, 1981), Labeo (Kibaora, 1981), Alestes and Schilbe (Mwenesi, 1981). Mainga (1981a) has been concerned with production assessment studies and Okemwa (1981) has undertaken a review of trawler catches in 1969–1980.
4.5.1 Government fishery development policy. The Government of Kenya IV Development Plan (1979–1983) in the fishery sector plans for the production of 60 000 t by 1983, which is equivalent to 40% of the official estimated maximum sustainable yield (Kenya, 1979c). Such goal was apparently reached in 1981 (Table 10).
The main thrust of this development strategy will be to launch 10 motorised trawler boats on Lake Victoria to upgrade Karungu and Port Southby landing beaches to accommodate the trawlers, and to provide ice and onshore facilities. In addition, 30 improved traditional fishing craft equipped for longlining and improved onshore facilities will be provided.
On Lake Turkana, a fishing station is to be built at Loyangalani.
The marine fishery will be provided with 8 trawlers to be used in Ungama Bay. An additional 80 craft equipped with small diesel engines will be supplied to various cooperatives. Onshore facilities will be improved at Shimoni, Lamu and Vanga and will include ice plants, stores, jetties, ramps, etc. For the extension services of inland fisheries, additional vehicles and equipment will be supplied to the fishery stations in Mombasa, Malindi, Lamu and Shimoni.
It is also proposed that the Kisumu and Mombasa fishery substations be upgraded so as to be able to carry out broader research programmes. The Wildlife and Fisheries Training Institute will also be built in Naivasha which, together with the research institutions, will improve fishery training.
4.5.2 Development aid programmes for marine fishery development
(a) The World Bank assisted project. A U.S. $2.5 million loan has been granted to the Fisheries Department to improve handling and storage facilities through the use of ice (Anon. 1980). Three fishing centres are to be established at Lamu, Shimoni and Vanga, with two smaller stations at Faza and Kisingitini. Each centre is to have a chillroom, a sorting shed with scales, fully equipped workshop, store and office, ice boxes, fish boxes, housing for senior staff and a fuel/water supply point. The fishing stations are to have floating platforms, ice boxes, fish boxes and a shelter. Ice plants will be built at Shimoni and Lamu and will be equipped with transport vehicles and boats to distribute ice and collect fish. In addition, about 50 fishing crafts will be provided during the programme.
It is expected that fishermen earnings should increase by 30–60% and that cooperatives will receive a 12% return from project investments. The project hopes to increase the fishery production by 1 500 t/yr.
(b) The Nordic scheme. Danish aid has been envisaged to complement the above World Bank project through provision of buildings and training of cooperative managers at Shimoni and Malindi. It is however uncertain as to whether the U.S. $100 000 aid in the form of manpower is still in effect. A considerably larger scheme had been proposed originally, but it has recently been reduced because of the overlap with the World Bank project (Hansen, 1981).
(c) NORAD aid for the south coast. NORAD funds are now being used to develop buildings for ice plants and stores to complement the World Bank assisted project for the south coast fishery.
4.5.3 Development aid programmes for inland fishery development, except Lake Victoria.
(a) Nordic aid for the Taite/Taveta District. Lake Jipe and Lake Chala together produce between 250 – 500 t/yr of fish, but by virtue of their location it is felt that this product is not fetching a good market price. Danish agencies offered assistance to improve processing and marketing facilities as well as develop an access road. It is now uncertain in view of the small size of the fishery, as to whether the programme is to be implemented.
(b) NORAD aid for Lake Turkana. The Norwegian aid programme has just completed the development of a fishing cooperative on Lake Turkana which for nearly one year now has been operating on its own. The project (NORAD, 1980) is valued at U.S. $1 million and includes a 3 000 m2 fish factory in Kalokol, 70 canoes and the establishment of a cooperative with its own transport means. The factory is capable of handling 300 – 400 t of fresh fish per annum as well as to process and store over 1 000 t dried fish. However, the factory has yet to be used to its full potential as the quantity of fish landed is now declining.
(c) EEC aid for Lake Turkana. The European Community has pledged U.S. $80 000 to establish a fish plant at Loyangalani on the shores of Lake Turkana, on the bank opposite to the NORAD fish factory. The exact form in which this is to take place is currently under consideration.
4.5.4 Development aid programmes for the Lake Victoria fishery
(a) The World Bank project. An additional loan has been provided to develop the Lake Victoria fishery. It will allow for the establishment of 8 fishing centres, 9 fishing stations, and 2 ice plants (Homa Bay and Kisumu) plus transport vessels. The fishing centres are to be located at Port Victoria, Usengi, Misori, Kaloka, Homa Bay, Mbita, Kendu Bay and Karungu (Fig. 2). The fishing stations will be built at Port Southby, Naya, Kusa/Samo, Muhuru, Nyabiwa/Kitega, Wakola, Nakweri, Luanda/Canam and Sio port. The developments include sorting sheds, insulated boxes and cold stores, drying and smoking facilities. Each fishing centre will also have an office, stores, housing and access road. Transport will be provided in the form of 8 boats and 5 pick-up trucks. There will also be a boat building workshop at Kusumu.
It is anticipated that post harvest losses will be reduced, thus raising the income of the fishermen and realising a yield increase of 775 t/yr.
(b) Nordic cooperative development. Originally the programme was to develop fish landing beaches. However, in view of the overlap with the World Bank scheme, this was reduced to assisting with the training of cooperative management staff (Hansen, 1981). It now appears as if even this aid might be withdrawn.
(c) EEC future assistance. Recently this agency has contacted the Department of Fisheries concerning the possible implementation of a regional project for the investigation and development of the pelagic fishery in Lake Victoria.
4.5.5 Potential for future fishery development in the Lake Basin
(a) Lake Victoria. There would appear to be a real likelihood that the present total catch is near the amount that can be biologically sustained, at least without further major changes in the fish species present. Development to expand the fishery would be unwise until a better estimate of the sustainable yield has been obtained.
Immediate development should rather concentrate on the improvement of product quality and on the reduction of losses. Poulter (1982) estimates that 5 – 10% of the catch may be lost due to post-harvest deterioration. The World Bank caters only for the increase of a small section of the catch and other areas should be identified and assistance provided accordingly. For example, quality losses during transportation from the fishing grounds to the landing beaches are also substantial. There may be scope for motorised communal collection vessels, equipped with ice, which could undertake scheduled deliveries from the fishing grounds.
Much of the present effort on management of the fishery should be aimed at maintaining the present levels of production. The various modifications being made or planned for the future to the inflowing rivers, as well as the increasing potentials for lake water pollution from industrial development threaten the fishery, particularly that of migratory stocks. Only concerted coordination and cooperative action by the three riparian countries can ensure effective management and protection of the common fishery (CIFA, 1982).
(b) Other lakes and rivers. Lake Kanyaboli and Lake Sare represent the other two largest natural bodies of water located in the Lake Basin. These and various man-made lakes (Table 2) should be monitored and a balanced stocking undertaken if required, for example where fish production is seen to decrease or where available niches are discovered which could best be exploited by non-indigenous stocks.
4.6.1 Improvement of the tilapia fishery in Lake Victoria. Concern over the decline in tilapia has prompted the Fisheries Department to take action in the form of replenishing lake stocks with fingerlings bred and reared in onshore facilities. Tilapia are spawned in brood ponds, released into fattening ponds and when of suitable size allowed to pass into a channel interconnecting with the lake. A pilot scheme exists in Kisumu and similar units are planned for Alum and Seme beaches. No construction plans however exist for these units and no provision has been made to monitor their real effectiveness on the tilapia fishery.
The Lates variety introduced into Lake Victoria originated from Lake Albert and it is of the variety which frequents shallow waters (Arunga, 1981b). The diet of this species is reported to consist of 10 – 20% juvenile tilapias, though this could be as high as 40% (Lowe, McConnell, 1975).
Assuming from present catch data that Lates has a sustainable standing crop of 25 000 tonnes/annum, and that this piscivore species has a food conversion ratio of 5:1 (Fryer and Iles, 1972), this population would therefore consume 125 000 t of fish per annum. If tilapias were a mere 10% of this diet, this would represent 12 500 t of tilapia or 500 million fingerlings of 25 g size. Any restocking schedule would first have to provide an equivalent number of fish to satiate the appetite of the Lates population before becoming effective.
As the present catch of tilapia does not indicate a decline (Fig. 18), it is difficult to see the justification of such a programme, unless to increase the stocks of a favoured species. Were this the case the Kisumu/Alum projects should be treated as pilot schemes and careful monitoring of local catches of tilapia before and after their implementation should be undertaken. All costs of the programme should also be monitored so that a reasonable cost/benefit estimate can eventually be obtained for a full-scale project. Kisumu, KMFRI and the Department of Fisheries/Western should share responsibility for such programme.
Perhaps of a more practical nature would be to select known tilapia breeding grounds and to improve/protect them. Piles of old tyres, junk or scrap metal could be dumped in these sites to provide ‘hides’ and to prevent illegal fishing. Also, pens could be constructed to rear tilapia, the fry produced being released into neighbouring waters or being able to find protection in these fenced areas.
4.6.2 Fishery statistics for Lake Victoria. The present statistical data collection system should be critically reviewed. Statistics compilation and reporting should be standardized, in coordination with the other two riparian countries. During such course of action, a close collaboration should be established with the statistical team assigned to the monitoring/evaluation of the World Bank assisted project.
4.6.3 Cooperative management. Hansen (1981) indicated that the cooperatives around Lake Victoria were not operating according to the objective of such organizations. The causative factor was defined as poor management training. Should the Nordic aid to cooperatives be no longer forthcoming, medium term technical assistance would be essential to revitalise the society and ensure sound management through personnel training.
4.6.4 Biological studies. Little has been forthcoming in recent years in the way of an understanding of the latest development of the Lake Victoria fishery. Research is required to identify breeding grounds, food chains and limnological features, necessary to establish a sound biological basis for the successful management of the fishery. A more detailed study of the fish population structure should be implemented, for example under the supervision of KMFRI with external technical support.
Similarly, any new projects such as the creation of man-made lakes or industrial projects should fall under the attention of such a research team, surveys being conducted before and after implementation so as to assess environmental impact.
4.6.5 Stock assessment data. At present there would appear to be no regular collection of basic data which could be used to identify overfishing in Lake Victoria. The present methods of examining the landed catch are inadequate and in need of refinement. Assistance in statistics and ecological survey techniques is of prime importance, before any sound management policy can be drawn up.
4.6.6 Law enforcement. Generally, fish scouts are now responsible for the enforcement of the Fishery Department regulations governing net size, gear type, fishing locality and quality control, as well as to ensure that all fishermen and traders are licensed. But several occasions of illegal fishing practices have been personally observed such as the setting of nets within 500 m of the shore - a “non-fishing zone” - and fish scouts have been powerless to enforce regulations due to the lack of boats for example to confiscate the nets. Patrol boats are therefore essential to enforce the fishery legislation. Further, a closer collaboration with the Wildlife Department should be encouraged, their surveillance planes being possibly also used to patrol the lake shores and the rivers, to detect illegal fishing or traps which threaten anadromous fish spawning migrations, and to alert a ground force.
4.6.7 Extension work in the fishery. Very little extension work appear to be done in the fishery where law enforcement and statistics collection predominate. A separate extension service should be created, completely dissociated from law enforcement and directed towards the personal involvement of the fishermen (e.g. through the cooperatives) in the management/development and protection of the fisheries.
4.6.8 Pollution and aquatic environmental research. Aquatic pollution is not yet a major problem in the Lake Basin. However, an awareness of the possible threat to the fishery of future industrial development is important. Research should be directed towards monitoring areas suspect of a possible pollution threat, implications should be identified and a remedial solution developed.
4.6.9 Fishery records and documentation. The journal of the East African Freshwater Fisheries Research Organization (EAFFRO) was the last vehicle for the publication of fishery research results conducted in Lake Victoria. Previous fishery records were filed in the EAFFRO Kisumu substation, but during their transfer to the head office in Nairobi, following the collapse of the East African Community, much of them were lost. What remains is now stored in the Fisheries Department Library, too small to accommodate all the material. The dissemination of information from research groups to extension workers and fishermen is essential to any successful implementation of management policy. Further international exchange via publications helps broaden the scientific outlook and appreciation of new concepts. It is important therefore that a well organized documentation centre be established, initially with the assistance of a professional librarian.
The FAO/CIFA Subcommittee for the Development of the Fisheries of Lake Victoria has recently included among its recommendations the improvement of the dissemination of regional scientific and technical information. This includes “the early resumption of an effective regional scientific and technical publication and of an information/publication exchange system”, recognized as a pressing regional priority (CIFA, 1982).