Production higher in 1993
World cassava output rose by 7 percent in root equivalent according to estimates for 1993. Output in Africa grew by 14 percent, primarily in Nigeria where production reached a record following a significant expansion in plantings and the continued adoption of pest-resistant, high-yielding varieties. Production also rose in Benin, Burundi, Côte d'Ivoire, Mozambique and Zaire, but fell significantly in Angola and Liberia with civil strife and damage from the mealy-bug. Crops were severely diminished in Madagascar, Rwanda, Tanzania and Uganda by unfavourable climatic conditions. In Latin America, expansion resumed with increases in Bolivia, Brazil, Colombia and Paraguay. In Brazil, crops recovered from the previous year's drought-reduced level but remained well below the recent trend. In the Far East, total output was estimated to have fallen reflecting smaller crops in India and China, whereas little change was anticipated in Thailand.
Utilization increased in 1993
Consumption as food increased by 8 percent in line with the expansion of production in 1993.
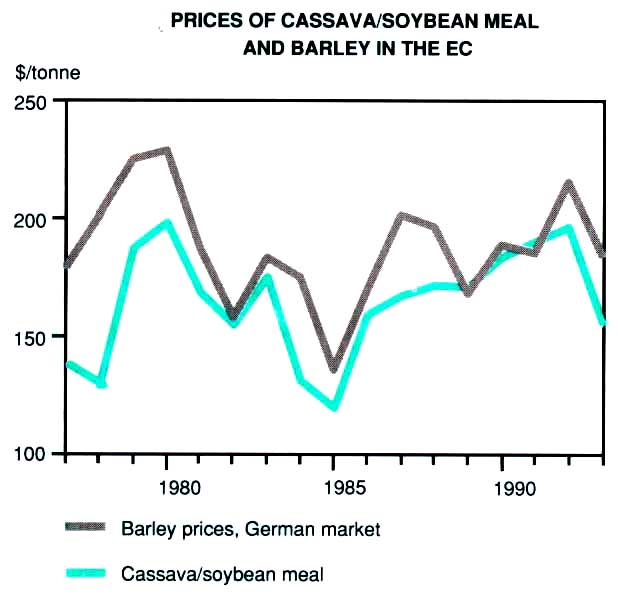
Prices of cassava/soybean meal and barley in the EC
The increase in consumption was most pronounced in Africa, where cassava is grown mainly for food. Larger production resulted in higher per caput food availability in Nigeria, Côte d'Ivoire and Mozambique, while in the rest of the region reduced consumption followed lower output. Consumption per caput rose slightly in Latin America, but was lower in most countries in Asia. In the developed countries, feed utilization fell, reflecting higher prices for cassava/soybean meal compounds in some countries, including Japan and the United States, while in the rest of the world, feed use was largely unchanged, particularly in the EC where cassava remained competitive.
Prices for cassava pellets sharply down in the EC: increased in other markets
In 1993, the EC import price for cassava pellets averaged $137 per tonne or 25 percent lower than in 1992. The decline reflected increased competition from grains; the effect of higher prices for soybean meal, which is combined with cassava in compound feeds; and the appreciation of the US dollar relative to European currencies. Sales to the EC by Thailand, the largest exporter, were regulated under the "bonus quota system" as in previous years. In 1993, exporters were eligible to ship up to 2 tonnes to the EC for each tonne exported to other destinations. This two-for-one ratio in 1993 was higher than the 1.3 for 1 granted in 1992. However, a decline in prices obtained in the EC reduced the profits from these sales and thus the "subsidy" for sales to non-EC markets. Export prices to non-EC markets were consequently raised some 10 percent to levels varying between $60 and $70 per tonne f.o.b. Bangkok,
Trade declined in 1993
Curtailed shipments to non-EC markets of pellets for feeds as a result of higher prices, outweighed growth in sales of cassava flour and starch in 1993 and global trade declined by 6 percent. The volume of global trade was some 10 million tonnes in dry cassava pellets, equivalent to 25 million tonnes of roots. The bulk of chips and pellets traded were for feed and alcohol use, while about 12 percent was shipped for starch and flour use. As in the past, Thailand was the main supplier, with 84 percent of global exports followed by Indonesia with 11 percent. On the import side, the EC continued to dominate the market accounting for two-thirds of global imports.
Exports from Thailand fell by 8 percent to 8.5 million tonnes, mainly as a result of a reduction in sales to non-EC markets, reflecting a decline in "subsidies" on these sales, aggravated by higher prices for the complementary soybean meal. Thailand's sales to the EC, were maintained at about 5.5 million tonnes in keeping with the 1991-94 voluntary export restraint agreement'. China and
Indonesia were entitled to export 5 percent more to the EC in 1993 following the 1992 renewal of their cooperation agreements. Indonesia fulfilled its overall access entitlement of 866 000 tonnes and so too did the group of minor exporters in Latin America, Africa and the Far East, together supplying 145 000 tonnes. However, larger domestic requirements in China prevented this country from supplying all of its 367 000 tonne allowance.
Total imports by the EC remained little changed at some 6.8 million tonnes, less than the maximum 7.2 million tonnes allowed under its various agreements with cassava suppliers. The decline in 1993 world imports thus mainly reflected much reduced shipments to non-EC countries, including China, the Republic of Korea and the United States, brought about by the rise in prices for exports to these markets. This shortfall was not offset by the greater purchases of the Czech and Slovak Republics, Japan, Poland, Turkey and the countries of the former USSR.
The decline in the average export price for pellets, combined with the contraction in the volume of cassava traded, indicated a reduction of 18 percent in the overall value of cassava exports. Export earnings from cassava flour rebounded somewhat, reflecting both higher prices and an increase in export volume of some 10 percent.
Production in 1994 likely to fall in Asia but increase in Africa and Latin America
Preliminary estimates of the area under cassava crops in Asia suggest a smaller harvest in 1994. In particular, there has been a marked reduction in plantings in Thailand where expectations for lower returns encouraged a diversification towards alternative crops. However, output could expand further in Africa and Latin America. In Africa, the continued propagation of higher-yielding and pest-resistant varieties was expected to result in larger crops. However, the incidence of pest and diseases in some countries mainly reliant on old varieties, could again constrain yields. Production in Nigeria, the largest producer, could be adversely affected by the lifting of the cereal import ban in 1993. In Latin America, Colombia's output was again likely to rise, following the setting of attractive producer prices for 1993/94.
Lower EC prices and trade contraction likely in 1994
Prices for cassava pellets in the EC were anticipated to continue to be under downward pressure in 1994, in response to policy developments there. This would further erode the two-tier system that has prevailed since 1984. The associated raising of export prices to non-EC destinations was expected to narrow the wide price differential between the EC and non-EC markets that has characterized the international cassava sector over the past ten years. As a result, exports of pellets to non-EC markets, which account for some 20 percent of world exports, were likely to be curtailed. By contrast, sustained demand for cassava flour and starch was forecast on the basis of strong economic growth in Asian countries. Imports by the EC were also forecast to fall in 1994, irrespective of competition from other feeds, as Thailand had already used about 16.5 million tonnes of its four-year export allowance to the EC during 1991-93, leaving only 4.75 million tonnes, that is 750 000 tonnes less than the 1993 figure. Moreover, failing cassava prices in the EC could discourage other major suppliers from fulfilling their export entitlements, thus contributina to a reduction in EC imports. However, a major area of uncertainty concerns the renewal of the cooperation agreement which, if it materialized. could allow Thailand to export an additional 650 000 tonnes in 1994.
Production
| 1988-90 Average | 1991 | 1992 | 1993 | ||
| Million tonnes | |||||
| World total | 157.0 | 160.9 | 159.4 | 170.9 | |
| Developing countries | 157.0 | 160.9 | 159.4 | 170.9 | |
| Latin America | 31.1 | 32.5 | 29.3 | 30.4 | |
| Brazil | 23.2 | 24.5 | 21.9 | 22.8 | |
| Paraguay | 3.8 | 3.9 | 3.3 | 3.5 | |
| Africa | 73.4 | 78.9 | 79.5 | 90.5 | |
| Ghana | 3.1 | 3.6 | 4.0 | 4.2 | |
| Madagascar | 2.3 | 2.3 | 2.3 | 2.0 | |
| Mozambique | 3.6 | 3.7 | 3.2 | 3.5 | |
| Nigeria | 16.6 | 20.3 | 20.3 | 31.6 | |
| Tanzania | 7.2 | 6.3 | 5.2 | 5.0 | |
| Zaire | 18.0 | 19.5 | 20.2 | 20.8 | |
| Far East | 52.3 | 49.3 | 50.4 | 49.8 | |
| China | 3.3 | 3.3 | 3.4 | 3.0 | |
| India | 5.1 | 5.1 | 5.8 | 5.3 | |
| Indonesia | 16.1 | 16.0 | 16.5 | 16.6 | |
| Thailand | 22.4 | 19.7 | 19.7 | 19.8 | |
| Viet Nam | 2.6 | 2.4 | 2.3 | 2.4 | |
| Oceania | 0.2 | 0.2 | 0.2 | 0.2 | |
1 In root equivalent.
Value of exports
| 1988-90 Average | 1991 | 1992 | 1993 | |
| Million $ | ||||
| World total1 | 1 071 | 1 105 | 1 288 | 1 056 |
| Thailand | 901 | 908 | 1 086 | 881 |
1 Excludes trade within EC.
Prices1
| 1988-90 Average | 1991 | 1992 | 1993 | |
| $/tonne | ||||
| Cassava pellets c.i.f. Rotterdam2 | 155 | 178 | 183 | 137 |
| Cassava-soybean meal3 | 180 | 190 | 196 | 156 |
| Barley4 | 197 | 221 | 237 | 197 |
1 In the EC, the major import market.
2 As of January 1992 prices are f.o.b.
3 Mixture made of 80 percent cassava pellets and 20
percent of soybean meal. Prices include a 6 percent ad-valorem
duty on cassava.
4 Selling price in Spain.
Exports1
| 1988-90 Average | 1991 | 1992 | 1993 | ||
| Million tonnes | |||||
| World total | 10.79 | 9.14 | 10.79 | 10.01 | |
| Developing countries | 10.79 | 9.14 | 10.79 | 10.01 | |
| Latin America | - | 0.01 | 0.05 | 0.05 | |
| Africa | - | 0.05 | 0.05 | 0.05 | |
| Far East | 10.72 | 9.08 | 10.69 | 9.92 | |
| China | 0.23 | 0.33 | 0.35 | 0.24 | |
| Indonesia | 1.21 | 1.20 | 1.09 | 1.14 | |
| Thailand | 9.19 | 7.50 | 9.18 | 8.46 | |
| Viet Nam | 0.06 | 0.03 | 0.03 | ||
1 In product weight of chips and pellets (1 tonne of flour equivalent to 2 tonnes of pellets).
Imports1
| 1988-90 Average | 1991 | 1992 | 1993 | ||
| Million tonnes | |||||
| World total | 10.29 | 8.92 | 10.77 | 10.04 | |
| Developing countries | 2.02 | 2.13 | 2.95 | 2.33 | |
| Latin America | 0.05 | 0.04 | 0.15 | 0.02 | |
| Africa | 0.02 | 0.01 | 0.06 | 0.07 | |
| Near East | 0.15 | 0.20 | 0.43 | 0.50 | |
| Far East | 1.83 | 1.89 | 2.30 | 1.74 | |
| China | 0.91 | 1.00 | 0.94 | 0.76 | |
| Korea, Republic of | 0.62 | 0.66 | 1.00 | 0.71 | |
| Developed countries | 8.27 | 6.79 | 7.82 | 7.72 | |
| North America | 0.18 | 0.19 | 0.26 | 0.10 | |
| Europe | 6.53 | 6.07 | 6.86 | 6.92 | |
| EC2 | 6.27 | 6.06 | 6.84 | 6.79 | |
| Eastern Europe | 0.20 | - | 0.02 | 0.06 | |
| Former USSR | 0.87 | 0.01 | 0.00 | 0.03 | |
| Other developed countries | 0.64 | 0.51 | 0.67 | 0.66 | |
| Israel | 0.10 | 0.06 | 0.11 | 0.08 | |
| Japan | 0.53 | 0.44 | 0.52 | 0.56 | |
| South Africa | - | - | 0.04 | 0.02 | |
1 In product weight of chips and pellets (1 tonne
of flour equivalent to 2 tonnes of pellets).
2 Excluding trade among member countries of the EC.