Production recovered in 1993
Global output was estimated at 58 million tonnes, close to the record levels of 1990 and 1991. In the developing countries, notably India, production was above average but below the 1991 record. However, output in Pakistan fell for the second consecutive year, with chickpeas, the country's main pulse crop, being affected by disease and frost. Production was also down in Thailand, Bangladesh and Nepal, largely due to smaller plantings and yields reduced by adverse weather conditions. In the Near East, total production fell for the second consecutive year. In Turkey, the region's major producer, the downward trend in output continued into 1993 reflecting a rise in production costs relative to prospective prices.
In Africa, total pulse output was estimated to have remained close to that of the previous year. Crops in several countries of northern and eastern Africa were affected by irregular rainfall, disease and shortages of seed and fertilizer. By contrast, production recovered in Zaire, Malawi and Mozambique, with more favourable weather.
In Latin America and the Caribbean, total output dropped for the second consecutive year, mainly because a severe drought in Brazil's northeast sharply curtailed plantings and yields. Argentina's pulse crop contracted in response to a glut and depressed prices in the previous year and was further diminished by bad harvest weather. In Mexico, production recovered from the drought-reduced level of 1992.
Output of the developed countries continued to recover although it remained below the average for 1988-1990. In North America the harvest was big, 2.6 million tonnes, in spite of unfavourable weather conditions, mainly due to an unprecedented expansion of plantings in Canada. This expansion was spurred by the rise in earnings from pulses in 1992 relative to competing grain and oilseed crops. In the United States, by contrast, production recovered only slightly in the shadow of high stocks and reduced export prospects.
In the EC, earlier expectations that the area seeded to pulses would decline with the new set-aside regulations did not materialize. One reason for the expansion in plantings in 1993 was that farmers were offered attractive compensatory payments to grow protein crops. The crop amounted to 5.9 million tons, close to the 1990 record. By contrast, production in Eastern Europe was adversely affected by drought as well as by reduced input use. In countries of the former USSR, production also declined with lower demand for pulses from the contracting livestock sector. Australia's production dropped by over 10 percent as there was dry weather and a shift into wheat and barley, while favourable weather in South Africa allowed yields and production to recover somewhat from the drought-reduced level of 1992.
Utilization also recovered
Global consumption of pulses recovered during 1993 with an increase in both food and feed use. Food consumption in Asia rose with expanded supplies, particularly in India, while consumption in Africa dropped further. Feed consumption in the developing countries expanded for the third consecutive year. In the developed countries, consumption of pulses as food remained unchanged, while feed use recovered but was still below the 1988-90 average level. In Eastern Europe and countries of the former USSR, feed utilization of pulses continued to be depressed by a decline in the livestock industry.
Pattern of trade changed within a static total
Global pulse trade amounted to 6.4 million tonnes in 1993, close to the level of the two previous years. Within the total, imports by India and the EC fell slightly. In India, the decline reflected larger output while in the EC import demand for feed pulses seemed to decline with keener competition from domestically produced grains following the reform of the Common Agricultural Policy. Other countries where foreign purchases fell included Algeria, Cuba and Venezuela. By contrast, Mexico, Morocco and Pakistan expanded imports to compensate for reduced domestic supplies. South Africa, normally an exporter, imported pulses for the second consecutive year, as domestic supply again fell short of demand.
For the developing country exporters, shipments from China grew, but were largely offset by declines elsewhere. Shipments from Argentina and Chile fell markedly as a result of both reduced import demand and a sharp reduction in exportable surpluses. Exports from Thailand and Turkey continued to be affected by increasing international competition.
Total exports from the developed countries rose, mainly reflecting a boost in Australia's shipments following stronger demand from import markets, notably from Pakistan and Sri Lanka. Canada maintained its role as a leading exporter while shipments from the United States remained depressed, mainly reflecting lower import demand from customary buyers in Latin America and North Africa.
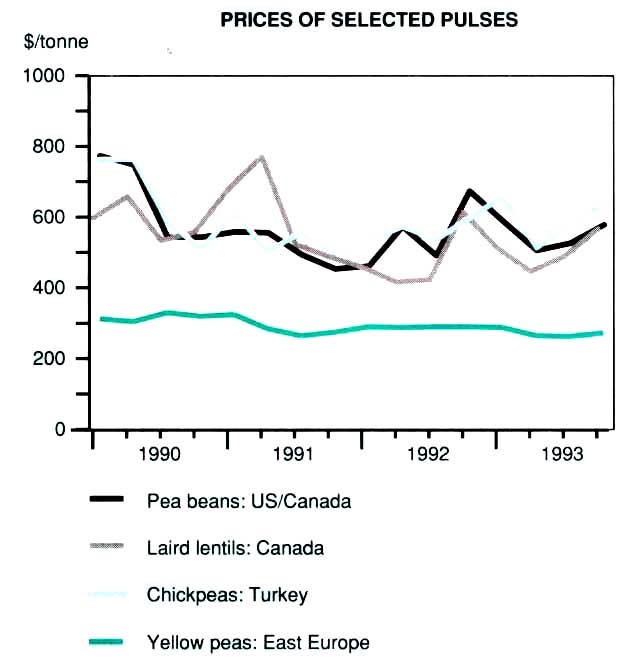
No major price changes in 1993
Ample stocks in most of the developed exporting countries continued to hold down international prices for most pulses in 1993. In addition, reduced demand for feed pulses in the EC contributed to a downward pressure on prices for peas, while bean prices were depressed by a contraction of import demand in countries supplied by the United States. World lentil markets were characterized by large carry-over stocks, increased competition among exporters and a slight drop in demand. By contrast. prices for chickpeas continued to rise, mainly reflecting strong demand from Pakistan and India in the second half of the year. The estimated total value of exports was similar to that of 1992, as were average export unit values. The developing countries' share in ,global export earnings increased to 47 percent.
Some reduction in world trade likely in 1994
Prospects for export supply and import demand indicate a slight fall in the volume of trade in 1994. This would be largely due to lower import demand in some countries, notably in Central America, North Africa and the EC. The anticipated volume of imports by India was still uncertain as a poor Kharif crop harvested in late 1993 would stimulate imports in early 1994, but this may be offset by an increase in the subsequent Rabi crop, for which prospects are favourable. Similarly, Pakistan's imports could fall from the record level in 1993, should an average crop be harvested in early 1994. In Brazil, by contrast, imports were expected to increase slightly due to the shortfall in 1993 production and lower government stocks. Also in Mexico, import demand may rise in 1994 as the announced reforms of the agricultural support system could lead to a contraction of bean production.
On the supply side, export availabilities in Eastern Europe, Australia and parts of Africa were forecast to fall, mainly because of reduced crops in 1993. No change was expected in exports from North America where bad weather degraded the voluminous crop and largely consigned it to be used domestically as feed. With the prospect that supplies of food quality pulses might be reduced until the harvest in the northern hemisphere in late 1994, Argentina and Chile have stepped up plantings.
Competition among major lentil exporters was likely to remain keen in 1994 tending to hold down international prices for lentils. By contrast, chickpea prices could be supported by reduced world supplies and a growth in import demand. Prices for feed quality pulses were likely to be held down by the degradation to feed use of other crops harvested in many areas in late 1993, together with the anticipated reduction in import demand in the EC.
Production
| 1988-90 Average | 1991 | 1992 | 1993 | ||
| Million tonnes | |||||
| World total | 56.1 | 58.6 | 55.6 | 58.0 | |
| Developing countries | 36.4 | 41.3 | 37.8 | 39.5 | |
| Brazil | 2.5 | 2.8 | 2.8 | 2.5 | |
| Turkey | 2.1 | 2.0 | 1.8 | 1.7 | |
| China | 5.7 | 6.9 | 7.0 | 6.9 | |
| India | 12.7 | 14.4 | 12.0 | 14.0 | |
| Developed countries | 19.8 | 17.2 | 17.8 | 18.5 | |
| United States | 1.4 | 1.8 | 1.2 | 1.3 | |
| EC | 5.5 | 5.2 | 5.2 | 5.9 | |
| Former USSR | 8.6 | 5.1 | 6.5 | 6.2 | |
| Australia | 1.4 | 1.8 | 2.0 | 1.7 | |
Utilization
| 1988-90 Average | 1991 | 1992 | 1993 | ||
| Million tonnes | |||||
| World total1 | 56.6 | 60.0 | 54.3 | 58.0 | |
| FOOD USE | |||||
| World total | 32.2 | 35.0 | 33.0 | 34.8 | |
| Developing countries | 29.0 | 31.5 | 29.6 | 31.4 | |
| Brazil | 2.3 | 2.3 | 2.3 | 2.3 | |
| China | 3.3 | 3.4 | 3.4 | 3.4 | |
| India | 11.3 | 12.0 | 10.5 | 11.9 | |
| Developed countries | 3.2 | 3.5 | 3.4 | 3.4 | |
| FEED USE | |||||
| World total | 17.3 | 18.4 | 15.3 | 16.9 | |
| Developing countries | 3.2 | 3.4 | 3.6 | 3.9 | |
| Developed countries | 14.2 | 15.1 | 11.7 | 13.0 | |
1 Including: food, feed, seed, waste, processed and other utilization.
Value of exports1
| 1988-90 Average | 1991 | 1992 | 1993 | |
| Million dollars | ||||
| World total | 2289 | 2415 | 2 230 | 2 290 |
| Developing countries | 926 | 943 | 910 | 1 085 |
| Developed countries | 1 363 | 1 472 | 1 320 | 1 205 |
1 Excluding lupins.
Exports1
| 1988-90 Average | 1991 | 1992 | 1993 | ||
| '000 tonnes | |||||
| World total | 6040 | 6400 | 6360 | 6439 | |
| Developing countries | 2312 | 2272 | 2568 | 2530 | |
| Argentina | 153 | 212 | 254 | 160 | |
| Turkey | 746 | 550 | 431 | 440 | |
| China | 601 | 805 | 853 | 980 | |
| Developed countries | 3728 | 4128 | 3792 | 3909 | |
| Canada | 397 | 433 | 638 | 620 | |
| United States | 629 | 615 | 469 | 450 | |
| EC2 | 1 732 | 2019 | 1 524 | 1 528 | |
| Hungary | 230 | 170 | 165 | 145 | |
| Australia | 377 | 394 | 370 | 669 | |
Imports1
| 1988-90 Average | 1991 | 1992 | 1993 | ||
| '000 tonnes | |||||
| World total | 6 017 | 6350 | 6356 | 6439 | |
| Developing countries | 2570 | 2375 | 2435 | 2642 | |
| Algeria | 122 | 145 | 91 | 50 | |
| China | 92 | 80 | 126 | 106 | |
| India | 716 | 366 | 468 | 400 | |
| Pakistan | 126 | 86 | 140 | 240 | |
| Developed countries | 3447 | 3 978 | 3 921 | 3797 | |
| United States | 64 | 75 | 77 | 75 | |
| EC2 | 3025 | 3 539 | 3369 | 3300 | |
| Japan | 183 | 187 | 209 | 190 | |
1 Excluding lupins .
2 Includes trade within EC.
Prices1
| 1988-90 Average | 1991 | 1992 | 1993 | |
| $/tonne | ||||
| Light speckled kidney beans, China | 605 | 572 | 473 | 458 |
| Alubia beans. Argentina | 839 | 780 | 512 | 694 |
| Pea beans, US/Canada | 714 | 517 | 552 | 551 |
| Yellow peas. East Europe | 303 | 292 | 294 | 277 |
| Red lentils. Turkey | 496 | 667 | 633 | 448 |
| Laird lentils, Canada | 519 | 617 | 479 | 505 |
| Chick peas, Turkey | 551 | 546 | 562 | 600 |
1 C.i.f. north European port.