Consumption expansion slow in 1993
World consumption of fats and oils grew by an 2.5 percent in 1993, that is less than the rate of growth during the 1980s of 3.8 percent per year. The slower growth reflected another year of sluggish expansion of the world economy. The slow growth in world consumption also reflected the adjustments to the changed economic environment in Eastern Europe and the countries of the former USSR. There an upsurge in consumer prices has reduced consumption since 1991 to well below levels in earlier years. In addition, imports of many countries were constrained by a continuing scarcity of foreign exchange. However, in India, bumper oilseed crops contributed to a boost in consumption.
For oilmeals, the increase in global consumption in 1993, at 2 percent, was below the 3.7 percent of the 1980s. There was a further sharp fall in countries of the former USSR and, to a lesser extent, in most Eastern European countries. In this area, oilmeal consumption was, by 1993, less than 60 percent of its level in the late 1980s as the transition to a market economy has been accompanied by a severe shrinkage of the livestock sector. Also, in countries of the former USSR, foreign exchange constraints continued to delay the implementation of policies aimed at increasing the oilmeal content of livestock rations. Little growth occurred in the EC as one effect of the Common Agricultural Policy (CAP) reforms was to lower prices of feed grains, thus they tended to displace oilmeals in feed rations, especially in the second half of the year. This contraction in use of oilmeals has been accentuated by a rise in their price. By contrast, in many other important consuming countries where the livestock economy, especially the pig and poultry sectors, continued to grow and where favourable feed/livestock price ratios enhanced the profitability of livestock feeding, oilmeal consumption expanded. In China, however, growth in utilization was weakened by a decline in output of meals.
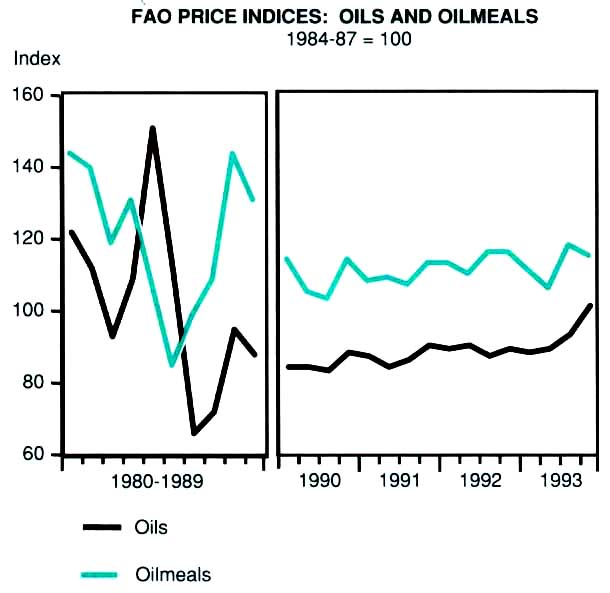
FAO price indices: oils and oilmeals 1984-87 = 100
Oil output below trend, but oilmeals above trend in 1993
World production of fats and oils increased by 2 percent to 97 million tonnes in 1993, and that of oilmeals by 4 percent to 57 million tonnes. While the production of oils was somewhat below the long-term trend, that of oilmeals was somewhat above trend. This divergence reflects changes in the pattern of output discussed below.
The developing countries increased their output by 6 percent for oils, and by 5 percent for oilmeals. This accounted for the entire expansion in world production of oils, and two thirds of the expansion in oilmeals. The Far East was again the main growth area for production of oils, with an increase of 8 percent, mainly in India, Indonesia and Malaysia. Oilmeal output grew by 3 percent in this region. In Latin America, a further sizeable expansion in Brazil was partly offset by a fall in Argentina and the region's output rose 3 percent for oils and 6 percent for oilmeals.
World production of major oilseeds1
| 1986/89 1990/91 Average |
1991/ 1992 |
1992/ 1933 |
1993/ 1904 |
|
| Million tonnes | ||||
| Soybeans | 102.4 | 107.2 | 117.1 | 112.7 |
| Sunflowerseed | 22.0 | 22.5 | 21.6 | 22.6 |
| Groundnut | 23.8 | 23.2 | 24.2 | 23.4 |
| Cottonseed | 33.2 | 38.1 | 32.9 | 33.1 |
| Rapeseed | 23.5 | 28.5 | 26.3 | 28.2 |
| Copra | 4.9 | 4.3 | 4.7 | 4.8 |
| Palm kernels | 3.6 | 3.8 | 4.2 | 4.4 |
| Linseed | 2.6 | 2.6 | 2.0 | 2.4 |
1 The split years bring together northern hemisphere annual craps harvested in the latter part of the first year shown, with southern hemisphere annual crops harvested in the early pan 0 the second year shown. For tree crops, which are produced throughout the year, calendar year production for the second year show is used.
In the developed countries, the substantial increase in the soybean crop, with its high oilmeal content, was reflected in a 3 percent expansion in oilmeal output. In contrast, oil output fell by 3 percent as the increase in soybeans was more than offset by declines in other oilseeds with a higher oil content. Unfavourable weather depressed yields in most producing areas excepting the United States. Lower yields were compounded by the negative impact on plantings of unsettled economic and social conditions in Eastern Europe and the countries of the former USSR and by the reforms of the EC CAP.
Trade growth halted in 1993
The long-term expansion of the quantities of oils and oilmeals entering international trade seemed to have come to a halt in 1993, with trade in oils stagnating and that in oilmeals declining. There was a further large reduction in imports of both groups of commodities into Eastern Europe and the countries of the former USSR, particularly the Russian Federation, reflecting changes in levels of both demand and of supplies in these countries. In the EC, with lower domestic production of both oils and oilmeals, imports of oils were estimated to have increased somewhat whereas those of oilmeals were reduced owing to a decline in demand in the second half of the year. India reduced imports of oils following increased domestic production. Foreign purchases by the United States rose, especially of coconut and palm oils which were attractively priced in 1993. Oil imports into China also rose as did Mexico's following reduced domestic output. Pakistan's purchases of oil on concessional terms contributed to a substantial increase in imports.
Although the volume of trade failed to grow, its value was expected to have increased reflecting higher international market prices, especially during the second half of the year.
Crop specific changes - no overall pattern in 1992/93
The larger output of oils and oilmeals in 1993 was on account of increased production of soybeans, groundnuts, copra and oilpalm products, while there was a fall in production of cottonseed, rapeseed, sunflowerseed, and olive oil.
World soybean production rose by 9 percent to 117 million tonnes in 1992/93, a new peak. In the United States, the crop was 11 percent larger due to record yields on slightly expanded area. Among the other main crops of the northern hemisphere, those of China and India were favoured by good weather. China's output recovered by 6 percent after the setback of the previous year, while that of India rose by a dramatic 37 percent with a rapid expansion of plantings being aided by policy incentives and attractive market prices. By contrast, the harvest in the EC was 24 percent down as plantings were affected by the disincentives introduced with the new oilseed regime and unfavourable weather reduced yields. In the southern hemisphere, Brazil's harvest rose 19 percent to a new record after farmers expanded plantings and fertilizer use in response to greatly enlarged proceeds from the 1992 crop and increased subsidization of credit. In Argentina, the harvest was 3 percent smaller as a fall in yield, due to unfavourable weather, more than offset an increase in plantings.
The world groundnut harvest expanded in 1992/93 by 4 percent to 24.2 million tonnes (unshelled). India's bumper crop was 22 percent up on the previous year's drought-affected harvest reflecting an ideal monsoon production season and policy incentives. There was also a substantial recovery in Sudan. By contrast, production fell in some major exporting countries, including China and Senegal, because of drought, as well as in the United States and Argentina, because of reduced plantings.
World copra production rose 8 percent partly recovering from the drought-affected level of 1992. The recovery was particularly marked in the Philippines reflecting the lagged effect of beneficial rains in 1992.
World output of oilpalm products expanded again in 1993, by more than 10 percent, reaching a new peak. Production of palm oil was 14.3 million tonnes and that of palm kernels 4.2 million. In Malaysia, output was up 13 percent partly because of expansion in the area of mature palms but mainly because yields increased from the low levels of 1991 and 1992 when the palms were "resting". In Indonesia there was a further sharp expansion in area, and production rose 17 percent.
Among the oilseeds for which world production fell, the main one was cottonseed. Its output was 13 percent down in 1992/93 partly due to reduced plantings in a number of countries where unattractive lint prices prevailed, including in the United States. A 21 percent fall in China was mainly attributable to lower yields caused by drought. Production in the countries of the former USSR was estimated to have fallen 17 percent due to reduced plantings and unfavourable weather.
Rapeseed output fell 8 percent to 26.3 million tonnes. The largest reduction was in the EC stemming from the introduction of the new oilseed regime and other CAP reforms. Other notable reductions in 1992/93 were in Canada where adverse weather reduced planting and in India, due to insufficient moisture. By contrast, China's crop was 3 Percent larger despite some cut-back in plantings.
The world sunflowerseed harvest contracted by 4 percent to 21.6 million tonnes in 1992/93. Reduced plantings led to a fall of 28 percent in the United States and of 20 percent in Argentina where, in addition, unfavourable weather reduced yields. Weather also curtailed yields in the EC, where the harvest was 4 percent lower despite an increase in area sown. Smaller reductions also occurred in China and the countries of the former USSR. By contrast, there were increases in Eastern Europe and Turkey.
World output of olive oil fell 23 percent on account of a cyclical downturn in production. The fall in Italy was 40 percent, with drought exacerbating the effect of the cyclical downturn.
Among the animal products, modest increases were estimated for world production of lard and marine oils, in contrast there were small declines for butter, tallow and fishmeal.
1994 consumption growth forecast to continue for oils, uncertain for oilmeals
Demand for fats and oils could strengthen somewhat in 1994 should the expected acceleration of the expansion of the world economy materialize. Consumption growth would continue to be most pronounced in the newly industrialized countries. However, effective demand of many large importers would continue to be constrained by foreign exchange shortages. In the countries of the former USSR and Eastern Europe, the process of transition to a market economy, and its depressing effect on demand in the interim, was likely to continue in 1994.
Demand for oilmeals was expected to expand as growth in the high oilmeal-consuming pig, poultry and fish farming sectors was forecast in many countries, including the United States, Japan, China, Latin America and the newly industrialized countries of South-East Asia. In addition, there may be a continuation of the tendency, previously confined to the EC, to replace grains with oilmeal/cassava mixes in feed rations in a number of countries. Such an expansion in demand for oilmeals, however, would tend to be dampened by higher prices reducing the profitability of feeding them to livestock. Furthermore, expansionary tendencies were likely to be offset by the expected fall in demand in the EC, Eastern Europe and the countries of the former USSR. In the EC, the implementation of the reforms in the CAP for cereals reduced market prices for feedgrains from mid-1993, and further reductions will be effected in mid-1994 and mid-1995. Thus, the oilmeal/feedgrain price ratio rose substantially, and will increase further, causing displacement of oilmeals by grains in feed rations. Such a tendency would be accentuated in 1994 if oilmeal prices remained higher than in 1993. In Eastern Europe and the countries of the former USSR, the tendency for the livestock sector to shrink, as a result of falling consumption of livestock products and a shortage of feeds, was expected to continue into 1994, although at a reduced rate. Thus, oilmeal consumption in these countries, which account for some 10 percent of the world total, was likely to fall further. However, decline would be slower, should the Russian Federation be able to obtain imports on credit. On balance, oilmeal consumption in these areas seemed likely to fall by 5 percent to 18 million tonnes.
Output in 1994 likely to be less than consumption
World output of fats and oils was expected to increase in 1994 by 2.4 percent, but that of ailments to decline by two percent. On balance world production of oils at the forecast level of 88.8 million tons may be less than consumption with a consequent reduction in stocks of the previous crop and upward pressure on prices. World production of oilmeals at the forecast level of 55.9 million tonnes, could only accommodate an increase of 2.5 percent in consumption in the growing markets of the world, that is excluding those of Europe and the countries of the former USSR. However, expansion in these growth markets averaged 3 percent from the early 1980s. Thus, as in the case of oils, there is the prospect of a need to draw on old-crop stocks in 1994 to supplement new crop production, and of an upward pressure on prices.
Among the products, output of soybeans and groundnuts was likely to contract considerably, in contrast to an expected expansion in sunflowerseed, cottonseed, rapeseed, copra and oilpalm products.
The 1993/94 world soybean harvest was forecast to fall by 4 percent to 112.7 million tonnes. The fall was largely on account of a 16 percent reduction in the United States where bad weather limited the crop to 49.9 million tonnes. Contraction in the EC reflected the disincentives stemming from the new oilseed regime as well as the bad weather. Production increases occurred in China and India where the effects of policy incentives and attractive prices were enhanced by favourable weather. The main expansion, however, was likely to occur in South America. There a larger area was expected to be planted in the fourth quarter of 1993 in response to the higher prices induced by the shortfall in the United States. The combined harvest of Argentina, Brazil and Paraguay in early 1994 was forecast to increase by 9 percent to more than 38 million tonnes. Argentina's crop was expected to increase most as adverse weather at sunflower planting time was likely to result in a shift of land to soybeans, which are sown later.
The world groundnut harvest was forecast to be 3 percent smaller, at 23.4 million tonnes (unshelled). Unfavourable weather affected yields both in the United States, whose crop fell by 19 percent and in India, the largest producer, where the crop was estimated to be 14 percent less than in 1992193 at 7.4 million tonnes. In China, the second largest producer, the crop was estimated to be 9 percent up at 6.6 million tonnes. Increased crops were also forecast for the Sahel region in Africa.
For sunflowerseed, the 1993/94 harvest was forecast to rise by 4.6 percent, with the bulk of the increase taking place in the United States in response to policy and price incentives. An increase was also forecast for countries of the former USSR, as harvesting weather was more favourable than in 1992 and in China, where economic reforms continued to encourage planting of this and other cash crops. Spain's oilseed sector was likely to raise EC production, as it was not yet fully integrated into the new oilseed regime, and did not bear the full brunt of the disincentives. In Argentina a reduced crop was forecast for the harvest in early 1994 as unfavourable weather at planting time prevented farmers from fulfilling their intentions.
Cottonseed production was forecast to increase by one percent to 33 million tonnes. Output in the United States increased by 1.5 percent as the effect of adverse weather was more than offset by an 18 percent recovery in plantings. In the countries of the former USSR the weather was not as bad as in 1992193, and output was forecast to increase, although it would remain below the level of some earlier years. China's crop was forecast to be substantially reduced following a contraction in the area planted.
The 1993/94 rapeseed harvest was forecast to be 7 percent above the previous year's depressed level. Canada's crop, although affected by bad weather, reached a new record, 45 percent above the 1992/93 weather-damaged crop, as farmers increased plantings in response to higher world market prices. Higher prices in India were also expected to result in increased plantings and a larger crop. In contrast, prices in China were down tending to reduce output. In the EC, farmers reacted to the introduction of the new oilseed regime and other CAP reform measures by further reducing the area sown. The reduction was 7 percent after the 5 percent reduction of the previous year, however, with more favourable weather than in 1992/93 output was estimated to be down by only 2 percent.
World copra production was forecast to increase by 3 percent to 4.8 million tonnes on the expectation of a continuation of the recovery which began in the Philippines in 1993 and in Indonesia in 1992.
Global production of oilpalm products was forecast to increase by 6 percent in 1994, considerably less than the above-average growth of over 10 percent in 1993. Production of palm oil was expected to reach 15.2 million tonnes and that of palm kernels 4 million tonnes with Indonesia again expanding its output at a higher rate than Malaysia.
A cyclical upturn in olive oil was forecast to raise production by 16 percent in 1993/94. Little change was expected in the production of butter, lard, marine oils and tallow.
Prices increased in 1993
International market prices for oils and oilmeals reflected the 1993 conditions of supply and demand during the first half of the year but in the third quarter they were more and more affected by the 1994 prospects.
During the first half of 1993, the overall level of prices, as measured by the FAO price indices of international market prices, was slightly below that of the previous year for both groups of commodities. The downward tendency reflected ample overall supplies relative to import demand. There were, however, considerable changes in price relationships within the vegetable oils sector. Thus, with the recovery in export availabilities of coconut oil and the steady increase in those of palm kernel oil, the decline in the price of the two oils which started in February 1992 continued well into 1993. By April, both oils were selling at a discount to soybean oil after having commanded a substantial premium for over a year. The ample supplies of palm oil were sold at competitive prices and gained market share. Soft oils, on the contrary, were priced somewhat higher than in the first half of 1992 reflecting reduced crops in exporting countries in the case of rapeseed and sunflower oils and, in the case of soybean oil, the reduced demand for the meal which restrained crushing.
From the third quarter of 1993, the international market was heavily influenced by the prospective reduction in the forthcoming soybean crop in the United States and the consequent scarcity of oils and oilmeals during 1994. Prices of soybean oil in the fourth quarter rose to average 25 percent above those 12 months earlier, although the uplift for soybean meal was only 2 percent due to reduced demand from importing countries. The price of palm oil was an exception to the general lift in prices as this oil was expected to remain in ample supply throughout 1994. The overall FAO price index for oils was up 14 percent, in contrast there was a slight decline for oilmeals relative to the fourth quarter of the previous year.
Production1
| 1988-90 Average | 1991 | 1992 | 1993 | |||
| Million tonnes | ||||||
| WORLD TOTALS | ||||||
| All fats and oils | 79.67 | 82.19 | 85.37 | 87.04 | ||
| Edible/soap fats and oils | 77.79 | 80.09 | 83.43 | 85.22 | ||
| Edible fats | 11.31 | 11.06 | 11.12 | 11.12 | ||
| Butter (fat content) |
6.36 | 6.10 | 5.96 | 5.92 | ||
| Lard | 4.95 | 4.96 | 5.16 | 5.20 | ||
| Soft Oils2 | 43.69 | 44.99 | 47.86 | 47.82 | ||
| Soybean | 15.63 | 15.61 | 16.49 | 18.19 | ||
| Sunflowerseed | 7.79 | 8.28 | 8.19 | 7.82 | ||
| Groundnut | 4.06 | 3.97 | 3.92 | 4.18 | ||
| Cottonseed | 3.40 | 3.57 | 3.80 | 3.31 | ||
| Rapeseed | 7.96 | 8.81 | 9.87 | 9.03 | ||
| Olive | 1.92 | 1.57 | 2.41 | 1.85 | ||
| Lauric acid oils | 4.53 | 4.67 | 4.40 | 4.79 | ||
| Coconut | 3.01 | 3.09 | 2.71 | 2.94 | ||
| Palm kernel3 | 1.52 | 1.58 | 1.69 | 1.85 | ||
| Others4 | 18.26 | 19.37 | 20.05 | 21.49 | ||
| Tallow and greases | 5.77 | 5.74 | 5.78 | 5.70 | ||
| Palm | 10.67 | 11.94 | 12.87 | 14.34 | ||
| Marine | 1.53 | 1.40 | 1.10 | 1.15 | ||
| Technical oils5 | 1.50 | 1.70 | 1.56 | 1.43 | ||
| Linseed | 0.79 | 0.96 | 0.82 | 0.64 | ||
| Castorseed | 0.50 | 0.52 | 0.53 | 0.57 | ||
| Tung | 0.07 | 0.08 | 0.08 | 0.08 | ||
| Miscellaneous oils6 | 0.38 | 0.40 | 0.38 | 0.39 | ||
| REGIONAL TOTALS | ||||||
| Developing countries | 41.42 | 44.15 | 45.85 | 48.60 | ||
| Latin America | 10.55 | 10.19 | 10.70 | 10.97 | ||
| Argentina | 3.29 | 3.92 | 3.85 | 3.38 | ||
| Brazil | 4.68 | 3.67 | 4.48 | 5.08 | ||
| Africa | 3.76 | 3.95 | 4.16 | 4.04 | ||
| Near East | 1.58 | 1.44 | 1.32 | 1.65 | ||
| Far East | 25.19 | 28.21 | 29.25 | 31.50 | ||
| Indonesia | 3.15 | 3.86 | 4.19 | 4.81 | ||
| Malaysia | 6.63 | 7.09 | 7.36 | 8.28 | ||
| Developed countries | 38.25 | 38.04 | 39.52 | 38.44 | ||
| North America | 16.40 | 17.09 | 18.19 | 18.58 | ||
| United States | 14.29 | 15.04 | 15.83 | 16.53 | ||
| Europe | 13.67 | 12.95 | 14.09 | 12.83 | ||
| EC | 9.64 | 9.28 | 10.42 | 9.28 | ||
| Eastern Europe | 2.78 | 2.45 | 2.43 | 2.38 | ||
| Former USSR | 5.97 | 5.85 | 5.34 | 5.13 | ||
| Oceania | 0.99 | 1.06 | 1.08 | 1.04 | ||
1 The output of vegetable oils in a given year is
not based on actual crushings but is calculated by applying
extraction rates to the proportion of the oilseed crop, shown in
the text table, that is estimated to be available for crushing,
regardless of whether it is crushed in producing countries, or
exported in unprocessed form for crushing in importing countries,
or put into stock.
2 In addition to the oils listed, includes maize,
mustard, rice bran, safflower and sesameseed oils.
3 Including babassu oil.
4 In addition to the fats and oils listed, includes
sheanut butter.
5 In addition to the oils listed, includes poppyseed
and hempseed oils.
6 Mainly seed oils not elsewhere specified.
Exports1
| 1988-90 Average | 1991 | 1992 | |||
| Million tonnes | |||||
| WORLD TOTALS | |||||
| All fats and oils | 27.39 | 28.78 | 29.40 | ||
| Edible/soap fats and oils | 26.00 | 27.37 | 27.88 | ||
| Edible fats | 1.49 | 1.59 | 1.58 | ||
| Butter (fat content) | 0.71 | 0.68 | 0.68 | ||
| Lard | 0.38 | 0.36 | 0.26 | ||
| Margarine and shortening | 0.40 | 0.55 | 0.64 | ||
| Soft Oils2 | 13.16 | 13.67 | 14.51 | ||
| Soybean | 6.50 | 6.68 | 7.66 | ||
| Sunflowerseed | 2.30 | 2.35 | 2.39 | ||
| Groundnut | 0.64 | 0.65 | 0.66 | ||
| Cottonseed | 0.38 | 0.31 | 0.37 | ||
| Rapeseed | 2.48 | 2.55 | 2.40 | ||
| Olive | 0.38 | 0.56 | 0.42 | ||
| Lauric acid oils | 2.29 | 2.12 | 2.26 | ||
| Coconut | 1.45 | 1.31 | 1.52 | ||
| Palm kernel3 | 0.84 | 0.81 | 0.74 | ||
| Others4 | 9.06 | 9.99 | 9.53 | ||
| Tallow and greases | 2.11 | 2.02 | 2.13 | ||
| Palm | 5.88 | 7.00 | 6.53 | ||
| Marine | 0.66 | 0.52 | 0.42 | ||
| Technical oils | 1.33 | 1.35 | 1.47 | ||
| Linseed | 0.33 | 0.29 | 0.32 | ||
| Castorseed | 0.20 | 0.18 | 0.17 | ||
| Tung | 0.04 | 0.03 | 0.03 | ||
| Miscellaneous oils5 | 0.06 | 0.06 | 0.05 | ||
| REGIONAL TOTALS | |||||
| Developing countries | 14.68 | 16.26 | 15.92 | ||
| Latin America | 4.88 | 5.22 | 5.26 | ||
| Argentina | 2.72 | 3.78 | 3.43 | ||
| Africa | 0.52 | 0.62 | 0.56 | ||
| Near East | 0.21 | 0.19 | 0.18 | ||
| Far East | 8.76 | 9.89 | 9.53 | ||
| Indonesia | 1.09 | 1.75 | 1.31 | ||
| Malaysia | 6.00 | 6.41 | 6.53 | ||
| Developed countries | 12.71 | 12.52 | 13.48 | ||
| North America | 7.03 | 6.84 | 8.26 | ||
| Canada | 1.38 | 1.32 | 1.45 | ||
| United States | 5.65 | 5.52 | 6.81 | ||
| Europe | 4.57 | 4.64 | 4.40 | ||
| EC | 3.59 | 3.72 | 3.62 | ||
| Eastern Europe | 0.67 | 0.65 | 0.53 | ||
| Former USSR | 0.14 | 0.22 | 0.10 | ||
| Oceania | 0.65 | 0.66 | 0.67 | ||
1 Including oil equivalent of oilseeds; excluding
main re-exports of oil from imported oilseeds.
2 In addition to the oils listed, includes maize,
mustard, rice bran, safflower and sesameseed oils.
3 Including babassu oil.
4 In addition to the fats and oils listed, includes
sheanut butter, and hydrogenated oils.
5 In addition to the oils listed, includes poppyseed,
hempseed oils, boiled oils, fatty acid and acid oils.
6 Mainly seed oils not specified elsewhere.
Value of exports
| 1988-90 Average | 1991 | 1992 | ||
| Million $ | ||||
| World total | 16980 | 17870 | 19290 | |
| Developing countries | 6 160 | 6690 | 7420 | |
| Latin America | 1 570 | 1 660 | 1 640 | |
| Argentina | 990 | 1 220 | 1 140 | |
| Brazil | 440 | 290 | 360 | |
| Africa | 320 | 510 | 390 | |
| Near East | 270 | 420 | 420 | |
| Far East | 3 920 | 4020 | 4840 | |
| Indonesia | 470 | 560 | 690 | |
| Malaysia | 2210 | 2290 | 2740 | |
| Philippines | 400 | 310 | 500 | |
| Developed countries | 10820 | 11 180 | 11 870 | |
| North America | 1 640 | 1 420 | 1 910 | |
| Canada | 210 | 220 | 300 | |
| United States | 1 430 | 1 200 | 1 610 | |
| Europe | 8200 | 8 920 | 9 120 | |
| EC | 7660 | 8400 | 8640 | |
| Eastern Europe | 250 | 230 | 200 | |
| Former USSR | 190 | 110 | 70 | |
| Oceania | 630 | 600 | 670 | |