World fish catch stagnates
The 1992 fish catch regained the level of 99 million tonnes reflecting an increase in production by China of 2 million tonnes. In the 1980s marine catches grew constantly rising by almost one third in the decade. By contrast, in the early 1990s, many marine catches have fallen year by year, but inland water production and aquaculture output have increased.
At the Committee on Fisheries (COFI) meeting in March 1993, FAO reported that global fish production from most marine resources and many inland waters had reached or even exceeded their maximum sustainable yield. Overcapacity of world fishing fleets was identified as the main cause of fishery resources degradation. In many high seas areas inadequate management and over-fishing were recognised as the major problems. These factors have been addressed by the International Conference on Responsible Fishing and the UN Conference on Environment and Development (UNCED) with implementation of recommendations on responsible fishery supported by FAO.
In 1992 China's catch rose 14 percent from 13 to 15 million tonnes and was by far the largest output in the world. Chile, too, expanded its fish catch by 8 percent. Production in many developed countries tended to decline. The total output of the countries of the former USSR was 44 percent less than the 13.6 million tonne peak reached in the late 1980s. Japan's fishery output also continued to decline reflecting decreased sardine catches and a further decline in landings of Alaska pollack. In addition North American fish production declined by 3 percent due to problems with the cod fisheries in Canada. In 1993, the catch was estimated to have decreased even more as further areas were shut down for cod fishing.
Norway was one of the few developed countries reporting an increase in catches in 1992 and 1993. The healthy cod resource in the Barents Sea was the main reason behind the increase, combined with higher cultured salmon production in 1993. In addition, Iceland's catch recovered rising by a half a million tonnes from the depressed level of 1991.
The global value of the fish trade increased in 1992 reflecting considerably higher prices for the decreased volume of fish entering international trade. The United States continued to be the main exporter of fishery products, valued at $3 600 million. Thailand maintained its second position among fish exporters, though its industry experienced substantial problems in 1992. Its exports increased by 6 percent to $3 100 million. The EC as a group increased its exports, but a substantial share of them were to other EC members and will be excluded from EC export figures in the future. The crisis in the Canadian fishery industry was reflected in its export performance and was one of the few countries reporting lower export values in 1992 than in 1991.
The developing countries as a group accounted for 45 percent of world trade in 1992. The slight increase in overall exports arose from notable increases such as those of China and Thailand being almost offset by the Republic of Korea's 9 percent decrease.
The developed countries accounted for 86 percent of world fish imports. Japan maintained its position as top importer in 1992 accounting for 28 percent of the global total for a value of $12 800 million. The United States, the second major market for fishery products. reported fish imports stable at $6 000 million. In the EC. recession and currency devaluation influenced fish imports and growth slowed to 2 percent. In Italy, imports of fishery products declined in 1992 for the first time after years of continuous growth.
Individual commodities in 1993
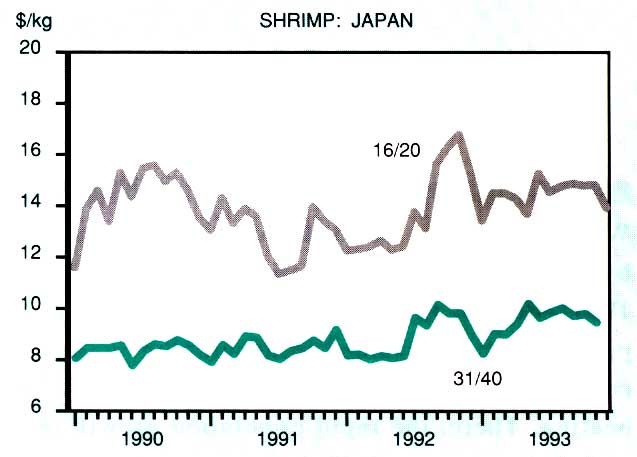
Dramatic reports about the reduction in China's shrimp production overshadowed the market in 1993. The drop in China's shrimp culturing was put at 85 percent by traders, though a 65 percent drop seemed more realistic. As a result there was a ready market for white shrimp from Southeast Asia. Black tiger production did not grow, as Indonesia continued to have disease problems. As for wild shrimp, the coldwater shrimp catch was expected to increase somewhat in 1993 over the 1992 level. Production of wild shrimp from tropical waters was expected to be maintained. However, overall shrimp production was estimated to be 50000 to 100000 tonnes below the 1992 level.
Shrimp prices moved upward in all the main markets, as supplies continued to be scarce throughout the year. Traders' margins were reduced as some consumer price resistance was felt at the retail level and the price increase could only be passed on gradually. Even so some traders and consumers were to be expected to move away from shrimps.
Imports of shrimp into Japan increased sharply in the first half of 1993, but in the second half the expansion of supplies slowed and prices moved up. Total imports during 1993 were expected to exceed 285 000 tonnes. Indonesia continued to be Japan's main supplier, despite the problems encountered by its aquaculture industry. Thailand came a close second.
Domestic shrimp landings in the United States were again depressed, and most of the increased demand was met by import expansion. Supplies from Asia expanded in 1993, replacing those from Latin America The EC market was generally static in 1993 as recession overshadowed the business. However, in the closing months of the year there were timid signs of expansion. Prices in Europe moved up for tropical shrimp, especially for black tiger, but coldwater shrimp was in ample supply and prices tended downwards.
In 1993 the aquaculture industry seemed to have reached a point of stability or even decline after years of outstanding growth. The major producing countries reached their peak production level, and most of them have moved into decline. Countries like Ecuador and Thailand were expected to maintain production, while output in other countries, including China, Indonesia and the Philippines, was likely to contract further. In this climate shortages will continue. The shortage of Chinese shrimp would benefit black tiger producers, especially in Thailand where no disease problems have been experienced.
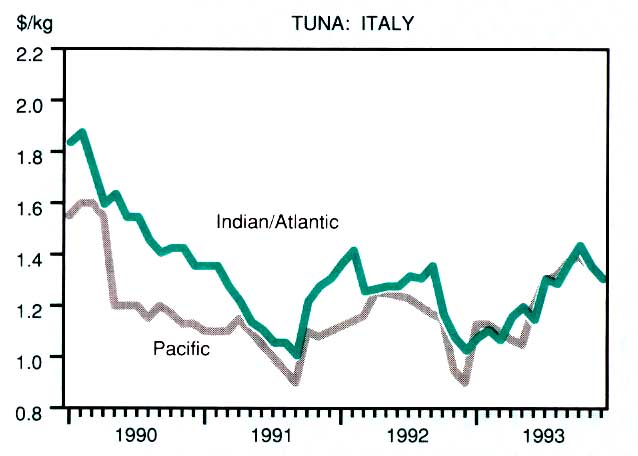
Tuna catches continued to be depressed in all the main fishing areas and prices moved upwards in 1993. Italian canneries paid $1 400/tonne for yellowfin at the end of 1993, which was 40 percent up on the year. Thai canneries too faced a 40 percent price increase for their raw material over the year and skipjack reached $1 000/tonne in late 1993. Canners started to pass on these price increases to their clients. Yet after the years of relatively low and stable prices for canned tuna consumers were reluctant to pay more. Future price developments strongly depend on the outcome of discussion between the Mexican tuna industry and authorities in the United States. If the import ban on tuna caught in the Central Eastern Pacific were to be removed, prices would probably go down again.
There was some discussion among environmental groups of the use of the "dolphinfriendly" logo. Greenpeace, for example, strove to strengthen the scientific content of its approach. It was thus expected that the dolphin issue, which created huge problems for the Mexican, Ecuadorian and Venezuelan tuna fleets, would be overcome soon.
Sales of groundfish in the United States expanded in the summer and autumn of 1993 but remained very sensitive to prices. The groundfish block market in the United States was depressed and cod block prices declined towards the end of 1993. In contrast, Alaska pollack was scarce as fishing stopped in many areas, and prices went up. Earlier in 1993, huge quantities of Alaska pollack from the Russian fleet had arrived in the United States swamping the market.
The EC market continued to be overshadowed by the recession. However, some traders saw signs of expansion especially towards the end of 1993. Early in 1993, the arrival of low priced cod from Russia led to protests by Community fishermen. The EC then enforced a reference price on groundfish species, which helped to stabilize the market, however the prices of cod did not recover during the remainder of 1993.
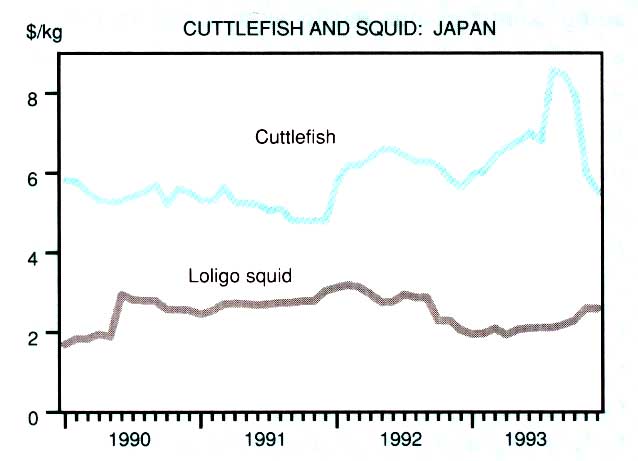
The most valuable species in the cephalopod group, the octopus, had a rest period in the Central Eastern Atlantic in October 1993. This followed a glut earlier in the year and a meeting of the main octopus producing countries where certain stock protection measures and an unified count system were agreed. Squid prices in Europe continued to decline as those for Thai products were undermined by increased imports from India. The Indian product played .an important role on the French market, while Italy's importers still preferred Thai squid. In contrast, cuttlefish was scarce all through the year and prices moved upwards.
The glut on the salmon market became more and more acute in the closing months of 1993 despite strong pre-Christmas buying. Cultured salmon production was up about 20 percent reflecting the success of the main producing countries in eradicating disease and in raising feed use efficiency. Fish farmers in Norway tried to reduce output by giving less feed to their salmon, nevertheless production was expected to exceed 150 000 tons. Prices of Norwegian salmon fell to $4/kg in November 1993, the lowest for some time. EC farmers of salmon asked the Community to control imports from Norway, by enforcing a minimum import price. This was likely to be introduced in 1994 with prices based on producer prices and import prices over the last three years. Wild salmon was abundant on the market, and prices were around $2.50/kg for the lower priced species. Salmon which used to be a luxury item, is now selling for little more than cod.
The canned small pelagic market was influenced in 1993 by the controversy between Portuguese and Moroccan traders about access to the EC market. Morocco's duty free quota was abolished in 1992 and was replaced by a reduced regular rate of duty of 8 percent, with a further reduction to 5 percent by 1996. Moroccan canners subsequently asked for a substantially lower tariff to meet the increased competitiveness of canners in Portugal and Spain following a devaluation of their currencies. A reflection of the strong competition between Portuguese and Moroccan canners was the notable decline in prices for canned sardine. In the United States the market was stable but canned sardines from Peru, Portugal and Chile replaced those from former Yugoslavia, which used to be an important supplier to the United States.
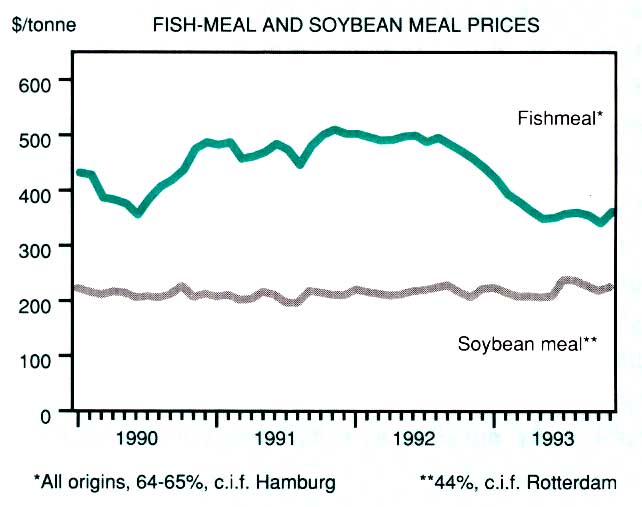
The major fishmeal exporting countries reported a 6 percent increase in production in 1993. This increase came entirely from catches by Peruvian vessels, while all other fishmeal exporters reported reduced production. Total Peruvian fishmeal production was estimated to exceed 1.6 million tonnes in 1993, the highest output for some 20 years. Only before the anchoveta crisis, in 1971, had fishmeal production been higher. Peru's production became the largest in the world, exceeding Japan's, which declined further to about 400 000 tonnes in 1993. Production in Chile also declined by about 10 percent, as did that in Scandinavia with reduced Danish output.
The ratio of fishmeal to soybean meal prices was only 1.7 towards the end of 1993, down from 2.4 twelve months earlier. Feed producers in Europe and the United States took advantage of this relative decline in prices and expanded imports. In contrast, China, with relatively large stocks, bought less in 1993 than in 1992. The immediate outlook was that feed producers would continue to substitute fishmeal for soybean meal and as stocks in producing countries decline prices of fishmeal were expected to increase somewhat.
Fish oil production increased considerably in 1993 relative to the depressed level of 1992. Peru was the main producer, as it was of fishmeal, and also returned to being a major exporter in contrast to 1992 when it was an importer. In addition, Chile and the United States increased production, while it declined further in Japan where supplies were supplemented by imports.
The ratio of fish oil to soybean prices was 0.75 in late 1993, down from 0.92 in August 1992. Prices of soyoil exceeded $500/tonne in July 1993, their highest level for 5 years. Fish oil has also declined relatively to palm oil, the price ratio failing to 0.89 from 0.93 a year earlier. In addition, an expansion of demand for fish oil was expected to follow the introduction of new products and in the United States it seems that fish oil can at last be used in margarine production. The extension of uses will increase the market for fish oil quite substantially.
Production1
| 1988-90 Average | 1991 | 1992 | ||
| Million tonnes | ||||
| World total | 98.98 | 97.15 | 99.19 | |
| Developing countries | 55.31 | 58.93 | 62.16 | |
| Latin America | 16.93 | 17.35 | 17.77 | |
| Argentina | 0.51 | 0.64 | 0.70 | |
| Brazil | 0.83 | 0.80 | 0.80 | |
| Chile | 5.62 | 6.00 | 6.50 | |
| Ecuador | 0.67 | 0.38 | 0.38 | |
| Mexico | 1.41 | 1.43 | 1.43 | |
| Peru | 6.79 | 6.94 | 6.84 | |
| Africa | 3.90 | 3.97 | 4.15 | |
| Morocco | 0.55 | 0.59 | 0.55 | |
| Nigeria | 0.30 | 0.27 | 0.32 | |
| Senegal | 0.28 | 0.32 | 0.32 | |
| Near East | 1.50 | 1.36 | 1.46 | |
| Turkey | 0.51 | 0.36 | 0.45 | |
| Far East | 32.60 | 35.84 | 38.42 | |
| China | 11.22 | 13.13 | 15.01 | |
| India | 3.52 | 4.04 | 4.17 | |
| Indonesia | 2.93 | 3.25 | 3.36 | |
| Korea, Republic of | 2.80 | 2.52 | 2.68 | |
| Philippines | 2.11 | 2.31 | 2.33 | |
| Thailand | 2.71 | 3.07 | 3.07 | |
| Developed countries | 43.67 | 38.22 | 37.03 | |
| North America | 7.47 | 7.02 | 6.84 | |
| Canada | 1.60 | 1.53 | 1.24 | |
| United States | 5.87 | 5.49 | 5.60 | |
| Europe | 12.33 | 11.32 | 12.50 | |
| EC | 7.22 | 6.85 | 7.08 | |
| Denmark | 1.81 | 1.79 | 1.99 | |
| France | 0.90 | 0.81 | 0.81 | |
| Germany | 0.40 | 0.30 | 0.31 | |
| Netherlands | 0.44 | 0.44 | 0.44 | |
| Spain | 1.53 | 1.35 | 1.35 | |
| United Kingdom | 0.85 | 0.82 | 0.83 | |
| Eastern Europe | 0.93 | 0.70 | 0.72 | |
| Poland | 0.56 | 0.46 | 0.51 | |
| Other, Europe | 3.43 | 3.17 | 4.15 | |
| Norway | 1.82 | 2.10 | 2.55 | |
| Iceland | 1.59 | 1.05 | 1.58 | |
| Former USSR | 11.01 | 9.22 | 7.67 | |
| Oceania | 0.76 | 0.84 | 0.91 | |
| Australia | 0.20 | 0.23 | 0.23 | |
| New Zealand | 0.56 | 0.61 | 0.68 | |
| Other developed countries | 12.10 | 9.82 | 9.11 | |
| Japan | 11.16 | 9.30 | 8.40 | |
| South Africa | 0.90 | 0.50 | 0.69 | |
1 Excluding cetaceans and seaweeds.
Source: FISHDAB
Exports
| 1988-90 Average | 1991 | 1992 | ||
| Million $ | ||||
| World total | 33255 | 38638 | 39286 | |
| Developing countries | 15029 | 17468 | 17659 | |
| Latin America | 3 323 | 3 979 | 4 148 | |
| Chile | 857 | 1 067 | ... | |
| Ecuador | 451 | 588 | ... | |
| Mexico | 432 | 393 | ... | |
| Peru | 427 | 491 | ... | |
| Africa | 1 278 | 1 516 | 1 480 | |
| Morocco | 453 | 609 | ... | |
| Senegal | 199 | 233 | ... | |
| Near East | 222 | 227 | 227 | |
| Far East | 9 767 | 11 294 | 11 360 | |
| China | 1 104 | 1 182 | 1 299 | |
| India | 422 | 571 | 615 | |
| Indonesia | 803 | 1 186 | ... | |
| Korea, Republic of | 1 562 | 1 492 | 1 360 | |
| Hong Kong | 715 | 642 | 623 | |
| Philippines | 405 | 468 | ... | |
| Singapore | 377 | 500 | 496 | |
| Thailand | 1 952 | 2 901 | 3 072 | |
| Developed countries | 18 226 | 21 170 | 21 627 | |
| North America | 4 840 | 5447 | 5665 | |
| Canada | 2 176 | 2 168 | 2081 | |
| United States | 2 664 | 3 279 | 3 584 | |
| Europe | 10 555 | 12 751 | 12 841 | |
| EC | 6 915 | 8 353 | 8420 | |
| Denmark | 1 921 | 2 302 | 2322 | |
| France | 812 | 926 | 977 | |
| Germany | 571 | 716 | 698 | |
| Netherlands | 1 114 | 1 356 | 1 411 | |
| Spain | 724 | 773 | 713 | |
| United Kingdom | 830 | 1 122 | 1 097 | |
| Eastern Europe | 240 | 234 | 234 | |
| Other, Europe | 3 400 | 4 164 | 4 187 | |
| Norway | 1 744 | 2 282 | 2437 | |
| Iceland | 1 109 | 1 280 | 1 253 | |
| Former USSR | 817 | 837 | 837 | |
| Oceania | 978 | 1 134 | 1 294 | |
| Australia | 515 | 578 | 639 | |
| New Zealand | 463 | 556 | 655 | |
| Other developed countries | 1 036 | 1 001 | 990 | |
| Japan | 921 | 839 | 792 | |
| South Africa | 109 | 155 | 190 | |
Source: FISHDAB
Imports
| 1988-90 Average | 1991 | 1992 | ||
| Million $ | ||||
| World total | 36899 | 43546 | 45102 | |
| Developing countries | 4993 | 6188 | 6496 | |
| Latin America | 488 | 526 | 607 | |
| Brazil | 154 | 181 | 190 | |
| Africa | 684 | 689 | 706 | |
| Côte d'Ivoire | 128 | 115 | 117 | |
| Nigeria | 144 | 191 | ||
| Near East | 266 | 281 | 298 | |
| Far East | 3468 | 4 604 | 4 783 | |
| China | 300 | 438 | ... | |
| Korea, Republic of | 332 | 569 | 499 | |
| Hong Kong | 1 044 | 1 237 | 1 400 | |
| Singapore | 366 | 461 | 546 | |
| Thailand | 686 | 1 050 | 942 | |
| Developed countries | 31 906 | 37358 | 38606 | |
| North America | 6 197 | 6 673 | 6 718 | |
| Canada | 624 | 675 | 687 | |
| United States | 5573 | 5998 | 6 031 | |
| Europe | 14 502 | 17966 | 18 375 | |
| EC | 12 833 | 16 324 | 16 705 | |
| Denmark | 944 | 1 148 | 1 198 | |
| France | 2416 | 2926 | 2 980 | |
| Germany | 1 603 | 2 115 | 2 198 | |
| Italy | 2 114 | 2 690 | 2640 | |
| Netherlands | 698 | 977 | 1 058 | |
| Spain | 1 968 | 2 748 | 2897 | |
| United Kingdom | 1 716 | 1 912 | 1 891 | |
| Eastern Europe | 276 | 128 | ... | |
| Former USSR | 179 | 46 | 35 | |
| Oceania | 376 | 397 | 414 | |
| Australia | 341 | 360 | 379 | |
| Other developed countries | 10 652 | 12 276 | 13 064 | |
| Japan | 10 484 | 12 044 | 12 832 | |
| South Africa | 101 | 141 | 117 | |
Source: FISHDAB
Fish prices of international significance
Fish-meal and soybean meal prices