![]()
![]()
![]()
The survey was carried out aboard the R/V LAGOAPESCA, a freezer-trawler belonging to the Vigo shipping company Lagoa Santodomingo. Fishing operations were conducted from the stern ramp.
The vessel's main characteristics were :
| Name | R/V LAGOAPESCA |
| Call sign | EHMV |
| Colour | Blue and White |
| Total length | 39.4 m |
| Length between perpendiculars | 33.0 m |
| Width | 9.52 m |
| Gross tonnage | 475 GT |
| Hull | Steel |
It was built in 1989 by the Vigo shipbuilders astilleros Santodomingo and this was its second trip.
It is fitted with a DEUTZ MWM six cylinder engine, capable of an effective power of 1260 CV at 760 rpm. It is driven by an EIMAR 1891-B, controllable pitch propeller.
A 200 CV CATERPILLAR auxiliary engine provides electrical current.
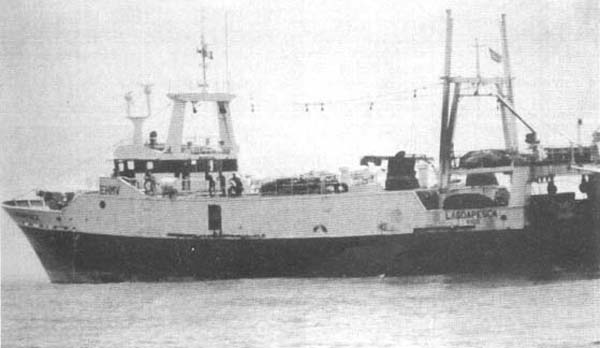
R/V LAGOAESCA in the Gulf of Guinea
The vessel is also fitted with the following navigation back-up equipment:
a 100 mile range KODEN MD-3711 B radar;
a 100 mile range KODEN MD-3721 A radar;
two KODEN CVS-8812 16-colour ultrasound echosounders, capable of detecting depths of between 0 and 2 400 fathoms;
MAGNAVOX MX -4102 satelite navigation equipment;
a SPERRY SR-120 gyroscope;
a SPERRY SR 100/130 automatic pilot;
a SAILOR R-1119 HF radio-telephone receiver;
an S.P. RADIO A/S SAILOR R-501 radio receiver for emergency frequency listening;
an S.P. RADIO A/S SAILOR T-2031 MF radio-telephone transmitter;
an S.P. RADIO A/S SAILOR T-1135 HF radio-telephone transmitter;
an S.P RADIO A/S SAILOR R-2022 MF radio-telephone receiver;
an S.P. RADIO A/S SAILOR RT-2048 VHF radio-telephone.
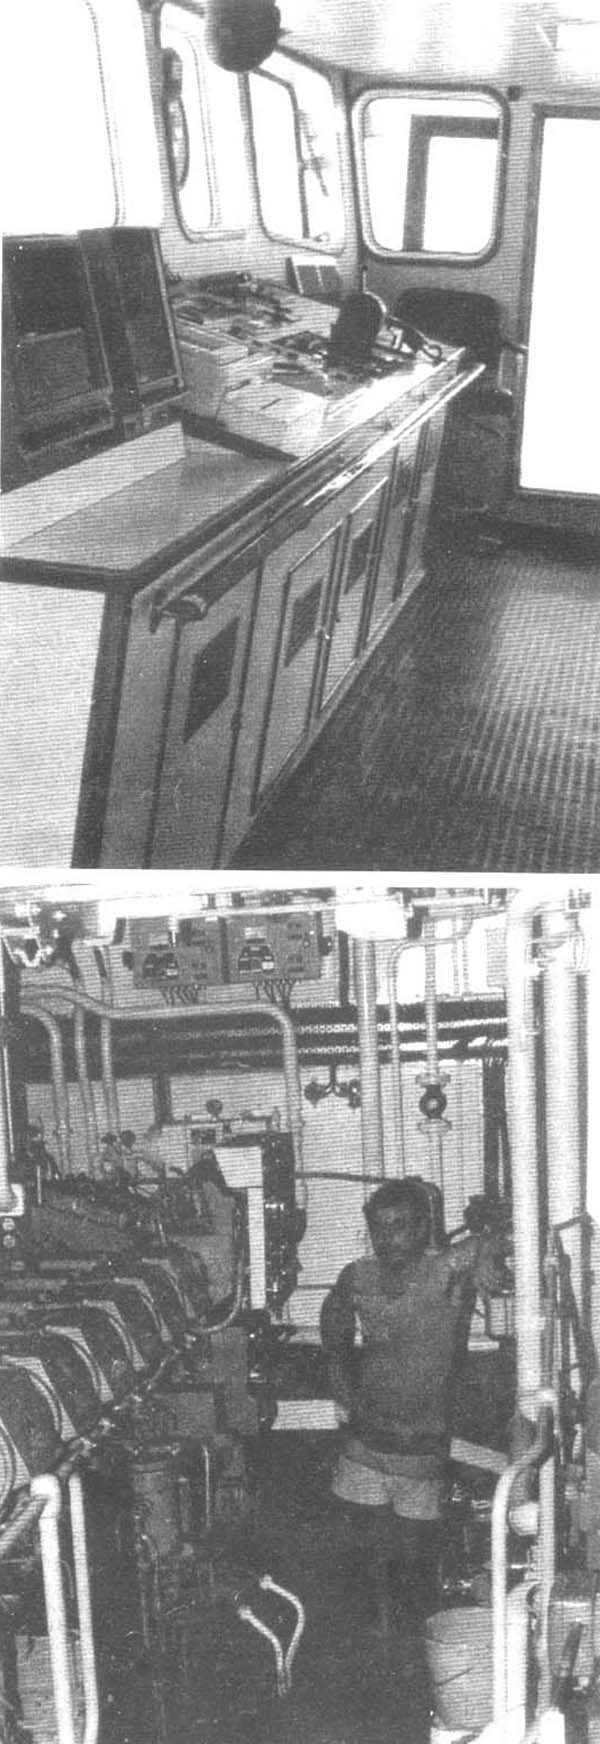
View of bridge (above) and engine room (below)
Two different types of gear for stony bottoms were used during the survey. These will be referred to as Gear 1 and 2. Data sheets and plans of these gears were provided by the shipping company (see below).
The upper parts of both types of gear were made of polyethylene yarn. The codend (of nylon) had a 45 mm mesh. A single codend was used with both types of gear).
The otter boards, measuring 2.92 × 1.65 m, manufactured under French licence, were made of iron and weighed 800 kg each.
For fishing operations, the vessel was fitted with:
an IBERCISA trawl winch with a 225 CV, INDAR N-400-M-B engine;
four winch barrels (two main, and two auxiliary). The main barrels were each fitted with 1 800 m of 22 mm and 50 m of 24 mm steel cable;
mobile stern snatch blocks.
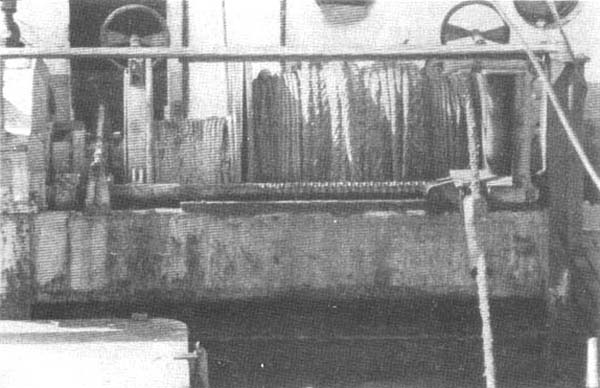
Close-up of the trawl winch. Barrels
GEAR 1. T-shaped bottom gear (for stony bottoms) 31.30/17.70/80.85.
See Fig. 7 for the drawing of this gear.
| Data sheet | |
|---|---|
| Vertical opening | 4.79 m |
| Horizontal opening | 17.16 m |
| Floatability | 294 kg |
| Total area | 80.69 m2 |
| Net resistance | 5.364 kg |
The headline rope was fitted with 15 plastic floats.
Gear 1 was fitted with a groundrope to which were attached 25 bobbins to prevent net damage and entangling on the bottom.
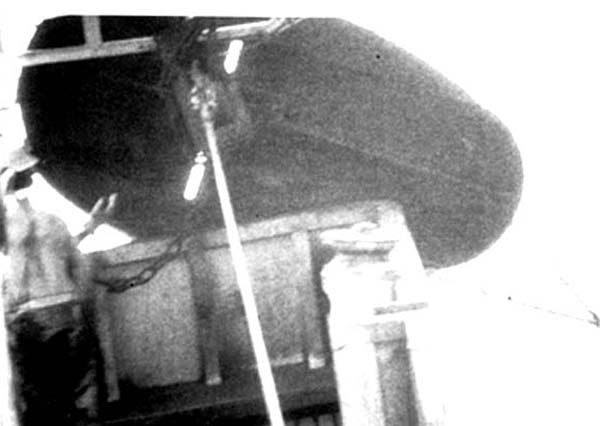
View of one of the otter boards
Gear and groundrope
Fig. 7. T-shaped bottom gear 31.30/17.70/80.85 for use on stony bottoms (Gear 1)
GEAR 2. T-shaped bottom gear 33 × 42.
See Figure 8 for the drawing of this gear.
| Data Sheet | |
|---|---|
| Vertical opening | 2.8 m |
| Horizontal opening | 18.5 m |
| Area | 85m2 |
| Sweep area | 38 m2 |
| Volume of water filtered | 69 m3/sec |
| Net resistance | 2 900 kg |
This gear was used without a groundrope and only in Côte d'Ivoire waters, where the rugged terrain caused it to break continuously.
The only difference between this and the previous gear is that this one had wings.
Fig.8. T-shaped bottom gear 33 × 42 (Gear 2)
The area was surveyed between 20 and 700 m depth.
Given the size of the survey area and the fact that the vessel was available for a total of 30 days (at sea), it was decided to carry out systematic sampling by transects.
The transects were distributed perpendicular to the coastline on the basis of the size of the continental shelf area in each of the sectors defined.
Fig. 9 is the map of the survey area showing the position of the transects.
After reviewing the literature on and the charts of the area, it was decided to divide the area into two sectors:
SECTOR 1
Sector 1 includes the Sierra Leonean and Liberian continental shelves, which previous surveys recommended covering between 0 and 700 m depth.
Initially there were to be fifteen transects in this area, each separated by a distance of 33 miles. However, the survey preparation meeting in Abidjan was of the opinion that the size of the shelf in western Sierra Leone warranted having more transects (two more, if possible). In fact, time only allowed for one extra transect to be covered, and this meant reducing the distance between transects to 22 miles, and therefore, for statistical purposes, Western Sierra Leone had to be treated as a separate sector.
Five depth strata were defined in Sector 1 as follows:
| Stratum | Depth range |
|---|---|
| A | 0 – 50 m |
| B | 50 – 100 m |
| C | 100 – 200 m |
| D | 200 – 400 m |
| E | 400 – 700 m |
One tow was to be made in each depth stratum and it was estimated that between 75 and 85 hauls would be made in the sector as a whole.
SECTOR 2
This sector comprised the Côte d'Ivoire and Ghana continental shelves. The survey area is smaller here as rocky bottoms make trawling difficult below 120 m in Côte d'Ivoire and 75 m in Ghana.
Fig. 9. Map of survey area showing position of transects.
It was initially decided to complete 10 transects (5 per country), each 55 miles apart. An extra transect was covered in Ghana, where the shelf east of Cape Three Points is much wider than in the rest of the sector. This transect was therefore treated separately for statistical purposes.
The distance between transects in Côte d'Ivoire was therefore 55 nm, while in Ghana it was only only 50 nm.
In order to conciliate original survey objectives (coverage of little-known, deep shelf areas below 100 m, and, in particular, assessment of deep-water crustacean resources) with the coastal states' considerations (abundance estimates of demersal stocks, traditionally exploited by these countries at depths of between 0 and 100 m), the following stratification was adopted:
| Statum | Depth range |
|---|---|
| A | 20–50 m |
| B | 50–100 m |
| C | >100 m |
Strata A and B were each covered twice. Uneven bottoms made sampling difficult in stratum C, however, and it was decided to make from one to three hauls, depending on how difficult it was to find suitable trawling areas with the aid of an echosounder.
Tables 2, 3 and 4 give the areas per stratum and sector, the number of transects and the distances between them.
| Sector | Area | Area(km2) | N° transects | Dist.(n.m.) |
|---|---|---|---|---|
| SECTOR 1 | Western S. Leone | 14 405 | 4 | 22 |
| Eastern S. Leone | 5 777 | 3 | 33 | |
| Liberia | 22 897 | 9 | 33 | |
| SECTOR 2 | Côte d'Ivoire | 10 524 | 5 | 55 |
| Ghana | 18 726 | 6 | 50 | |
| TOTAL ALL COUNTRIES | 46 113 | 27 | ||
| 20–50 | 50–100 | 100–200 | 200–400 | 400–700 | TOTAL | |
|---|---|---|---|---|---|---|
| WESTERN S. LEONE | 8 647 | 3 979 | 668 | 665 | 446 | 14 405 |
| EASTERN S. LEONE | 2 227 | 1 631 | 559 | 552 | 808 | 5 777 |
| LIBERIA | 3 858 | 10 381 | 2 503 | 2 112 | 4 043 | 22 897 |
| 20–50 | 50–100 | >100 | Total | |
|---|---|---|---|---|
| CÔTE D'IVOIRE | 3 023 | 5 428 | 2 073 | 10 524 |
| GHANA | 8 461 | 8 812 | 1 453 | 18 726 |
Knowledge of the topography and nature of the sea floor is extremely important for fishery resource surveys and commercial trawl fisheries. This is why special attention was paid to the preparation of the sea floor charts (see maps 5, 6, 7 and 8). These charts contain all relevant data, including those collected by the “"GUINEA 90"” survey.
The navigation chart, survey plan and other maps were based on charts prepared by the Spanish Navy's Hydrographic Institute:
Chart № 983, from the Tombali river to Cape Saint Ann (from Guinea Bissau to western Sierra Leone);
Chart № 984, from Cape Saint Ann to Cape Palmas (eastern Sierra Leone and Liberia)
Chart № 985, from Cape Palmas to Cape Three Points (Côte d'Ivoire and western Ghana);
Chart № 986, from Cape Three Points to Cape Formoso (from Ghana to Nigeria).
Bathymetric data for depths below 100-200 m are very scant for all the countries surveyed except côte d'Ivoire. It was therefore necessary, on the basis of soundings shown on the Spanish pilot charts, to trace 50, 100, 400, 700 m and 20 and 50 m depth contour lines in sectors 1 and 2 respectively (see maps 1, 2, 3 and 4). The isobathic lines for depths below 100 m in Sierra Leone waters were taken from ORSTOM charts (Martin, 1973).
Areas per depth stratum in both sectors were calculated on the basis of these isobaths (Tables 2, 3 and 4).
The findings of studies on the nature of the sea floors, conducted in the different countries, are inconsistent.
Very detailed bathymetric and shelf floor data are available for Côte d'Ivoire. The Côte d'Ivoire sea floor chart was based on Martin (1973) (Map 7).
The Liberia sea floor chart was based on Rancurel (1968) and Villegas and García (1983), with Spanish pilot charts and data collected during this survey used to complete information on bottom types in some areas.
Data contained in the Sierra Leone and Ghana sea floor charts, based on the Guinean Trawling Survey (Williams, 1968) maps, are less detailed. Data based on Rijavec (1980) and the Spanish pilot charts were used in the preparation of the Ghana chart.
The Sierra Leone bathymetric chart also includes Coutin and Payne's (1988) data on the bathymetry of the northern area, where submarine canyons occur.
When the topography of the bottom allowed, the duration of each tow, which followed the isobath in a direction parallel to the coast, was 30 minutes. After each tow, the characteristics of the haul were recorded on a special form as follows:
Number of operation
Date (day, month)
Type of gear
Validity of haul (0 = null and void, 1 = valid)
Time, latitude, longitude and depth from the moment of coming to a halt and starting fishing; and again as soon as lifting of the gear began
Direction (degrees)
Vessel towing speed (knots)
Warp paid out (m)
Remarks
Hauls of less than 20 minutes (due to becoming hooked-up on the sea floor currents, etc., or to badly operating gear) were declared null. Some hauls in areas of very uneven topography had to be invalidated because very steep rises or drops in the sea floor placed the vessel out of the depth range under survey.
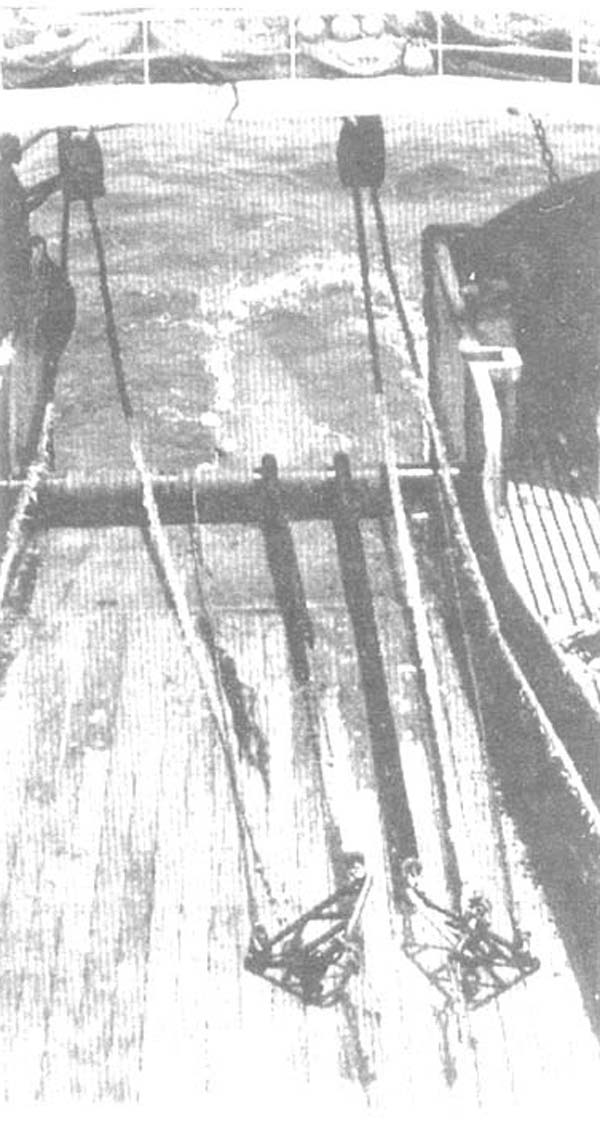
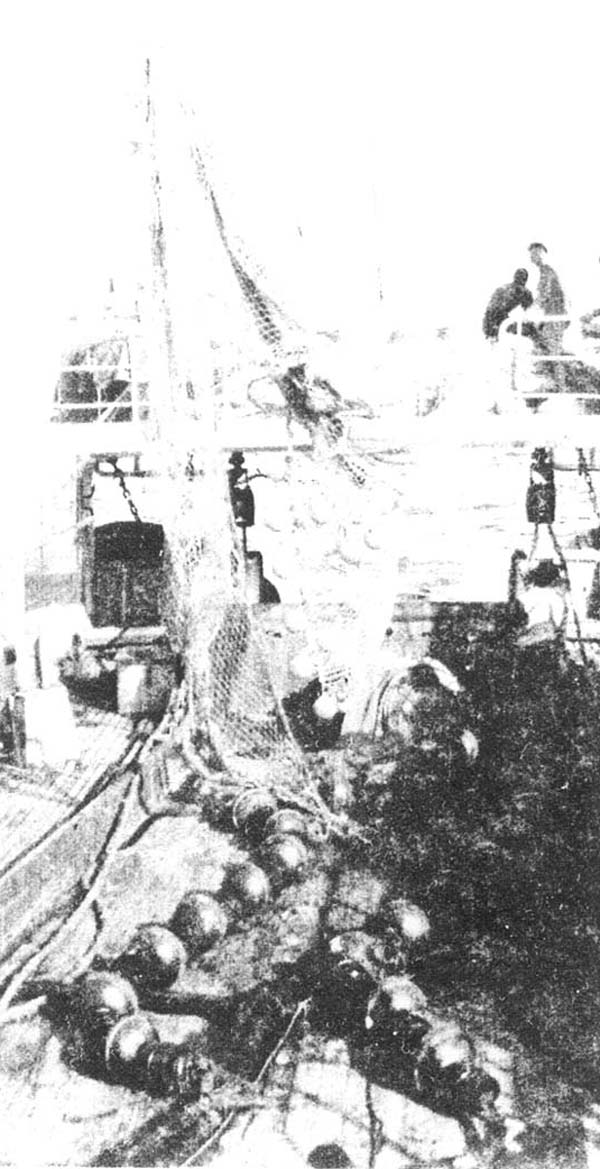
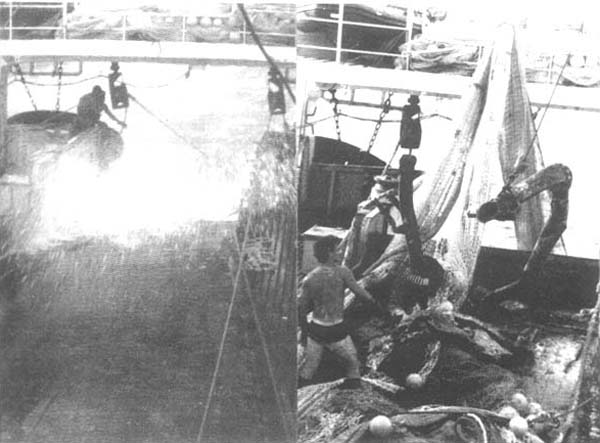
1. The danleno comes aboard.
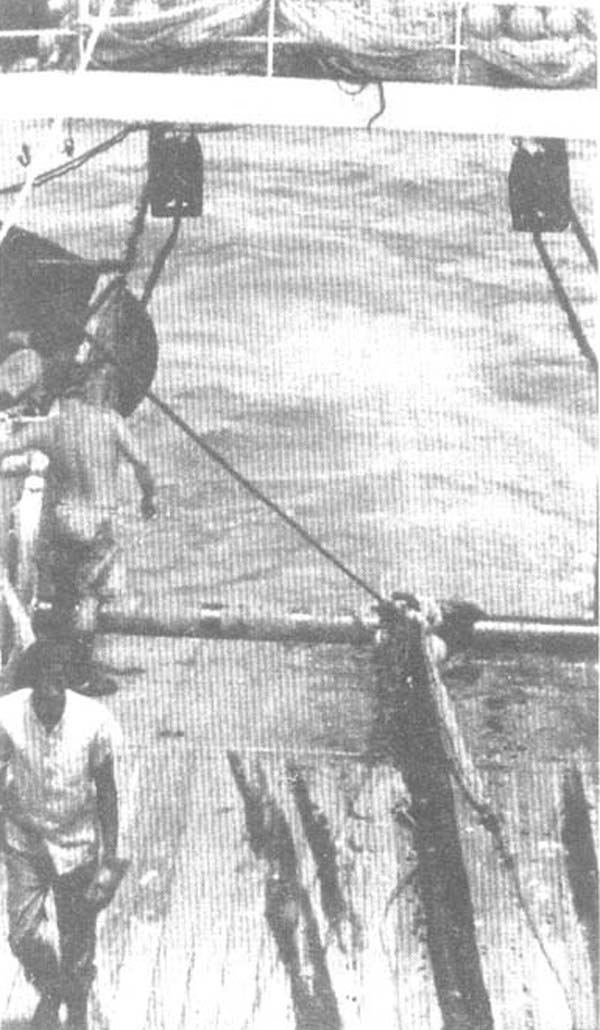
2. The net being hauled in.
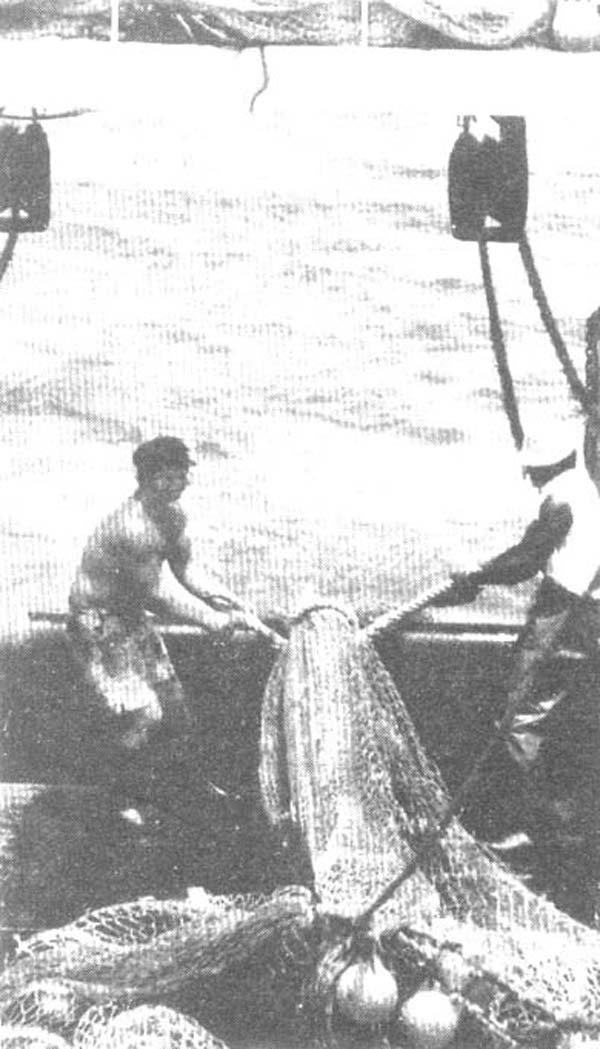
3. Attaching the lifting atrop
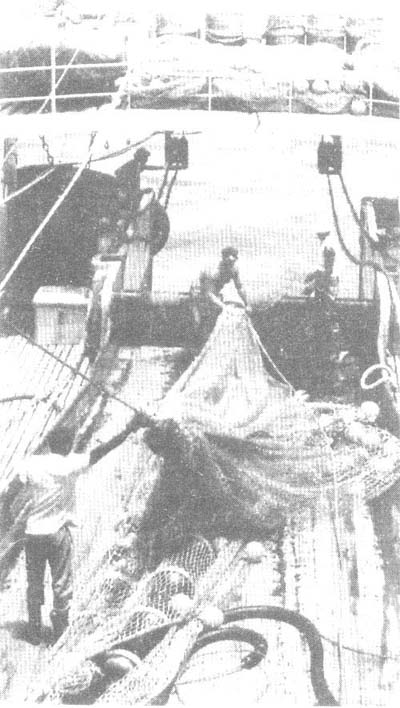
4. Lifting the net
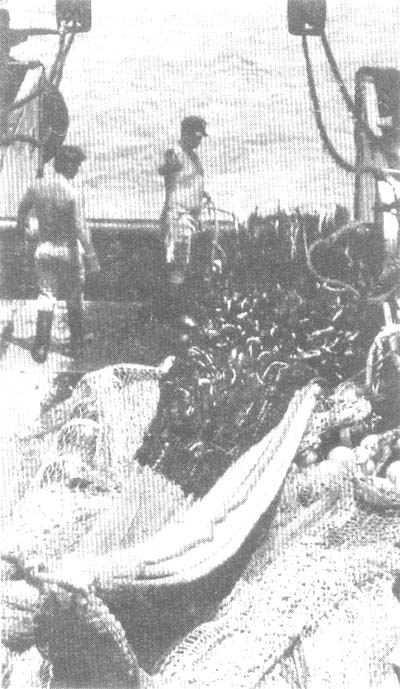
5. The codend being lifted aboard.
6. Emptying the codent.
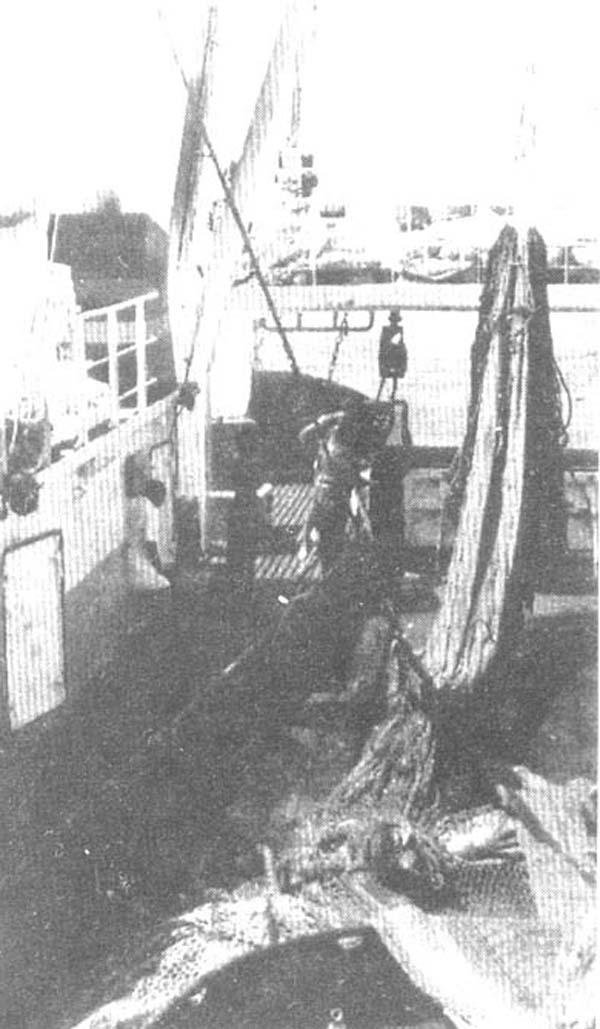
Various stages of “hauling” operations
The target species were chosen on the basis of their commercial importance to the local industrial and artisanal fisheries of the four coastal states, as well as to the Spanish freezer vessel fleet operating in the vicinity.
The list of species drawn up by the scientific team during the preparatory meeting in Abidjan included the following species of importance to local fisheries:
Pseudolithus typus
Pseudotolithus senegalensis
Galeoides decadactylus
Pomadasys jubelini
Brachydeuterus auritus
Cynoglossus canariensis
Penaeus notialis
Pagellus bellottii
Dentex angolensis
Dentex congoensis
Sparus caeruloestictus
Epinephelus aeneus
Balistes capriscus
It also included species likely to be of interest to the Spanish deep-sea fishing fleet operating in the vicinity:
Gerion maritae
Parapenaeus longirostris
Aristeus varidens
Merluccius polli
Sepia sp.
While the above species were considered by the group of scientists meeting in Abidjan as being of top priority, another group of secondary importance, for which the scientists wished to obtain a number of specific biological parameters, was selected. It included:
Scomber japonicus
Sardinella sp.
Chloroscombrus chrysurus
Selene dorsalis
Sphyraena sp.
Decapturus punctatus
Ilisha africana
During the survey, samples of other, less important species were taken:
Brotula barbata
Zenopsis conchifer
Arioma bondi
Dentex canariensis
Dentex filosus
Engraulis encrasicholus
Parapeneopsis atlantica
Mustelus mustelus
Taxonomic identification of the species caught was based on FAO's Species Identification Sheets (Fischer, Bianchi and Scott, 1981), FAO's identification cards (Bellemans et al., 1988), the FAO publication, “Fishes of the North-Eastern Atlantic and the Mediterranean” (Whitehead et al., 1986), the guides published by ORSTOM for fish (Blache, Cadenat, 1970) and crustaceans (Crosnier & Forest, 1973) and the Lloris & Rucabado (1989) key.
The names of the species were updated and each species was assigned the most recent name by which it is known.
The entire catch of every haul was first put into the fish container. The total number of baskets comprising the catch was counted on the conveyor belt. If the catch was small, all the fish were sampled. If it was large, a representative sample was taken (two to four baskets, depending on abundance).
The sample, including benthonic (echinoderms, ascidians, molluscs, algae, etc.) and pelagic invertebrates (Medusae, pyrosomids, etc.) was separated by species, counted and weighed.
The number and weight of each species in the total catch was obtained by weighting (multiplying by a factor corresponding to the ratio of sampled baskets to (:) discarded baskets).
Weights were expressed in grammes so that even species caught in small quantities or occasionally could also be represented.
Large-size species, such as sharks, Epinephelus, Brotula, Zenopsis, etc., or species of particular importance (M. polli, P. longirostris, Sepia officinalis, D. canariensis) were separated from the samples and the total catch.
Size sampling was done on specimens of very important species. When samples were very large, size sampling was done on sub-samples.
In accordance with regulations in force in the CECAF region, the length dimension measured was fork length or total length for fish, and cephalothoracic length for decapods.
The measurement units were: centimetres or half centimetres for fish, and millimetres for crustaceans.
Fish were measured with ictiometers graduated in millimetres and crustaceans with calipers.
Size distributions were obtained by stratum for each area, expressed in percentages and represented on histograms.
Size distributions by sex (male, female and indeterminate) were made for:
Sparids (Dentex, P. bellottii and Pagrus caeruloestictus)
Cephalopods (Sepia officinalis and S. bertheloti)
Decapods (P. longirostris).
Biological sampling was done on some species of commercial importance, including:
Sparids
Crustaceans (P. longirostris and P. atlantica)
M. polli
E. aeneus
B. barbata
Z. conchifer
The biological parameters obtained were:
Length in millimetres
Weight in grammes, using steelyards in a range of 100, 60 or 30 g for small specimens (accurate to nearest 2 g), or balances for larger specimens (accurate to nearest 20 g)
Sex
Sexual maturity
The 6-point scale below (an abbreviated version of that given in CECAF/RE/88/10) was used to determine the sexual maturity of the different fish species.
Sexual maturity of crustaceans was determined using a 3-point de visu scale (I-virgin/Resting, II-Maturing, III-Spawning (Sobrino and Cervantes, 1990).
SCALE TO DETERMINE THE STAGES OF MATURITY OF FISH GONADS USING VISUAL CHARACTERISTICS (MACROSCOPIC)
STAGE I - Juvenile. Gonads filiform and transparent. Sex cannot be determined from macroscopic characteristics.
FEMALES
Stage II. Ovaries small, elastic, transparent or translucid. Membrane of ovary thin. Eggs not visible to the naked eye.
Stage III. Ovaries large, elastic, opaque; white, pinkish or yellowish in colour. Eggs small, opaque; visible to the naked eye.
Stage IV. Ovaries, yellow-orange in colour, fill ventral cavity. Blood vessels clearly visible. Eggs small, transparent, visible through the walls.
Stage V. Belly of female swollen; roe emerges easily from genital orifice under light pressure. Ovaries large; their sheath taut. In total spawners, ovaries full of ripe, transparent eggs (and this stage followed by stage VI). In partial spawners, eggs in ovary at different stages of maturity (some starting intense trophoplasmatic growth, others almost at the end of this stage). In the latter case, ovaries are classified in stage VI-III or VI-IV.
Stage VI-III (VI-IV). Ovaries soft, reddish in colour. Vitelline, opaque eggs (of different sizes) visible through the membrane. Some still transparent, however.
MALES
Stage II. Testes lanceolate or string-like, reddish or brown in colour. Do not secrete white liquid.
Stage III. Testes larger. Reddish white or whitish brown in colour, elastic, opaque. Do not secrete white liquid.
Stage IV. Testes white, elastic, fill whole of ventral cavity. Flow of milt visible in transversal section.
Stage V. Testes dull white in colour, soft. Milt is secreted under slight pressure. Excretory canal clearly visible.
Stage VI. In partial spawners, after secretion of part of the milt, testes reddish white or whitish brown and shrink during spawning. Secretion of milt (stages VI-III or VI-IV) visible in transversal section. Once spawning completed, stage VI is the same as for total spawners.
The weight of the gonad and other data on the qualitative composition of stomach contents were recorded for E. aeneus.
SIZE-WEIGHT RATIO
This ratio is derived from an exponential equation of the expression:
W = a Lb
where: a and b are constants
L is length in millimetres
W is weight in grammes
Size-weight ratios were obtained for the following species:
D. angolensis
D. congoensis
D. canariensis
P. caeruloestictus
P. bellottii
P. longirostris
S. bertelothi
S. officinalis
These data will be submitted to the Working Group on Demersal Species in the Gulf of Guinea in September 1990.
Special tests were done on some species to meet particular interests of survey participants. These data will also be submitted in September.
Thus, the ratio of fork length to total length was obtained for:
Selene dorsalis
chloroscombrus chrysurus
Ilisha africana
Otoliths were also removed from E. aeneus and B. barbata and conserved in the dry state for subsequent study at the CRO in Abidjan.
CATCHES
Total catches are presented by country and depth range. The percentages of the most abundant species and the different ecological communities (considered globally) in which they are found are also given. In view of the multispecific nature of demersal fisheries in the waters of the Gulf of Guinea (Poinsard and Garcia, 1984), it was considered useful to process the data by community.
Catch classification by communities was based on Longhurst (1969). The following communities were differentiated: lutjanids, sciaenids and sparids (no distinction being made between coastal and deepwater and deep shelf and slope communities). Chondricthyes, cephalopods, crustaceans, and pelagic species (when these catches were significant) were grouped separately.
Maps 1, 2, 3 and 4, which illustrate the distribution of the dominant communities (based on species abundance) in each tow, also show the overall geographical and bathymetric distribution pattern of the main assemblages.
The percentage incidence of each species in a stratum catch was calculated in order to assess their importance in the stratum. Only those species with more than 1 percent incidence in the stratum catch are listed. Other species were grouped under “Others”.
YIELDS
Yields in grammes per 30-min tow were calculated for each of the species caught in each station. Mean yields per stratum and area were calculated on the basis of the yield of each valid haul made within that stratum and area. The formulae used to calculate mean yields per stratum and standard deviation per species were:
Where:  = mean yield in the stratum
Yi = yield with haul i
n = number of hauls in the stratum…
o = standard deviation of the mean in the stratum
The formulae used to calculate mean yields and standard deviations in each sector were:
Where: = mean yield in the sector
Yi = " " " " stratum
Si = area of stratum i
S = total area of sector
o = standard deviation of the mean
Vi = variance in stratum i
Data was processed using an OLIVETTI M-28 micro-computer and a COMPAQ laptop (taken on board during the trip) and their peripherals.
Haul characteristics and catch data were entered during the trip, but could not be processed because the printer failed and could not be repaired on board. Some size distribution data and size-weight ratios were entered during the trip.
Specially developed DBASE III PLUS applications were used to calculate yields.
The LOTUS spreadsheet and WORDSTAR word-processor were also used.
Frozen specimens of all the species caught during the trip (fish, crustaceans and cephalopods) were kept. They will be added to the marine fauna collections of the Spanish Oceanographic Institute's Fuengirola and Canary Islands' Coastal Centres.
Specimens of all invertebrate species and algae were also kept. These will be studied and classified at a later date.
Species caught during the trip (fish, crustaceans and various invertebrates) were photographed in the fresh state.
Small specimens (up to about 20 cm) were photographed under halogen lighting with a NIKON F2 camera, fitted with a 55 mm f/2.8 MICRO-NIKKOR lens. A NIKON FG-20 camera, fitted with a OSAWA 70/220 macro-zoom lens, and natural light, was used for large specimens.
![]()
![]()
![]()