![]()
![]()
![]()
Two different types of gear (characteristics already described in the section on equipment and methods), were used during the trip.
Both gears were used with a single codend and both nets had horizontal openings of similar size. However, the vertical openings differed; that of Gear 1 was nearly double that of Gear 2 (4.79 m and 2.8 m respectively), and Gear 1 used a groundrope, while this was not possible with Gear 2, which had wings.
It is assumed that these differences greatly influence catchability, a factor which should be taken into account when comparing the estimates obtained with each type of gear.
Gear 1 was used throughout the survey, except in Côte d'Ivoire, where Gear 2 was used in the early stages of the trip and gave larger catches. However, the net repeatedly entangled and broke, and it was decided to switch to the other which offered better net protection thanks to the bobbins fitted to the groundrope.
COMPARATIVE TRAWLS
In an attempt to compare the yields obtained with each type of gear, parallel tows in the same geographical location and depth were carried out toward the end of the trip with an extra day at the disposal of the survey. Transect 25 was chosen for this experiment since the bottoms there presented no trawling difficulties.
Six tows were made with Gear 1 (150–155) and five with Gear 2 (151bis–155bis), care being taken to maintain the same depth and position. The data from five tows with Gear 2 are given separately. Catch comparisons (Table 6) show that (as assumed), Gear 2 was more effective than Gear 1 in all strata (a ratio of 1.34:4.33).
This would suggest that the much higher catches and yields obtained in Côte d'Ivoire (see Tables 28-30 and Annex II) were no doubt due to the use of Gear 2.
| Stratum | Gear 1 | Gear 2 | Coefficient |
|---|---|---|---|
| 20–50 m | 22 | 30 | 1.36 |
| 50–100 m | 60 | 81 | 1.34 |
| 65 | 138 | 2.13 | |
| >100 m | 398 | 1722 | 4.33 |
| 742 | 2042 | 2.75 | |
| TOTAL | 1287 | 4013 | 3.12 |
MESH
The mesh in the various parts of both types of gear (upper and lower panels and codend in Gear 1, and upper and lower panels, legs and codend in Gear 2) were measured several times during the trip. An ICES gauge was used and the mesh opening was always measured longitudinally.
The mean values obtained are given in Table 7 below.
| Upper panel | Lower panel | Wing | Codend | |
|---|---|---|---|---|
| Gear 1 | 126.65 | 127.76 | 46.05 | |
| Gear 2 | 77.56 | 75.17 | 109.47 | 44.82 |
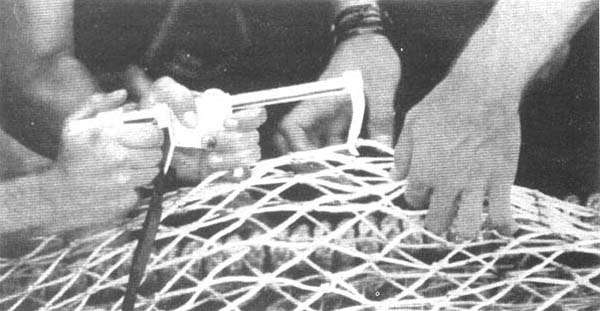
Measuring the mesh
As already explained in the section on equipment and methods, the survey preparatory meeting decided to cover two more transects than originally planned, one in western Sierra Leone and the other on the Ghana shelf (27 in all, instead of 25).
A total of 168 tows were made (see Annex 1 for their location and characteristics). Maps 1, 2, 3 and 4 show where fishing operations were carried out. Arrows indicate successful hauls, the route and direction of the tows; unsuccessful hauls are shown with dots.
| 20–50 | 50–100 | 100–200 | 200–400 | 400–700 | Total | % | |
|---|---|---|---|---|---|---|---|
| Western | 4 | 4 | 3 | 3 | 2 | 16 | 64 |
| Sierra Leone | 5n | 2n | 2n | 9n | 36 | ||
| Eastern | 3 | 3 | 3 | 2 | 2 | 13 | 68 |
| Sierra Leone | 1n | 3n | 2n | 6n | 32 | ||
| Liberia | 5 | 8 | 9 | 8 | 7 | 37 | 73 |
| 4n | 2n | 2n | 2n | 4n | 14n | 27 | |
| Total | 12 | 15 | 15 | 13 | 11 | 66 | 69 |
| Sector 1 | 4n | 2n | 8n | 7n | 9n | 30n | 31 |
| 20–50 | 50–100 | >100 | Total | % | |
|---|---|---|---|---|---|
| Côte d'Ivoire | 10 | 9 | 6 | 25 | 81 |
| 1n | 5n | 6n | 19 | ||
| Ghana | 9 | 11 | 9 | 29 | 70 |
| 5n | 4n | 3n | 12n | 30 | |
| Total | 19 | 20 | 15 | 54 | 75 |
| Sector 2 | 4n | 5n | 8n | 18n | 25 |
Tables 8 and 9 show the number of successful and unsuccessful hauls per depth stratum in each country and sector. It will be noted that the percentage of successful hauls was 31% (very high) in Sector 1 (Sierra Leone and Liberia) and only 25% in Sector2 (Côte d'Ivoire and Ghana).
Detailed data on the topography and nature of the continental shelf and slope bottoms of each of the countries surveyed have already been presented in the section dealing with the survey area.
These data are summarized in Maps 5, 6, 7 and 8, which, as mentioned in the section on cartography and topography, were based on a wide range of information obtained from various sources.
Major aspects of bottom trawlability are discussed below on a countrywise basis.
SIERRA LEONE
While there would not appear to be any problems for trawling on the Sierra Leone continental shelf (as far as its offshore edge) despite the fact that hard bottoms predominate in the west, the high number of unsuccessful hauls in the deep part of the shelf and on the slope in both east and west (36% and 32% respectively) and data provided by previous surveys (Williams, 1968) seem to indicate that trawling is impossible beyond 200 m, and in some cases 100 m depth (see Map 1).
The closeness of the isobaths in the area of transects 1 to 4 indicates a very steep slope. This situation is aggravated by very rugged bottoms in western Sierra Leone. Furthermore, drops of more than 200 fathoms (1 fath = 1.8288 m) are detectable with the echosounder, confirming the existence of deep submarine canyons and valleys, already cited by Sheridan et al. (1969) and Konate et al. (1989).
At the approach of the borders of Guinea and Liberia, the isobaths separate, the gradient of the slope becomes more gentle and trawling easier between transects 0 and 6.
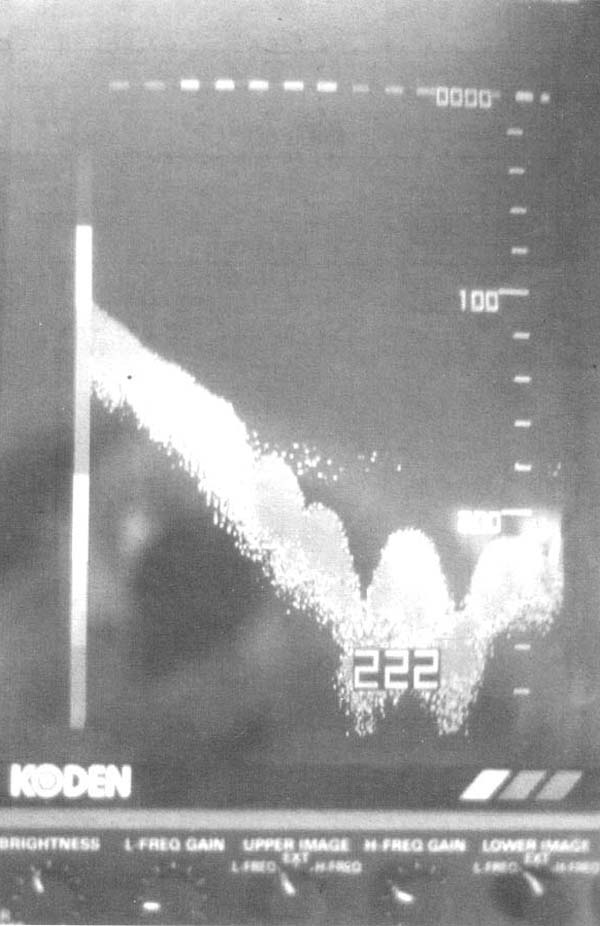
Echogram: Northern Sierra Leone
LIBERIA
The presence of isolated rocks along the country's coastal strip from Cape Mesurado, the border with Côte d'Ivoire, makes trawling very difficult. As a result, it was either impossible to trawl in some transects in stratum A or hauls were null because the net became repeatedly entangled.
There were fewer problems in the more gently sloping deep zone.
Problems were mainly due to the presence of a rocky coral belt running along the shelf edge, and to strong currents which made trawling impossible in transects 14 and 15, off Point Seste and Cape Palmas. The haul made in Monrovia Bay was declared null as the net became fast in mud. (Bobbins arenot very effective on muddy bottoms because of their weight.)
The remainder of the shelf (between 50 and 700 m depth), has soft bottoms and is trawlable.
CÔTE D'IVOIRE
The Côte d'Ivoire shelf appears to be suitable for trawling (as far as its edge). The small percentage of unsuccessful hauls, 19% (Table 9), is an indication of this. It must nevertheless be noted that it was not possible to carry out all the scheduled tows in the deep stratum (below 100 m depth), as hours of searching with the echosounder failed to detect suitable, even-bottomed trawling grounds.
The only untrawlable parts of the shelf are the areas where rocky banks occur (Map 7).
GHANA
Most of the problems were encountered in Cape Saint Paul, where besides being struck by a violent storm, the gear kept sticking in mud and rocks. This implied that the strip of hard bottom off the coast of Togo must extend as far as eastern Ghana, covered by a thin layer of sediment.
Except for the net entangling on the coral reef in transect 24 and the presence of a large mud bar off Cape Three Points, the rest of the Ghanaian shelf posed no problems.
A total of 294 species were collected during the “Guinea 90” survey. Of these 237 were fish, 45 were crustaceans and 12 were molluscs (cephalopods). Annex II lists the species grouped into families.
Table 10 gives the number of species in each of the three groups encountered in the areas surveyed. The largest number were obtained in Liberian and Ghanaian waters, partly because the greatest number of hauls were made there.
| Species | Fish | Crustaceans | Molluscs | Total |
|---|---|---|---|---|
| Western Sierra Leone | 120 | 16 | 10 | 146 |
| Estern Sierra Leone | 114 | 20 | 10 | 144 |
| Liberia | 151 | 33 | 11 | 195 |
| Côte d'Ivoire | 135 | 20 | 11 | 166 |
| Ghana | 153 | 22 | 9 | 184 |
| Total | 237 | 45 | 12 | 294 |
FISH
A total of 237 fish species, belonging to 108 different families, were caught. Of these, 29 (belonging to 12 families) were Chondricthyes, and the remainder, i. e., 208 species (belonging to 96 families) were Teleostei.
The greatest diversity by family was shown by the Sparidae and Scorpenidae, each represented by nine species, the Carangidae, Macrouridae and Serranidae, with eight each and the Sciaenidae and Soleidae, with seven each.
Of the Chondricthyes, the Squalidae family, with five species, provided the widest diversity.
CRUSTACEANS
Fortyfive crustacean species, belonging to 19 different families, were caught during the survey. The widest specific diversity was encountered within the Pandalidae and Penaeidae families (with nine and seven species respectively).
Eastern Sierra Leone was the geographical area where diversity was widest.
MOLLUSCS
Only cephalopods were taken into account in this phylum. A number of gasteropods (especially Opisthobranchia and Lamellibranchia) were caught, even though the gear was not really suitable for catching this type of benthic fauna. Specimens of all the species were nevertheless kept.
Twelve species of cephalopods, belonging to five families, were caught. The greatest diversity was shown by the Sepiidae family (five species altogether, four of the genus Sepia).
Eastern Sierra Leone again gave the largest number of species by country.
OTHER INVERTEBRATES
Due to the short deadline for the publication of this report, it was not possible to process fully all the data collected during the trip. Data on the benthic fauna by-catch will undoubtedly provide valuable direct information on the ecosystem in general, as well as indirect information on the type of substrate with which demersal communities are associated. Similar studies have already been carried out by other authors (Rijavec, 1980) and are useful for defining some of the Gulf of Guinea benthic communities.
The echinoderms (mainly holothuroids and echinoids) are generally one of the most abundant groups on soft bottoms, while calcareous Gorgoniacea and Bryozoa, associated with the lutjanid community, are found on rocky bottoms. The sciaenid community appeared in many hauls to be associated with very characteristic bottoms formed by red coralline algae.
Other groups worth mentioning are Porifera, alcyonoids, pennatulids and nudibranchs.
This section reviews the catches and yields obtained in the different depth strata (defined in the section on equipment and methods) in each sector, with special attention being paid to species of commercial interest.
Tables 11–31 and Figures 10–30 give the percentage incidence in the catch of the most abundant communities and species by depth stratum and country.
Annex III gives the per stratum and total yield data per species for each sector, expressed in grammes per 30-min tow.
Catches
The total catch was 1 091 kg (5.2% of the total for the trip), with the 20– 50 m and 100–120 m depth ranges accounting for the highest percentages (Tables 11–15; Figs. 10–14).
Sparids gave the highest percentage down to a depth of 200 m, with the first three strata providing between 52% and 65% of the total. D. congoensis was the most abundant sparid between 100 and 200 m depth (38.7%), but Epinephelus, representing 15.9% and 12.0% of the catch in stratum A and B respectively (between 20 and 100 m depth) is also worth noting.
The lutjanid community accounted for 23.6% of the catch in stratum A, with Lutjanus dominating (14.5%).
The continental slope community represented more than half the catch beyond 200 m, but was rarely encountered in the deep strata. As seen in Tables 14 and 15, the highest percentages by species corresponded to H. bella in the 200–400 m depth range, and Macrouridae, between 400 and 700 m depth. Chondricthyes also represented a high proportion of the catch in both strata.
Because of their commercial importance, mention must also be made of the cephalopods, which represented 15.5% of the catch in the 50–100 m depth range (S. officinalis amounting to 8.9%).
Yields
Highest global yields in this area correspond to L. dentatus, E. aeneus and E. alexandrinus and P. bellottii. However, none of these species yielded more than 7 kg/30-min tow. The highest yields per stratum were as follows: in the 100–200 m depth range, D. congoensis and D. angolensis gave 60 and 23.5 kg/30-min tow respectively, while in the shallower stratum, L. dentatus and E. alexandrinus gave 11.8 and 10.3 kg/30-min tow respectively.
WESTERN SIERRA LEONE
20–50 m
Fig. 10. Western Sierra Leone, 20–50 m: Percentage catch distribution
Fig. 11 and 12. Western Sierra Leone, 50–100 m and 100–200 m: Percentage catch distribution
Figs. 13 and 14. Western Sierra Leone, 200–400 m and 400–700m: Percentage catch distribution
| Acanthurus monroviae | 7.6 |
| Lutjanus | 14.5 |
| Others | 1.5 |
| LUTJANID community | 23.6 |
| Brachydeuterus auritus | 2.2 |
| SCIAENID community | 2.2 |
| Epinephelus | 15.9 |
| Lagocephalus laevigatus | 1.5 |
| Pagellus bellottii | 9.4 |
| Pagrus caeruloestictus | 1.6 |
| Pseudupeneus prayensis | 5.1 |
| Serranus accraensis | 13.4 |
| Syacium micrurum | 1.7 |
| Triglidae | 1.7 |
| Others | 1.8 |
| SPARID community | 52.3 |
| Trachurus trecae | 3.8 |
| Other pelagics | 0.7 |
| PELAGICS | 4.5 |
| Raja miraletus | 1.7 |
| CHONDRICTHYES | 1.7 |
| CEPHALOPODS | 9.1 |
| OTHER SPECIES | 6.6 |
| CATCH PER STRATUM (kg) | 278 |
| Branchiostegus semifasciatus | 1.2 |
| Citharus linguatula | 1.5 |
| Dentex angolensis | 15.1 |
| Epinephelus | 12.0 |
| Pagellus bellottii | 1.5 |
| Pseudupeneus prayensis | 2.6 |
| Saurida brasilensis | 9.7 |
| Serranus accraensis | 2.3 |
| Tetraodontidae | 2.0 |
| Triglidae | 9.5 |
| Uranoscopus | 4.0 |
| Other species | 2.6 |
| SPARID community | 64.0 |
| Raja miraletus | 9.3 |
| Squatina oculata | 2.9 |
| Other species | 3.9 |
| CHONDRICTHYES | 16.1 |
| Octopus vulgaris | 2.8 |
| Sepia bertheloti | 3.2 |
| Sepia officinalis | 8.9 |
| Other species | 0.6 |
| CEPHALOPODS | 15.5 |
| OTHER SPECIES | 4.4 |
| CATCH PER STRATUM (kg) | 278 |
| Ariomma bondi | 3.4 |
| Dentex angolensis | 15.1 |
| Dentex congoensis | 38.7 |
| Spicara alta | 6.1 |
| Other species | 1.8 |
| SPARID Community | 65.1 |
| Antigonia capros | 10.5 |
| DEEP SHELF Community | 10.5 |
| Mustelus mustelus | 1.8 |
| Raja barnardi | 2.3 |
| Raja miraletus | 9.1 |
| CHONDRICTHYES | 13.3 |
| Anthias anthias | 1.6 |
| Aulopus cadenati | 2.5 |
| Scorpenidae | 5.3 |
| Other species | 1.7 |
| CATCH PER STRATUM (kg) | 450 |
| Peristedion cataprhactum | 2.5 |
| Zenopsis conchifer | 1.4 |
| DEEP SHELF Community | 3.9 |
| Chorophthalmus | 10.2 |
| Hypoclydonia bella | 30.6 |
| Macrouridae | 3.1 |
| Trigla lyra | 2.5 |
| Other species | 5.6 |
| SLOPE Community | 52.0 |
| Mustelus mustelus | 27.4 |
| Raja barnardi | 1.8 |
| CHONDRICTHYES | 29.2 |
| Illex coindetii | 4.4 |
| Sepia elegans | 3.0 |
| Todaropsis eblanae | 1.6 |
| CEPHALOPODS | 8.9 |
| CRUSTACEANS | 2.1 |
| OTHER SPECIES | 3.9 |
| CATCH PER STRATUM (kg) | 66 |
| Ectreposebastes imus | 4.1 |
| Laemonema | 3.1 |
| Lamprogrammus exutus | 6.2 |
| Lophiidae | 13.6 |
| Macrouridae | 20.7 |
| Merluccius polli | 5.4 |
| Other species | 11.2 |
| SLOPE Community | 64.3 |
| Centrophorus granulosus | 14.7 |
| Raja straeleni | 5.8 |
| Other species | 4.3 |
| CHONDRICTHYES | 24.8 |
| Paromola cuvieri | 2.7 |
| Other species | 2.7 |
| CRUSTACEANS | 5.4 |
| OTHER SPECIES | 5.5 |
| CATCH PER STRATUM (kg) | 19 |
Catches
The total catch in this area was 773 kg. The largest catches were obtained in the 50–100 m depth interval (Tables 16–20; Figs. 15–19). As in the western part of the country, sparids dominated the catches down to a depth of 200 m, whilst sciaenids were dominant (40.9%) in shallower waters.
Lutjanids accounted for only 3.3% in the shallower depths, where the crustaceans with two species of interest to fisheries, P. atlantica and P. notialis, represented 7.6%.
Below 200 m, species belonging to the slope community and the shark family dominated, with catches of C. granulosus being particularly abundant.
Yields
The best global yields (14.4 kg/30-min tow) were given by D. angolensis, with strata B and C (50–200 m) providing the highest, 41.2 and 28 kg/per 30-min tow, respectively. D. congoensis and E. aeneus gave good yields in strata C and B (18.7 and 18.0 kg/30-min tow, respectively).
C. granulosus and L. carolae were the only two non-commercial species to give particularly good yields.
EASTERN SIERRA LEONE
20–50 m
Fig. 15. Eastern Sierra Leone, 20–50 m: Percentage catch distribution
Figs. 16 and 17. Eastern Sierra Leone, 50–100 and 100–200 m: Percentage catch distribution
Figs. 18 and 19. Eastern Sierra Leone, 200–400 and 400–700 m: Percentage catch distribution
| LUTJANID Community | 3.3 |
| Brachydeuterus auritus | 34.4 |
| Pseudotolithus typus | 4.8 |
| Others | 1.7 |
| SCIAENID Community | 40.9 |
| Lagocephalus laevigatus | 5.6 |
| Saurida brasilensis | 15.4 |
| Syacium micrurum | 3.0 |
| Others | 4.8 |
| SPARID Community | 28.8 |
| CEPHALOPODS | 5.0 |
| Parapenaeopsis atlantica | 2.5 |
| Penaeus notialis | 2.5 |
| Others | 2.6 |
| CRUSTACEANS | 7.6 |
| OTHER SPECIES | 14.5 |
| CATCH PER STRATUM (kg) | 64 |
| Citharus linguatula | 3.8 |
| Dentex angolensis | 35.0 |
| Dentex congoensis | 2.9 |
| Epinephelus aeneus | 15.2 |
| Saurida brasilensis | 5.8 |
| Serranus accraensis | 2.8 |
| Triglidae | 9.7 |
| Uranoscopus albesca | 2.4 |
| Others | 1.9 |
| SPARID Community | 79.6 |
| Raja miraletus | 8.9 |
| CHONDRICTHYES | 8.9 |
| Octopus vulgaris | 2.1 |
| Sepia bertheloti | 4.9 |
| CEPHALOPODS | 6.9 |
| OTHER SPECIES | 4.6 |
| CATCH PER STRATUM (kg) | 325 |
| Brotula barbata | 1.5 |
| Dentex angolensis | 33.0 |
| Dentex congoensis | 21.9 |
| Epinephelus guaza | 2.0 |
| Others | 2.8 |
| SPARID Community | 60.1 |
| Hypoclydonia bella | 6.9 |
| Others | 3.2 |
| SLOPE Community | 9.9 |
| Mustelus mustelus | 12.2 |
| Raja miraletus | 4.7 |
| Squatina oculata | 9.8 |
| CHONDRICTHYES | 26.3 |
| CEPHALOPODS | 1.6 |
| OTHER SPECIES | 2.1 |
| CATCH PER STRATUM (kg) | 232 |
| Brotula barbata | 3.8 |
| Others | 2.3 |
| SPARID Community | 6.1 |
| Chlorophthalmus | 1.8 |
| Gephyroberyx darwini | 3.7 |
| Hypoclydonia bella | 6.0 |
| Lophiidae | 4.4 |
| Macrouridae | 8.2 |
| Merluccius polli | 4.2 |
| Scorpaenidae | 7.0 |
| Others | 4.1 |
| SLOPE Community | 39.3 |
| Centrophorus granulosus | 15.6 |
| Mustelus mustelus | 9.5 |
| Oxynotus centrina | 5.3 |
| Squatina oculata | 8.2 |
| Others | 3.5 |
| CHONDRICTHYES | 42.1 |
| CEPHALOPODS | 4.8 |
| CRUSTACEANS | 5.3 |
| OTHER SPECIES | 2.3 |
| CATCH PER STRATUM (kg) | 70 |
| Chaunax pictus | 2.9 |
| Laemonema laureysi | 3.8 |
| Lamprogrammus exutus | 2.6 |
| Lophiidae | 21.2 |
| Macrouridae | 8.8 |
| Merluccius polli | 1.9 |
| Others | 3.6 |
| SLOPE Community | 44.8 |
| Centrophorus granulosus | 41.8 |
| Oxynotus centrina | 1.3 |
| Others | 2.6 |
| CHONDRICTHYES | 45.8 |
| Todaropsis eblanae | 5.2 |
| CEPHALOPODS | 5.2 |
| Pontophilus sp. | 1.4 |
| Paromola cuvieri | 1.5 |
| CRUSTACEANS | 2.9 |
| OTHER SPECIES | 1.4 |
| CATCH PER STRATUM (kg) | 82 |
Catches
Catches in Liberian waters totalled 3 875 kg, the catch rate being highest in the 50–100 m depth stratum (Tables 21–25; Figs. 20–24). Sparids dominated between 20 and 400 m, accounting for 39–48% of the total catch in each of the strata concerned. The dominant species at 100–200 m depth was D. angolensis, with 26.6% while the most abundant catches in the first depth stratum corresponded to non-commercial species, S. brasiliensis (13.9%) and S. accraensis (11.7%). Sparids were also abundant between 200 and 400 m depth, where A. bondi accounted for 40.7%.
Also worth mentioning in the 50–100 m depth stratum are the catches of “groupers”, Epinephelus, species of considerable commercial value to artisanal fisheries in the region (8.2%).
In shallow waters, sciaenids made up for 20.7% of the catch, the dominant species being B. auritus (13.1%).
Between 100 and 200 m depth, 29.1% of the catch comprised species belonging to the deep shelf community, mainly A. capros, but also small quantities of P. cataphractum.
Beyond 200 m, the slope community was the best represented, with H. bella and the shark C. granulosus (16.8%) dominating at 400–700 m, where catches were nevertheless very small.
The dominant cephalopods were S. bertheloti in shallow waters and Illex condeiti and T. eblenae in deep tows.
Among the crustaceans, P. validus accounted for 2.3% of the catch in stratum A, while N. africanus represented 5.9% in the deeper stratum.
Yields
The highest yields for the entire area were: E. encrasicholus (29.3kg/30-min tow), D. angolensis (11.7 kg/30-min tow) and E. aeneus (6 kg/30-min tow). Of the non-commercial species, S. brasiliensis gave an overall yield of 6 kg/ 30-min tow.
The anchovy, E. encrasicholus, gave a substantial yield in stratum B (45.8% of the catch) in the vicinity of Cape Three Points, which coincides with the western front of the Ivorio-Ghanaian upwelling zone.
The highest yields per stratum of demersal species were: D. angolensis in strata C and B, and B. auritus and E. aeneus in strata A and B respectively. The highest yields among the non-commercial species were: A. bondi (60 kg/ 30-min tow) and H. bella at 200–400 m, A. capros at 100–200 m and S. brasiliensis and S. accraensis at 20–50 m.
Crustacean yields were very low; only two species, P. validus in the first stratum and P. cuvieri in the fourth yielded more than 2kg/30-min tow.
The only cephalopod to yield more than 2 kg/30-min tow was S. bertheloti.
Fig. 20. Liberia, 20–50 m: Percentage catch distribution
Figs. 21 and 22. Liberia, 50–100 and 100–200 m: Percentage catch distribution
Figs. 23 and 24. Liberia, 200–400 and 400–700 m: Percentage catch distribution
| Brachydeuterus auritus | 13.1 |
| Ilisha africana | 2.6 |
| Galeoides decadactylus | 0.8 |
| Pseudotolithus | 1.0 |
| Pteroscion peli | 2.2 |
| Selene dorsalis | 1.0 |
| SCIAENID Community | 20.7 |
| Chylomipterus antennatus | 0.8 |
| Citharus linguatula | 0.7 |
| Dactylopterus volitans | 1.2 |
| Dentex angolensis | 1.0 |
| Neanthias accraensis | 11.7 |
| Pseudupeneus prayensis | 2.6 |
| Saurida brasilensis | 13.9 |
| Sphyraena piscatorum | 1.2 |
| Triglidae | 4.7 |
| Others | 0.9 |
| SPARID Community | 38.7 |
| Cynoglossus canariensis | 4.2 |
| Sardinella maderensis | 6.2 |
| Mustelus mustelus | 5.1 |
| Raja miraletus | 9.4 |
| CHONDRICTHYES | 14.5 |
| Sepia bertheloti | 2.7 |
| Sepia officinalis | 0.7 |
| CEPHALOPODS | 3.4 |
| Parapeneopsis atlantica | 0.5 |
| Portunus validus | 2.3 |
| CRUSTACEANS | 2.8 |
| OTHER SPECIES | 9.5 |
| CATCH PER STRATUM (kg) | 492 |
| Citharus linguatula | 1.7 |
| Dentex angolensis | 11.6 |
| Dentex congoensis | 2.0 |
| Epinephelus | 8.2 |
| Pagellus bellottii | 2.5 |
| Pentheroscion mbizi | 1.0 |
| Pseudupeneus prayensis | 1.0 |
| Saurida brasilensis | 2.6 |
| Triglidae | 5.4 |
| Uranoscopus | 1.0 |
| Others | 4.1 |
| SPARID Community | 41.1 |
| Raja miraletus | 2.3 |
| Squatina | 1.9 |
| CHONDRICTHYES | 4.2 |
| Sepia bertheloti | 2.4 |
| CEPHALOPODS | 2.7 |
| Engraulis encrasicholus | 45.8 |
| Sardinella | 2.0 |
| PELAGICS | 47.8 |
| OTHER SPECIES | 4.2 |
| CATCH PER STRATUM (kg) | 1300 |
| Brotula barbata | 2.0 |
| Dentex angolensis | 26.6 |
| Dentex congoensis | 6.5 |
| Epinephelus | 1.0 |
| Liosaccus cutaneus | 2.0 |
| Spicara alta | 1.3 |
| Triglidae | 2.7 |
| Uranoscopus | 1.0 |
| Others | 2.1 |
| SPARID Community | 45.2 |
| Antigonia capros | 26.9 |
| Peristedion cataphractum | 2.2 |
| DEEP SHELF Community | 29.1 |
| Scorpenidae | 1.5 |
| Others | 1.4 |
| SLOPE Community | 2.9 |
| Mustelus mustelus | 5.4 |
| Raja miraletus | 3.2 |
| Squalus blanvillei | 1.3 |
| Squatina | 6.0 |
| CHONDRICTHYES | 15.9 |
| CEPHALOPODS | 1.1 |
| OTHER SPECIES | 5.8 |
| CATCH PER STRATUM (kg) | 777 |
| Arioma bondi | 40.7 |
| Dentex angolensis | 5.2 |
| Others | 1.9 |
| SPARID Community | 47.8 |
| Antigonia capros | 5.5 |
| Peristedion cataphractum | 1.1 |
| Others | 1.5 |
| SLOPE Community | 8.1 |
| Hypoclidonia bella | 12.1 |
| Macrouridae | 3.2 |
| Scorpenidae | 1.6 |
| Others | 1.4 |
| SLOPE Community | 25.0 |
| Mustelus mustelus | 4.6 |
| Raja barnardi | 1.0 |
| Squalus blanvillei | 1.0 |
| Squatina | 5.4 |
| CHONDRICTHYES | 12.8 |
| Todaropsis eblenae | 1.0 |
| CEPHALOPODS | 1.3 |
| CRUSTACEANS | 1.3 |
| OTHER SPECIES | 3.7 |
| CATCH PER STRATUM (kg) | 1181 |
| Chaunax pictus | 2.7 |
| Cubiceps | 12.2 |
| Halosaurus oweni | 1.1 |
| Laemonema | 2.9 |
| Lamprogramun | 6.9 |
| Lophiidae | 7.5 |
| Macrouridae | 6.0 |
| SLOPE Community | 43.4 |
| Deania calcea | 4.2 |
| Rays | 1.8 |
| Centrophorus granulosus | 16.8 |
| Squalus blanvillei | 1.1 |
| CHONDRICTHYES | 23.9 |
| Illex condeiti | 3.2 |
| Todaropsis eblenae | 2.4 |
| CEPHALOPODS | 5.6 |
| Nematocarcinus africanus | 5.9 |
| Paromola cuvieri | 2.3 |
| Pontophilus | 1.1 |
| CRUSTACEANS | 9.3 |
| OTHER SPECIES | 17.8 |
| CATCH PER STRATUM (kg) | 125 |
Catches
Tables 26–28 and figures 25–27 give the percentage catch distribution of the various communities in the three depth ranges surveyed.
The total catch amounted to 11 248 kg, 43% of which was taken in the 20–50 m depth range. It is noted that S. alta with 2 350 kg (taken in haul 128), alone accounts for half the total catch in the deep stratum (> 100 m).
The sparid community makes up a large proportion of the catch, especially in the 50–100 m depth range (82.5%), but also in the 20–50 m stratum (41.7%). P. bellottii (18.4%) and D. angolensis (15.6%) dominated in Stratum A and B respectively. The dominant species in the by-catch were D. volitans and P. arenatus in Stratum A and Triglidae, A. bondi and P. arenatus in Stratum B. As anticipated, the sciaenid community is well represented in the 20–50 m depth interval, where it accounts for 35% of the catch, with the small Pomadasyidae, Brachydeuterus auritus (15.6%) dominating. This community, however, accounted for only 5.1% of the catch in Stratum B and was not represented in deep waters.
The Chondricthyes were represented in the same proportions in all three strata. The largest catches corresponded to Mustelus mustelus and Raja miraletus in shallower waters, and C. granulosus in deeper waters.
The “sole” (Cynoglossus canariensis) accounted for 5.7% of the total catch in stratum A, where it was caught in all tows.
The slope community, especially H. bella and the two Chlorophthalmus species, dominated in deep waters.
As regards crustaceans and cephalopods, the former, occuring only beyond 100 m depth, accounted for only 1% of the catch, while the latter represented 6.6% of the catch in Stratum A, with the two cuttlefish species, S. officinalis and S. bertheloti dominating. In stratum B the largest catches corresponded to the octopus, Octopus vulgaris.
Yields
The highest yields overall corresponded to S. alta, with 80 kg/30-min tow. The commercial species providing the best yields were P. bellottii and D. angolensis, with 49.5 and 46.1 kg/30-min tow, respectively, followed by B. auritus, with 30.1 kg/30-min tow.
P. bellottii yielded 86 and 48 kg/30-min tow in stratum A and B, respectively. The highest yields of D. angolensis were obtained in stratum B (80 kg/30-min tow).
Another valuable commercial species, E. aeneus, yielded 12.2 kg/30-min tow for the country as a whole, with the best results (22.1 kg/30-min tow) being obtained in the 50–100 m depth range, which coincides with the bathymetric distribution range quoted for this species.
The only cephalopod worth mentioning is S. officinalis, for which a yield of 18.8 kg/30-min tow was obtained in shallow waters.
A. bondi, P. arenatus, Lepidotrigla carolae and Raja miraletus were among the species yielding more than 10 kg/30-min. tow in this sector.
This was the only area where Geryon maritae was caught in significant quantities (1.1 kg/30-min tow in the deep stratum), and this may be due to the different gear used in this sector. This yield is nevertheless rather low compared with results obtained in other areas where the species is fished commercially (between 10 and 30 kg/30-min tow).
Fig. 25. Côte d'Ivoire, 20–50 m: Percentage catch distribution
Figs. 26 and 27. Côte d'Ivoire, 50–100 and >100 m: Percentage catch distribution
| Brachydeuterus auritus | 15.6 |
| Chloroscombrus chrysurus | 1.1 |
| Eucinostomus melanopterus | 5.8 |
| Galeoides decadactylus | 6.6 |
| Pseudotolithus | 3.8 |
| Selene dorsalis | 2.0 |
| SCIAENID Community | 34.9 |
| Dactylopterus volitans | 5.9 |
| Dentex angolensis | 3.5 |
| Pagellus bellottii | 18.4 |
| Priacanthus arenatus | 5.0 |
| Pseudupeneus prayensis | 2.8 |
| Sphyraena piscatorum | 1.5 |
| Umbrina canariensis | 1.1 |
| Syacium micrurum | 1.4 |
| Others | 2.2 |
| SPARID Community | 41.8 |
| Cynoglossus canariensis | 3.6 |
| Mustelus mustelus | 2.7 |
| Raja miraletus | 3.1 |
| CHONDRICTHYES | 5.8 |
| Sepia bertheloti | 2.5 |
| Sepia officinalis | 2.9 |
| Others | 1.2 |
| CEPHALOPODS | 6.6 |
| OTHER SPECIES | 7.3 |
| CATCH PER STRATUM (kg) | 4809 |
| Brachydeuterus auritus | 4.3 |
| Others | 0.8 |
| SCIAENID Community | 5.1 |
| Arioma bondi | 6.2 |
| Brotula barbata | 1.7 |
| Citharus linguatula | 3.2 |
| Dentex angolensis | 23.4 |
| Dentex canariensis | 1.2 |
| Dentex congoensis | 5.1 |
| Epinephelus aeneus | 2.8 |
| Laegocephalus laevigatus | 1.9 |
| Pagellus bellottii | 16.2 |
| Pentheroscion mbizi | 2.1 |
| Priacanthus arenatus | 5.5 |
| Pseudupeneus prayensis | 1.5 |
| Triglidae | 8.1 |
| Umbrina canariensis | 1.3 |
| Uranoscopus | 1.0 |
| Others | 1.2 |
| SPARID Community | 82.4 |
| Mustelus mustelus | 1.1 |
| Raja miraletus | 3.1 |
| Squatina | 1.0 |
| Others | 0.7 |
| CHONDRICTHYES | 5.9 |
| Octopus vulgaris | 1.3 |
| Sepia | 1.5 |
| Others | 1.3 |
| CEPHALOPODS | 4.1 |
| OTHER SPECIES | 2.5 |
| CATCH PER STRATUM (kg) | 3316 |
| Spicara alta | 77.8 |
| Others | 1.3 |
| SPARID Community | 79.1 |
| Chlorophthalmus | 1.4 |
| Hypoclidonia bella | 4.6 |
| Ijimania lopei | 1.4 |
| Macrouridae | 1.1 |
| Others | 1.6 |
| SLOPE Community | 10.1 |
| Centrophorus granulosus | 4.1 |
| Mustelus mustelus | 1.0 |
| CHONDRICTHYES | 5.6 |
| CEPHALOPODS | 1.3 |
| OTHER SPECIES | 3.9 |
| CATCH PER STRATUM (kg) | 3123 |
Catches
The total catch in Ghanaian waters amounted to 3 098 kg, the most abundant hauls being obtained below 100 m depth (Tables 29–31; Figs. 28–30).
Sparids were almost half the catch in the 20–50 m depth range. The catches of P. caeruloestictus (14.6%), a species of importance to fisheries, and D. volitans, a non-commercial species, are worth mentioning. The largest catches in stratum B (50–100 m) were P. bellottii (10.7%) and Triglidae (12.4 %). The dominant individual species in the deep stratum was H. bella, which accounted for 28.1% of the catch.
Most noteworthy in Ghana were the catches of S. officinalis, a very valuable commercial species, which accounted for 20.6% of the catch in the 50–100 m depth range.
Yields
The highest yields recorded for the country corresponded to S. officinalis, (13.9 kg/30-min tow overall mean and 19.5 kg/30-min tow in the 50–100 m depth range).
The only commercial fishes worth mentioning are the sparids, P. caeruloestictus (7 kg/30-min tow) and P. bellottii (5.6 kg/30-min tow). The sparids were also the commercial species offering the highest yields by stratum, even though these were by far exceeded by non-commercial species such as H. bella and S. oculata.
| Acanthostracion | 2.3 |
| Acanthurus monroviae | 2.2 |
| Balistes punctatus | 4.9 |
| Lethrinus atlanticus | 3.6 |
| Lutjanus fulgens | 1.7 |
| Monacanthidae | 1.5 |
| Others | 0.8 |
| LUTJANID Community | 16.9 |
| Brachydeuterus auritus | 2.4 |
| Pomadassidae | 1.0 |
| Others | 1.0 |
| SCIAENID Community | 4.4 |
| Dactylopterus volitans | 14.8 |
| Dentex canariensis | 3.4 |
| Epinephelus aeneus | 1.4 |
| Pagellus bellottii | 2.3 |
| Pagrus caeruloestictus | 14.6 |
| Priacanthus arenatus | 1.7 |
| Pseudupeneus prayensis | 3.6 |
| Syacium micrurum | 1.5 |
| Umbrina | 2.2 |
| Others | 1.9 |
| SPARID Community | 47.4 |
| Cynoglossus canariensis | 1.1 |
| Dasyatidae | 2.5 |
| Raja miraletus | 3.2 |
| Rhinobatos | 4.3 |
| Zanobatus schoenlenii | 1.5 |
| Others | 1.1 |
| CHONDRICTHYES | 12.5 |
| Sepia officinalis | 12.7 |
| CEPHALOPODS | 13.5 |
| OTHER SPECIES | 4.1 |
| CATCH PER STRATUM (kg) | 745 |
| Alutherus punctatus | 1.0 |
| Others | 1.5 |
| LUTJANID Community | 2.5 |
| Dactylopterus volitans | 9.6 |
| Dentex angolensis | 4.0 |
| Dentex canariensis | 5.8 |
| Dentex congoensis | 1.5 |
| Epinephelus aeneus | 5.8 |
| Pagellus bellottii | 10.7 |
| Pagrus coeruloectistus | 3.6 |
| Priacanthus arenatus | 1.0 |
| Pseudupeneus prayensis | 2.9 |
| Tetraodontidae | 2.1 |
| Triglidae | 12.4 |
| Others | 3.0 |
| SPARID Community | 62.7 |
| Zeus faber | 1.5 |
| Mustelus mustelus | 1.1 |
| Raja miraletus | 7.1 |
| CHONDRICTHYES | 8.9 |
| Sepia bertheloti | 1.7 |
| Sepia officinalis | 20.6 |
| CEPHALOPODS | 22.5 |
| OTHER SPECIES | 1.9 |
| CATCH PER STRATUM (kg) | 1046 |
| Dentex angolensis | 1.7 |
| Dentex congoensis | 3.5 |
| Dentex gibbosus | 4.2 |
| Spicara alta | 1.9 |
| Triglidae | 1.7 |
| Umbrina canariensis | 2.6 |
| Others | 1.9 |
| SPARID Community | 17.5 |
| Zenopsis conchifer | 2.9 |
| DEEP SHELF Community | 3.4 |
| Chlorophthalmus | 6.2 |
| Gephyroberyx | 3.6 |
| Hypoclidonia bella | 28.1 |
| Macrouridae | 1.2 |
| Trigla lyra | 1.0 |
| Others | 2.0 |
| SLOPE Community | 41.9 |
| Sphoeroides cutaneus | 3.0 |
| Centrophorus granulosus | 1.0 |
| Mustelus mustelus | 6.2 |
| Rajidae | 1.3 |
| Squatina | 18.5 |
| Torpedo nobiliana | 3.0 |
| Others | 1.2 |
| CHONDRICTHYES | 31.2 |
| CEPHALOPODS | 1.3 |
| OTHER SPECIES | 1.7 |
| CATCH PER STRATUM (kg) | 2117 |
GHANA
20–50 m
Fig. 28. Ghana. 20–50 m: Percentage catch distribution
Figs. 29 and 30. Ghana, 50–100 and >100 m: Percentage catch distribution
Catches
Tables 32 and 33 summarize the overall catches obtained in the different strata in each country. The total catch for the trip was 20 891 kg.
More than half of that total was fished in Côte d'Ivoire; Sierra Leone's share amounted to 8.9%, while Liberia and Ghana provided almost identical shares, 18.5% and 18.7%, respectively.
As already noted, a more efficient type of gear was used in Côte d'Ivoire (pp 43–44). In order to compare the Côte d'Ivoire results with those of the other areas, each country's catch should be divided by 3.12, a mean coefficient derived from the basis of the catches obtained with each type of gear (Table 6). This would give 3 605 kg for Côte d'Ivoire as a whole, very close to the figure obtained in Ghana, which is also situated in the most productive central upwelling area of the Gulf of Guinea.
Mean catches by stratum and area (Tables 34 and 35; Figs. 31 and 32) are much higher in sector 2 (Côte d'Ivoire-Ghana). After applying the coefficient 3.12, Côte d'Ivoire's mean catch would be 144.2 kg, slightly higher than, but of the same order as Ghana's. The mean for sector 2 would therefore be 139.4 kg, much higher than that obtained for sector 1 (87.0 kg).
Sierra Leone would appear to be the least productive area, with mean catches differing little between east and west (59.5 and 68.2 kg, respectively). Furthermore, the mean catch figure obtained for Liberia, 104.7 kg (much higher than Sierra Leone's) would not appear to confirm the earlier assumption that Liberian waters were unproductive.
The 50–100 m depth stratum in the Sierra Leone-Liberia sector was the most productive, with a mean of 126.9 kg per haul, while the deep stratum (400–700 m) gave only 20.5 kg per tow. The most productive depth range in the Côte d'Ivoire-Ghana sector was that below 100 m.
| Depth (m) | 20–50 | 50–100 | 100–200 | 200–400 | 400–700 | Total |
|---|---|---|---|---|---|---|
| Western Sierra Leone | 278 | 278 | 450 | 66 | 19 | 1091 |
| Eastern Sierra Leone | 64 | 325 | 232 | 70 | 82 | 773 |
| Liberia | 492 | 1300 | 777 | 1181 | 125 | 3875 |
| TOTAL SECTOR 1 | 834 | 1903 | 1459 | 1317 | 226 | 5739 |
| Depth (m) | 20–50 | 50–100 | >100 | Total |
|---|---|---|---|---|
| Côte d'Ivoire | 4809 | 3316 | 3123 | 11248 |
| Ghana | 741 | 1046 | 2117 | 3904 |
| TOTAL SECTOR 2 | 5550 | 4362 | 5240 | 15152 |
| Depth (m) | 20–50 | 50–100 | 100–200 | 200–400 | 400–700 | Total |
|---|---|---|---|---|---|---|
| Western Sierra Leone | 59.5 | 69.5 | 150.0 | 22.0 | 9.5 | 68.2 |
| Eastern Sierra Leone | 21.3 | 108.3 | 77.3 | 35.0 | 41.0 | 59.5 |
| Liberia | 98.4 | 162.5 | 86.3 | 147.6 | 17.9 | 104.7 |
| TOTAL SECTOR 1 | 69.5 | 126.9 | 97.3 | 101.3 | 20.5 | 87.0 |
| Depth (m) | 20–50 | 50–100 | >100 | Total |
|---|---|---|---|---|
| Côte d'Ivoire | 480.9 | 368.4 | 520.5 | 449.9 |
| Ghana | 82.3 | 95.1 | 235.2 | 134.6 |
| TOTAL SECTOR 2 | 292.1 | 218.1 | 349.3 | 280.6 |
Fig. 31. Mean catches per depth stratum (kg/No tows) in Sector 1
Fig. 32. Mean catches per depth stratum (kg/No tows) in Sector 2
Yields
The highest overall yields were obtained in Côte d'Ivoire. As already stated, the higher yields of many of the species were due to the more efficient gear used. Among the higher yielding species were P. bellottii (49.5 kg/30-min tow) and D. angolensis (46.1 kg/30-min tow), followed by B. auritus (30.1 kg/ 30-min tow) and S. officinalis (18.8 kg/30-min tow).
Total yields were not as high in the other areas. The exceptional yield of the pelagic species, E. encrasicholus in Liberia (29.3 kg/30-min tow) was a mere coincidence.
The highest-yielding of all the species (commercial and non-commercial) was S. alta (80 kg/30-min tow), which also gave the highest per stratum yield (all species included) in Côte d'Ivoire's deep stratum (406 kg/30-min tow).
Of the commercial species, the sparids gave good yields on the whole, although these varied from species to species depending on geographical area. The highest were attributable to P. bellottii and D. angolensis (86.0 kg/30-min tow in the 20–50 m depth range and 80.0 kg/30-min tow in the 50–100 m depth range respectively) in Côte d'Ivoire, and D. congoensis (60.0 kg/30-min in the 100–200 m depth range) in Western Sierra Leone.
The yield of B. auritus of the sciaenid community in stratum A in Côte d'Ivoire (77.8 kg/30-min tow) is also worth noting.
Among the high yielding, but currently unmarketed species which could be useful resources are S. alta (mentioned above), H. bella and A. bondi. The latter, already noted for its abundance in the deep shelf, yielded 60 kg/30-min tow in the 200–400 m depth stratum in Liberian waters.
S. officinalis would appear to be exploitable in Côte d'Ivoire and Ghana where it yielded 18.8 and 13.9 kg/30-min tow, respectively.
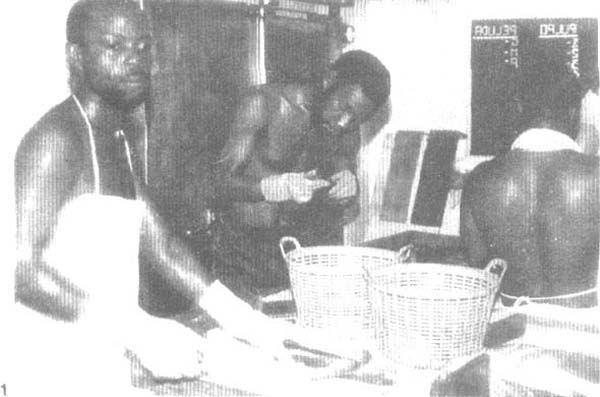
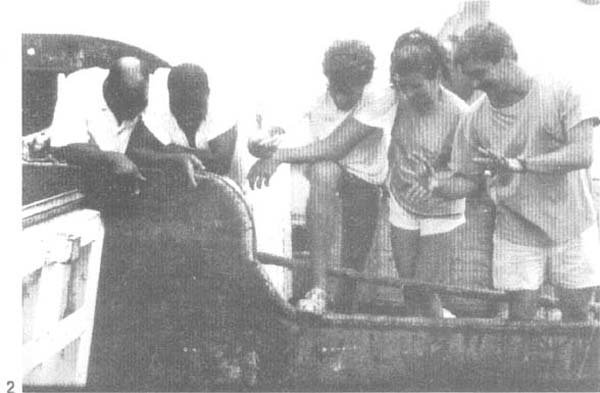
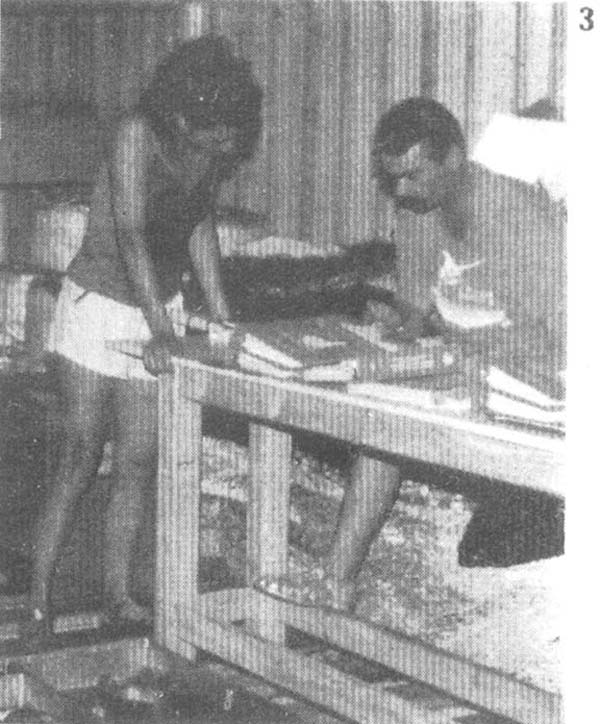
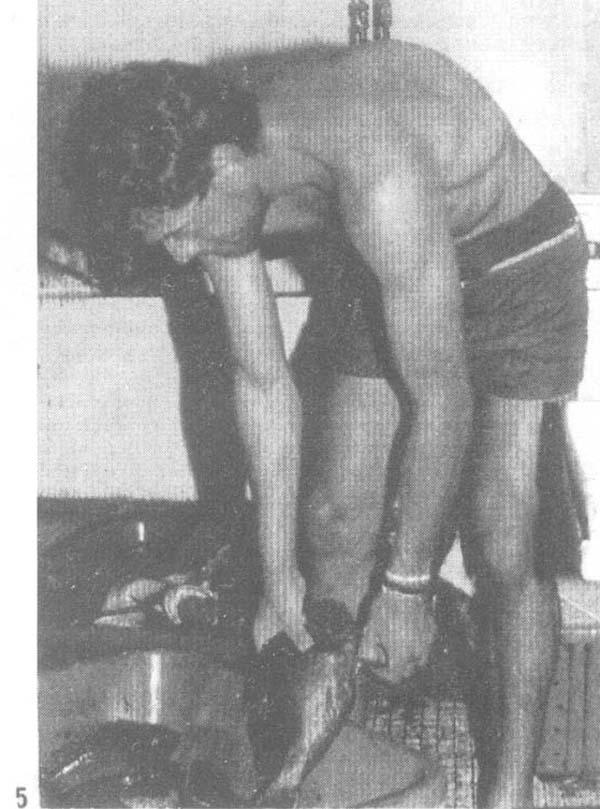
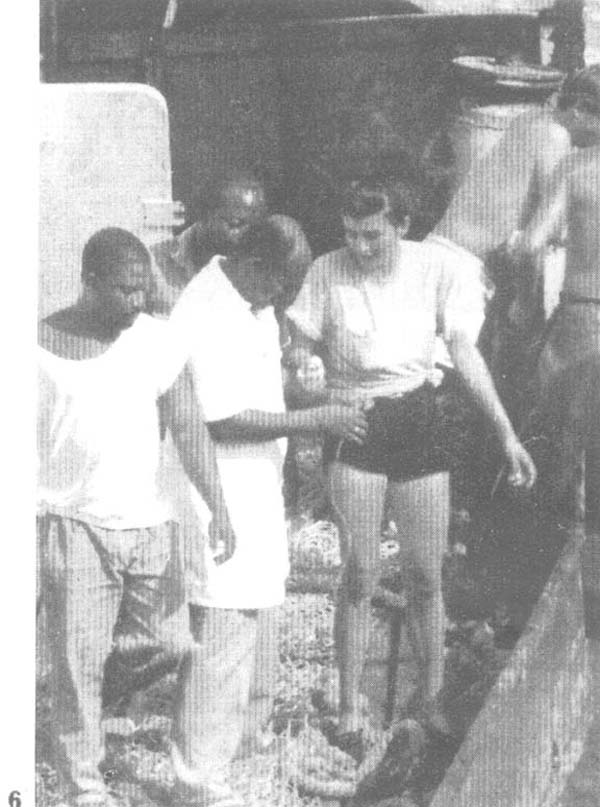
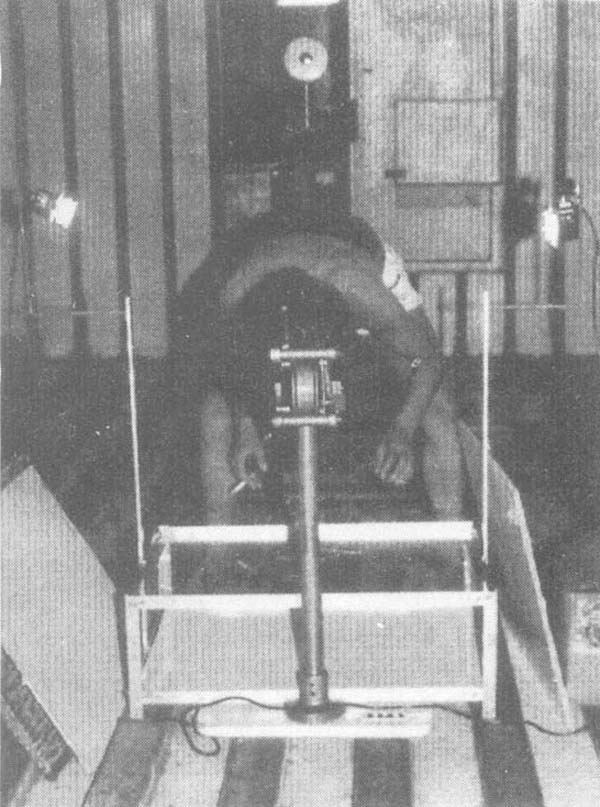
Various moments of the seientistis'working day.
Sampling sparids
Inspecting the catch
Determining the species
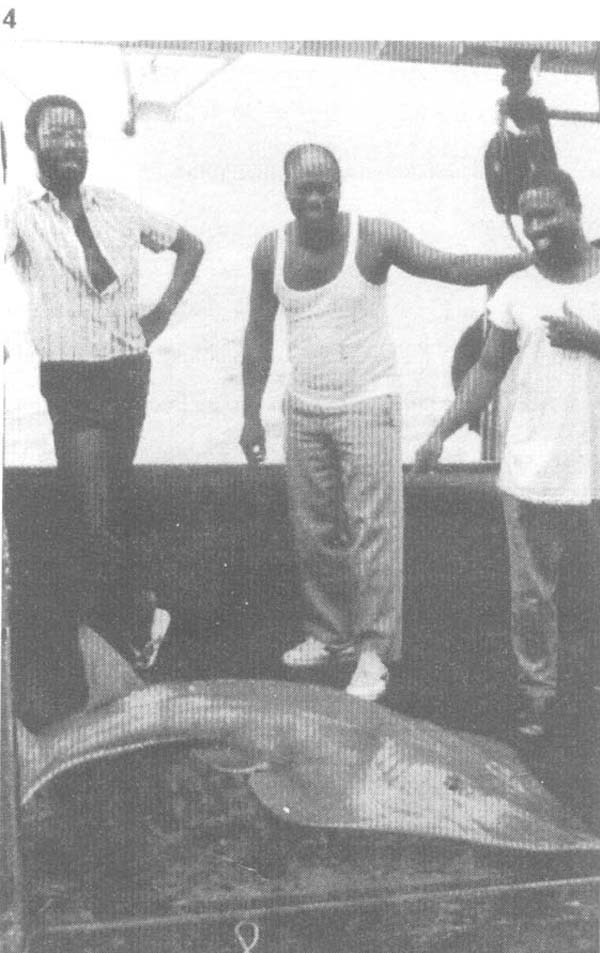
What a catch!
Sorting lutijanids
Commenting
Photographic equipment
Size sampling was done for almost all the target species. The most intensively sampled were the sparids, a total of six species of this community being studied for this report. The length measurement used was fork length (expressed as total length in the graphs).
Total length to the nearest centimetre below was used for the other fish species, but only the findings for the Pomadasyidae, B. auritus, are given here. Most of the unprocessed data concerned the associated fauna (B. barbata, A. bondi, Z. conchifer, etc.). These data will be presented to the Working Group on Demersals in the Western Gulf of Guinea.
Mantle length was used for Sepiidae and the length of the cephalothorax for crustaceans.
The size distributions obtained in the random samples (excluding E. aeneus, D. canariensis, M. polli and P. longirostris, where the entire catch was sampled), were weighted on a by-stratum and total area basis and corresponding frequency histograms obtained.
Of all the sparid species sampled, Dentex angolensis had the widest bathymetric distribution, with large-size specimens being caught below 300 m depth in Liberian and Eastern Sierra Leonean waters. It was also present in more than 50% of successful hauls in all the countries surveyed, with catches in Côte d'Ivoire being particularly large.
Tables 38–42 give the size distributions (number of specimens and percentages) by stratum in each country and for each area as a whole. Figs. 33–41 give the corresponding frequency histograms.
The population structure of this species is very similar in all the countries except Liberia, where in addition to being found in a deeper stratum, it was more apparent that mean and modal sizes increased gradually with increasing depth.
The population in the 20–50 m depth range in Liberia is composed exclusively of juveniles ranging between 4 and 10 cm in length (mean length 7.31 cm; standard deviation 1.24 cm).
Specimens caught between 50 and 100 m show a wider size range (5–24 cm) and fall mainly into two groups: one with a modal size of 10 cm and the other a modal size of 14 cm. There are two smaller groups, however, with modal sizes of 17 and 21 cm, respectively.
The first size group virtually disappears moving from stratum B to stratum C, while part of the population (with a very distinct modal size of 14 cm), maintains a wide size range of between 9 and 26 cm, even at this depth (100–200 m). Mean size between stratum B and C increases from 14.89 cm (±4.37) to 15.96 cm (± 2.98).
There is a clear shift in modal value and mean length in the 200–400 m depth range (to 26 cm and 25.33 ±1.3, respectively), indicating that individuals tend to migrate to deeper waters as they grow older. Here, as in stratum A, size range narrows, maximum lengths of 29 cm are encountered and specimens below 23 cm length disappear altogether.
The frequency distribution of this species is more normal and size range wider throughout the Liberian sector than in the other countries (Fig. 40). Mean size for all depth ranges is 14.91 cm (standard deviation 4.78 cm).
This sparid is caught in all three depth ranges under consideration in Sector 2, but only the specimens caught in the first two depth ranges in Côte d'Ivoire (20–100 m) and in the last two in Ghana (50–>100 m) were measured, as catches in the other strata were very small.
It was present between 50 and 200 m in both Western and Eastern Sierra Leone, although the catch in stratum D in the east was very small and not sampled.
It was noted that younger individuals (modal sizes in the region of 10–11 cm) cohabit with adults on the same bottoms up to 100 m depth in all the countries. Smaller sizes dominate in Western Sierra Leone, Côte d'Ivoire and Ghana, while in Eastern Sierra Leone and Liberia, the main mode between 50 and 100 m depth is slightly higher and corresponds to the larger size group (Figs. 34 and 35).
More homogenous populations appear below 100 m: the size ranges narrow slightly, the main modal values are situated around the larger sizes and individuals of less than 12 cm disappear.
This was not observed in Ghana where specimens of 9 and 10 cm in length are caught below 100 m. However, few individuals were sampled and the frequency histogram (Fig. 38) is not very representative. Ghana therefore has the lowest estimated mean length of all the countries (12.96 cm), despite the significant increase in length between stratum B and C (from 11.32 to 16.28 cm).
Mean population length increases with depth in all the countries (see Table 36). The largest sizes were encountered in Sierra Leone (16.86 cm; standard deviation 3.67 cm).
| Depth (m) | 20–50 | 50–100 | 100–200 | 200–400 | TOTAL |
|---|---|---|---|---|---|
| Western Sierra Leone | 13.37 | 18.55 | 15.33 | ||
| (4.18) | (2.06) | (4.35) | |||
| Eastern Sierra Leone | 16.37 | 17.77 | 16.86 | ||
| (3.85) | (3.10) | (3.67) | |||
| Liberia | 7.31 | 14.89 | 15.96 | 25.33 | 14.91 |
| (1.24) | (4.37) | (2.98) | (1.30) | (4.78) |
| Depth (m) | 20–50 | 50–100 | >100 | TOTAL |
|---|---|---|---|---|
| Côte d'Ivoire | 13.79 | 15.46 | 15.21 | |
| (5.07) | (3.91) | (4.51) | ||
| Ghana | 11.32 | 16.28 | 12.96 | |
| (3.09) | (3.81) | (4.16) |
Length distributions by sex
Length sampling by sex was done for all the depth strata (mentioned previously) of all the countries except Liberia and Côte d'Ivoire, where stratum A was not covered. Too few measurements were taken in Ghana to allow representative distributions per stratum to be calculated and only frequency histograms by area are presented here. The 50–100 m stratum in Sierra Leone was not considered either for the same reason.
Male and female size distributions (by stratum and for each area or country) differ considerably (Tables 43–57 and Figs. 42–58).
At all depths female mean length is clearly shorter and size ranges wider than male. Only in stratum D in Liberia was female mean length slightly higher (25.42 cm) than male (25.10), both sexes showing identical size ranges (23–29 cm) (Fig.52).
This would seem to suggest that this D. angolensis population is protogynous (i.e., the fish first maturing sexually as females and changing into males later, when they are between 16 and 22 cm).
Females are also much more abundant than males in catches in certain strata and may account for as much as eight times the weight of males. Juveniles appear in the 50–100 m depth stratum (B) in both western and eastern Sierra Leone and in stratum B and C in Liberia, with estimated mean sizes 9.14 cm (±0.99), 10 cm (±0.71) and 8.95 cm (±1.37) respectively.
Male lengths in stratum B and C are almost identical, although there is a slight shift toward larger sizes with increasing depth. Size range and modal size increases are somewhat more obvious when they occur in females.
Modal and mean lengths of both sexes increase significantly between 200 and 400 m depth and individuals below 23 cm in length disappear, signs that the population here consists of older adults that have completed their sex change and are migrating to greater depths.
Finally, female distributions appear more uniform (with a stronger bias toward longer individuals) (Fig. 53).
Table 37 gives the mean sizes and standard deviations by area for both sexes and for juveniles.
| MALES | FEMALES | JUVENILES | |
|---|---|---|---|
| Western S. Leone | 21.04 (1.62) | 17.38 (2.14) | 9.14 (0.99) |
| Eastern S. Leone | 20.30 (1.90) | 16.61 (2.22) | 10.00 (0.71) |
| Liberia | 22.03 (2.09) | 16.01 (3.18) | 8.95 (1.37) |
| Côte d'Ivoire | 19.76 (1.51) | 15.97 (1.50) | ---- |
| Ghana | 22.40(1.26) | 15.05(4.32) | ---- |
Species:Dentex angolensis
WESTERN SIERRA LEONE (50–200 m)
| DEPTH (m) | 50 – 100 | 100 – 200 | TOTAL | |||
|---|---|---|---|---|---|---|
| LENGTH (cm) | No specimens | % | No specimens | % | No specimens | % |
| 1 | 0 | 0.00 | 0 | 0.00 | 0 | 0.00 |
| 2 | 0 | 0.00 | 0 | 0.00 | 0 | 0.00 |
| 3 | 0 | 0.00 | 0 | 0.00 | 0 | 0.00 |
| 4 | 0 | 0.00 | 0 | 0.00 | 0 | 0.00 |
| 5 | 0 | 0.00 | 0 | 0.00 | 0 | 0.00 |
| 6 | 0 | 0.00 | 0 | 0.00 | 0 | 0.00 |
| 7 | 8 | 1.16 | 0 | 0.00 | 8 | 0.70 |
| 8 | 7 | 1.00 | 0 | 0.00 | 7 | 0.61 |
| 9 | 62 | 8.80 | 0 | 0.00 | 62 | 5.42 |
| 10 | 270 | 38.44 | 0 | 0.00 | 270 | 23.62 |
| 11 | 7 | 1.00 | 0 | 0.00 | 7 | 0.61 |
| 12 | 0 | 0.00 | 0 | 0.00 | 0 | 0.00 |
| 13 | 40 | 5.68 | 0 | 0.00 | 40 | 3.50 |
| 14 | 33 | 4.53 | 12 | 2.69 | 45 | 3.94 |
| 15 | 45 | 6.22 | 24 | 5.55 | 69 | 6.04 |
| 16 | 58 | 8.28 | 12 | 2.69 | 70 | 6.12 |
| 17 | 49 | 6.81 | 91 | 21.09 | 140 | 12.25 |
| 18 | 18 | 2.54 | 81 | 18.57 | 99 | 8.66 |
| 19 | 30 | 4.20 | 87 | 19.92 | 117 | 10.24 |
| 20 | 27 | 3.74 | 69 | 15.71 | 96 | 8.40 |
| 21 | 30 | 4.34 | 15 | 3.45 | 45 | 3.94 |
| 22 | 11 | 1.65 | 21 | 4.79 | 32 | 2.80 |
| 23 | 5 | 0.67 | 24 | 5.55 | 29 | 2.54 |
| 24 | 6 | 0.84 | 0 | 0.00 | 6 | 0.52 |
| 25 | 1 | 0.17 | 0 | 0.00 | 1 | 0.09 |
| 26 | 0 | 0.00 | 0 | 0.00 | 0 | 0.00 |
| 27 | 0 | 0.00 | 0 | 0.00 | 0 | 0.00 |
| 28 | 0 | 0.00 | 0 | 0.00 | 0 | 0.00 |
| 29 | 0 | 0.00 | 0 | 0.00 | 0 | 0.00 |
| 30 | 0 | 0.00 | 0 | 0.00 | 0 | 0.00 |
| TOTAL SPECIMENS | 707 | 100 | 436 | 100 | 1143 | 100 |
| TOTAL WEIGHT (g) | 42285 | 70105 | 112390 | |||
Species: Dentex angolensis
EASTERN SIERRA LEONE (50–200 m)
| DEPTH (m) | 50 – 100 | 100 – 200 | TOTAL | |||
|---|---|---|---|---|---|---|
| LENGTH (cm) | No specimens | % | No specimens | % | No specimens | % |
| 1 | 0 | 0.00 | 0 | 0.00 | 0 | 0.00 |
| 2 | 0 | 0.00 | 0 | 0.00 | 0 | 0.00 |
| 3 | 0 | 0.00 | 0 | 0.00 | 0 | 0.00 |
| 4 | 0 | 0.00 | 0 | 0.00 | 0 | 0.00 |
| 5 | 0 | 0.00 | 0 | 0.00 | 0 | 0.00 |
| 6 | 0 | 0.00 | 0 | 0.00 | 0 | 0.00 |
| 7 | 0 | 0.00 | 0 | 0.00 | 0 | 0.00 |
| 8 | 0 | 0.00 | 0 | 0.00 | 0 | 0.00 |
| 9 | 10 | 1.08 | 0 | 0.00 | 10 | 0.70 |
| 10 | 125 | 13.44 | 0 | 0.00 | 126 | 8.75 |
| 11 | 35 | 3.76 | 0 | 0.00 | 35 | 2.45 |
| 12 | 20 | 2.15 | 8 | 2.00 | 28 | 1.96 |
| 13 | 30 | 3.23 | 25 | 5.00 | 55 | 3.83 |
| 14 | 60 | 6.45 | 41 | 8.00 | 102 | 7.07 |
| 15 | 60 | 6.45 | 56 | 11.00 | 117 | 8.16 |
| 16 | 65 | 6.99 | 71 | 14.00 | 137 | 9.54 |
| 17 | 95 | 10.22 | 62 | 13.00 | 158 | 10.99 |
| 18 | 150 | 16.13 | 37 | 7.00 | 188 | 13.09 |
| 19 | 80 | 8.60 | 46 | 9.00 | 127 | 8.84 |
| 20 | 50 | 5.38 | 42 | 8.00 | 93 | 6.46 |
| 21 | 75 | 8.06 | 28 | 6.00 | 104 | 7.25 |
| 22 | 55 | 5.91 | 40 | 8.00 | 96 | 6.65 |
| 23 | 15 | 1.61 | 28 | 6.00 | 43 | 3.06 |
| 24 | 5 | 0.54 | 8 | 2.00 | 13 | 0.96 |
| 25 | 0 | 0.00 | 1 | 0.20 | 1 | 0.07 |
| 26 | 0 | 0.00 | 0 | 0.00 | 0 | 0.00 |
| 27 | 0 | 0.00 | 3 | 1.00 | 3 | 0.21 |
| 28 | 0 | 0.00 | 0 | 0.00 | 0 | 0.00 |
| 29 | 0 | 0.00 | 0 | 0.00 | 0 | 0.00 |
| 30 | 0 | 0.00 | 0 | 0.00 | 0 | 0.00 |
| TOTAL SPECIMENS | 930 | 100 | 496 | 100 | 1436 | 100 |
| TOTAL WEIGHT (g) | 127450 | 68453 | 197303 | |||
Species:Dentex angolensis
LIBERIA (20–400 m)
| DEPTH (m) | 20–50 | 50–100 | 100–200 | 200–400 | TOTAL | |||||
|---|---|---|---|---|---|---|---|---|---|---|
| LENGTH (cm) | No specimens | % | No specimens | % | No specimens | % | No specimens | % | No specimens | % |
| 1 | 0 | 0.00 | 0 | 0.00 | 0 | 0.00 | 0 | 0.00 | 0 | 0.00 |
| 2 | 0 | 0.00 | 0 | 0.00 | 0 | 0.00 | 0 | 0.00 | 0 | 0.00 |
| 3 | 0 | 0.00 | 0 | 0.00 | 0 | 0.00 | 0 | 0.00 | 0 | 0.00 |
| 4 | 9 | 1.81 | 0 | 0.00 | 0 | 0.00 | 0 | 0.00 | 9 | 0.21 |
| 5 | 37 | 7.44 | 14 | 0.85 | 0 | 0.00 | 0 | 0.00 | 51 | 1.18 |
| 6 | 68 | 13.68 | 4 | 0.24 | 0 | 0.00 | 0 | 0.00 | 72 | 1.67 |
| 7 | 151 | 30.38 | 17 | 1.04 | 0 | 0.00 | 0 | 0.00 | 168 | 3.89 |
| 8 | 151 | 30.38 | 48 | 2.93 | 0 | 0.00 | 0 | 0.00 | 199 | 4.60 |
| 9 | 72 | 14.49 | 131 | 8.00 | 7 | 0.34 | 0 | 0.00 | 210 | 4.86 |
| 10 | 9 | 1.81 | 193 | 11.78 | 6 | 0.29 | 0 | 0.00 | 208 | 4.81 |
| 11 | 0 | 0.00 | 13 | 0.79 | 12 | 0.58 | 0 | 0.00 | 25 | 0.58 |
| 12 | 0 | 0.00 | 35 | 2.14 | 99 | 4.80 | 0 | 0.00 | 134 | 3.10 |
| 13 | 0 | 0.00 | 130 | 7.94 | 243 | 11.79 | 0 | 0.00 | 370 | 8.56 |
| 14 | 0 | 0.00 | 205 | 12.52 | 400 | 19.41 | 0 | 0.00 | 605 | 14.00 |
| 15 | 0 | 0.00 | 157 | 9.58 | 347 | 16.84 | 0 | 0.00 | 498 | 11.52 |
| 16 | 0 | 0.00 | 98 | 5.98 | 265 | 12.86 | 0 | 0.00 | 357 | 8.26 |
| 17 | 0 | 0.00 | 118 | 7.20 | 137 | 6.65 | 0 | 0.00 | 252 | 5.83 |
| 18 | 0 | 0.00 | 113 | 6.90 | 166 | 8.05 | 0 | 0.00 | 278 | 6.43 |
| 19 | 0 | 0.00 | 62 | 3.79 | 81 | 3.93 | 0 | 0.00 | 137 | 3.17 |
| 20 | 0 | 0.00 | 86 | 5.25 | 85 | 4.12 | 0 | 0.00 | 167 | 3.86 |
| 21 | 0 | 0.00 | 92 | 5.62 | 71 | 3.44 | 0 | 0.00 | 160 | 3.70 |
| 22 | 0 | 0.00 | 55 | 3.36 | 72 | 3.49 | 0 | 0.00 | 124 | 2.87 |
| 23 | 0 | 0.00 | 51 | 3.11 | 29 | 1.41 | 17 | 10.19 | 96 | 2.22 |
| 24 | 0 | 0.00 | 16 | 0.98 | 21 | 1.02 | 24 | 14.97 | 60 | 1.39 |
| 25 | 0 | 0.00 | 0 | 0.00 | 12 | 0.58 | 45 | 27.62 | 57 | 1.32 |
| 26 | 0 | 0.00 | 0 | 0.00 | 7 | 0.34 | 48 | 29.94 | 56 | 1.30 |
| 27 | 0 | 0.00 | 0 | 0.00 | 1 | 0.05 | 23 | 13.89 | 24 | 0.56 |
| 28 | 0 | 0.00 | 0 | 0.00 | 0 | 0.00 | 3 | 1.85 | 3 | 0.07 |
| 29 | 0 | 0.00 | 0 | 0.00 | 0 | 0.00 | 2 | 1.23 | 2 | 0.05 |
| 30 | 0 | 0.00 | 0 | 0.00 | 0 | 0.00 | 0 | 0.00 | 0 | 0.00 |
| TOTAL SPECIMENS | 497 | 100 | 1638 | 100 | 2061 | 100 | 162 | 100 | 4322 | 100 |
| TOTAL WEIGHT (g) | 5705 | 151784 | 206190 | 62460 | 426139 | |||||
Species: Dentex angolensis
CÓTE D'IVORE (20 – >100 m)
| DEPTH (m) | 20 – 50 | 50 – 100 | TOTAL | |||
|---|---|---|---|---|---|---|
| LENGTH (cm) | No specimens | % | No specimens | % | No specimens | % |
| 1 | 0 | 0.00 | 0 | 0.00 | 0 | 0.00 |
| 2 | 0 | 0.00 | 0 | 0.00 | 0 | 0.00 |
| 3 | 0 | 0.00 | 0 | 0.00 | 0 | 0.00 |
| 4 | 0 | 0.00 | 0 | 0.00 | 0 | 0.00 |
| 5 | 0 | 0.00 | 0 | 0.00 | 0 | 0.00 |
| 6 | 0 | 0.00 | 0 | 0.00 | 0 | 0.00 |
| 7 | 0 | 0.00 | 0 | 0.00 | 0 | 0.00 |
| 8 | 0 | 0.00 | 13 | 0.14 | 13 | 0.10 |
| 9 | 0 | 0.00 | 5 | 0.05 | 5 | 0.04 |
| 10 | 481 | 24.40 | 1039 | 10.84 | 1533 | 11.48 |
| 11 | 914 | 46.37 | 2036 | 21.25 | 3000 | 22.47 |
| 12 | 0 | 0.00 | 447 | 4.66 | 451 | 3.38 |
| 13 | 0 | 0.00 | 121 | 1.26 | 200 | 1.50 |
| 14 | 0 | 0.00 | 292 | 3.05 | 397 | 2.97 |
| 15 | 0 | 0.00 | 1158 | 12.09 | 1580 | 11.83 |
| 16 | 24 | 1.22 | 717 | 7.48 | 928 | 6.95 |
| 17 | 24 | 1.22 | 913 | 9.53 | 1022 | 7.65 |
| 18 | 0 | 0.00 | 849 | 8.86 | 1140 | 8.54 |
| 19 | 72 | 3.65 | 679 | 7.09 | 964 | 7.22 |
| 20 | 120 | 6.09 | 422 | 4.40 | 676 | 5.06 |
| 21 | 72 | 3.65 | 315 | 3.29 | 493 | 3.69 |
| 22 | 48 | 2.44 | 141 | 1.47 | 216 | 1.62 |
| 23 | 72 | 3.65 | 181 | 1.89 | 308 | 2.31 |
| 24 | 96 | 4.87 | 72 | 0.75 | 169 | 1.27 |
| 25 | 24 | 1.22 | 97 | 1.01 | 122 | 0.91 |
| 26 | 24 | 1.22 | 85 | 0.89 | 135 | 1.01 |
| 27 | 0 | 0.00 | 0 | 0.00 | 0 | 0.00 |
| 28 | 0 | 0.00 | 0 | 0.00 | 0 | 0.00 |
| 29 | 0 | 0.00 | 0 | 0.00 | 0 | 0.00 |
| 30 | 0 | 0.00 | 0 | 0.00 | 0 | 0.00 |
| TOTAL SPECIMENS | 1971 | 100 | 9582 | 100 | 13352 | 100 |
| TOTAL WEIGHT (g) | 168923 | 751276 | 927897 | |||
species: Dentex angolensis
GHANA (20 – >100 m)
| DEPTH (m) | 50 – 100 | 100 | TOTAL | |||
|---|---|---|---|---|---|---|
| LENGTH (cm) | No specimens | % | No specimens | % | No specimens | % |
| 1 | 0 | 0.00 | 0 | 0.00 | 0 | 0.00 |
| 2 | 0 | 0.00 | 0 | 0.00 | 0 | 0.00 |
| 3 | 0 | 0.00 | 0 | 0.00 | 0 | 0.00 |
| 4 | 0 | 0.00 | 0 | 0.00 | 0 | 0.00 |
| 5 | 0 | 0.00 | 0 | 0.00 | 0 | 0.00 |
| 6 | 0 | 0.00 | 0 | 0.00 | 0 | 0.00 |
| 7 | 20 | 2.15 | 0 | 0.00 | 20 | 1.60 |
| 8 | 8 | 0.94 | 0 | 0.00 | 8 | 0.70 |
| 9 | 169 | 18.99 | 20 | 5.26 | 189 | 15.45 |
| 10 | 336 | 37.64 | 38 | 10.51 | 374 | 30.65 |
| 11 | 135 | 15.12 | 0 | 0.00 | 135 | 11.21 |
| 12 | 0 | 0.00 | 0 | 0.00 | 0 | 0.00 |
| 13 | 6 | 0.67 | 0 | 0.00 | 6 | 0.50 |
| 14 | 48 | 5.39 | 20 | 5.26 | 68 | 5.36 |
| 15 | 67 | 7.56 | 78 | 21.02 | 145 | 11.06 |
| 16 | 28 | 3.10 | 78 | 21.02 | 106 | 7.75 |
| 17 | 6 | 0.67 | 20 | 5.26 | 26 | 1.86 |
| 18 | 0 | 0.00 | 0 | 0.00 | 0 | 0.00 |
| 19 | 28 | 3.23 | 20 | 5.26 | 48 | 3.76 |
| 20 | 0 | 0.00 | 20 | 5.26 | 20 | 1.36 |
| 21 | 6 | 0.67 | 38 | 10.51 | 44 | 3.22 |
| 22 | 21 | 2.48 | 40 | 10.51 | 61 | 4.57 |
| 23 | 0 | 0.00 | 0 | 0.00 | 0 | 0.00 |
| 24 | 13 | 1.34 | 0 | 0.00 | 13 | 0.99 |
| 25 | 0 | 0.00 | 0 | 0.00 | 0 | 0.00 |
| 26 | 0 | 0.00 | 0 | 0.00 | 0 | 0.00 |
| 27 | 0 | 0.00 | 0 | 0.00 | 0 | 0.00 |
| 28 | 0 | 0.00 | 0 | 0.00 | 0 | 0.00 |
| 29 | 0 | 0.00 | 0 | 0.00 | 0 | 0.00 |
| 30 | 0 | 0.00 | 0 | 0.00 | 0 | 0.00 |
| TOTAL SPECIMENS | 891 | 100 | 372 | 100 | 1263 | 100 |
| TOTAL WEIGHT (g) | 42578 | 42966 | 85644 | |||
Fig. 33. Dentex angolensis. Length distribution in Western Sierra Leone, Stratum B and C
Fig. 34. Dentex angolensis. Length distribution in Eastern Sierra Leone, Stratum B and C
Fig. 35. Dentex angolensis. Length distribution in Liberia, Stratum A and B
Fig. 36. Dentex angolensis. Length distribution in Liberia, Stratum C and D
Fig. 37. Dentex angolensis. Length distribution in Côte d'Ivoire, Stratum A and B
Fig. 38. Dentex angolensis. Length distribution in Ghana, Stratum B and C
Fig. 39 Length distribution in Western and Eastern Sierra Leone,
Fig. 40. Dentex angolensis. Length distribution in Liberia and Côte d'Ivoire
Fig. 41. Dentex angolensis. Length distribution in Ghana
![]()
![]()
![]()