GEOGRAPHY, POPULATION AND WATER RESOURCES
The Gambia is the smallest country on the African continent, with an area of 11 300 km² of which about 20% is considered as wetland. The cultivable land area is estimated at about 430 000 ha, which is 38% of the total area. The cultivated area was 195 543 ha in 1991, or 45% of the cultivable area and 17% of the total area.
The total population is about 1 million (1994), of which about 75% is rural. The average population density is 96/km², but ranges from 40 to more than 130/km² (excluding Banjul, the capital). The Gambia has one of the highest population growth rates in the world: 4.1 % per year.
TABLE 1
Basic statistics and population
| Area of the country | 1994 | 1 130 000 ha |
| Cultivable land | 1992 | 430 000 ha |
| Cultivated land | 1991 | 195 543 ha |
| Total population | 1994 | 1 081 000 inhab. |
| Population density | 1994 | 96 inhab./km² |
| Rural population | 1993 | 75 % |
| Water supply coverage | ||
| Urban population | 1992 | 97 % |
| Rural population | 1992 | 50 % |
Agriculture accounts for 25% of GDP and employs 60% of the households.
Climate and water resources
The country lies in the Sahelian agroclimatic zone and has a long dry season between November and May. Average daily temperature is 30°C in the dry season and 27°C in the wet season. The average annual rainfall is 961 mm. There has been a steady decline in rainfall from 1875 onwards, which still continues and which is causing increased salinity in the lowlands and increased aridity in the uplands.
The country is almost completely included in the basin of River Gambia, which discharges 8 km³ yearly into the ocean. At the border with Senegal, the river has an annual discharge estimated at about 5 km³ Because of the flat topography there is a pronounced marine influence: in the dry season the salt tongue moves as far as 250 km upstream. The seasonality and salinity have important repercussions on land use.
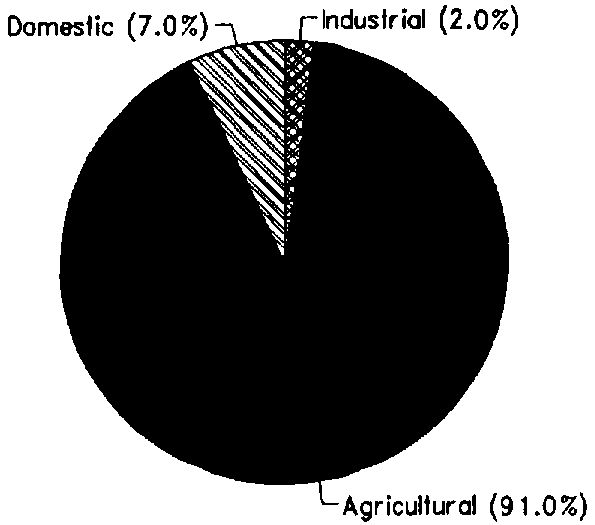
In 1982, water withdrawal was 0.020 km³ (Figure 1). Of this, 0.018 km³ was agricultural water withdrawal, but this figure probably covers only the full or partial control irrigation schemes (1 670 ha).
TABLE 2
Water balance
| Water resources: | |||
| Average precipitation | 961 | mm/yr | |
| 10.9 | km³/yr | ||
| Internal renewable water resources - total | 3 | km³/yr | |
| Internal renewable water resources - per caput | 1994 | 2 775 | m³/yr |
| Global renewable water resources | 8 | km³/yr | |
| Dependency ratio | 62.5 | % | |
| Total dam capacity | - | km³ | |
| De-salinated water | - | 10 6 m³/yr | |
| Water withdrawal: | |||
| - Agricultural | 1982 | 18.2 | 10 6 m³/yr |
| - Domestic | 1982 | 1 4 | 10 6 m³/yr |
| - Industrial | 1982 | 0.4 | 10 6 m³/yr |
| Total | 20 | 10 6 m³/yr | |
| per caput | 29 | m³/yr | |
| as a % of internal renewable water resources | 0.7 | % | |
| Other withdrawal | - | 10 6 m³/yr | |
| Wastewater: | |||
| Produced | - | 10 6 m³/yr | |
| Treated | - | 10 6 m³/yr | |
| Re-used treated wastewater | - | 10 6 m³/yr |
TABLE 3
Irrigation and drainage
| Irrigation potential | 1984 | 80 000 | ha |
| Irrigation: | |||
| 1. Full or partial control Irrigation: equipped area | 1991 | 1 670 | ha |
| - surface irrigation | 1991 | 1 670 | ha |
| - sprinkler irrigation | 1991 | 0 | ha |
| - micro-irrigation | 1991 | 0 | ha |
| % of area irrigated from groundwater | - | % | |
| % of area irrigated from surface water | - | % | |
| % of equipped area actually irrigated | 1991 | 65 | % |
| 2. Spate irrigation area | - | ha | |
| 3. Equipped wetland and inland valley bottoms | - | ha | |
| 4. Other cultivated wetland and inland valley bottoms | 1991 | 13 170 | ha |
| 5. Flood recession cropping area | - | ha | |
| Total water managed area (1+2+3+4+5) | 1991 | 14 840 | ha |
| - as a % of cultivated area | 1991 | 7.6 | % |
| - increase over last 10 years | - | % | |
| - power irrigated area as % of water managed area | - | % | |
| Full or partial control schemes: | Criteria | ||
| Large schemes | > - ha | - | ha |
| Medium schemes | - | ha | |
| Small schemes | < - ha | - | ha |
| Total number of households in irrigation | |||
| Irrigated crops: | |||
| Total irrigated grain production | 1991 | 18 254 | t |
| as a % of total grain production | 1991 | 19.6 | % |
| Harvested crops under irrigation | 1991 | 11 277 | ha |
| - rice | 1991 | 11 277 | ha |
| Drainage - Environment: | |||
| Drained area | - | ha | |
| as a % of cultivated area | - | % | |
| Flood-protected area | - | ha | |
| Area salinized by irrigation | - | ha |
IRRIGATION DEVELOPMENT
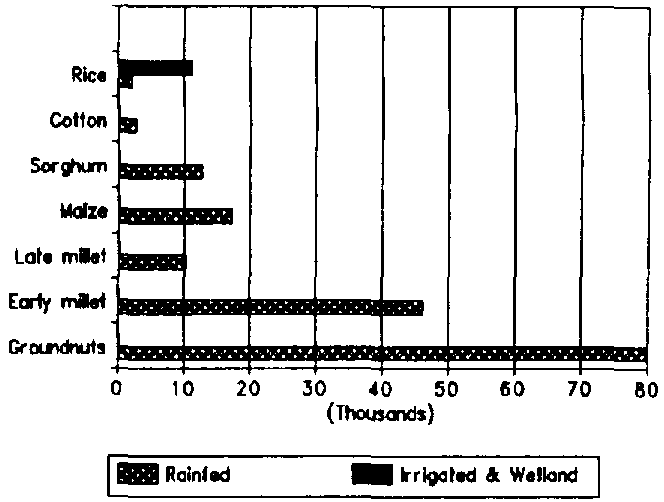
The area harvested annually is about 180 000 ha, or some 40% of the country's cultivable land. The major crops grown are groundnut, millet, sorghum, maize and rice. Minor crops include cotton and vegetables (Figure 2). Nearly all of it is rainfed. Only about 1500 ha is under pump irrigation, although rice is also grown on some additional 10 000 to 15 000 ha of mangrove swamps and freshwater swamps (Figure 3). In the mangrove area, rice is grown from August to January by constructing simple protection dikes.
To avoid an increase in salinity, the safe limit for irrigation from the river Gambia, without major dam construction, was estimated to be a maximum of 2 400 ha in the dry season. The lower and lower central river sections (up to Carrol's Wharf) contain considerable areas of actual and potential acid sulphate soils.
INSTITUTIONAL ENVIRONMENT
Policy guidance and technical support for agriculture is provided by the Ministry of Agriculture (MOA) through a Central Management Unit and four main Departments.
The Department of Agricultural Services (DAS) is responsible for Agricultural Extension Services, the Soil and Water Management Unit (SWMU), the Crop Protection Service, the Food and Nutrition Unit, and the Agricultural Communications Unit. SWMU is in charge of developing policies on soil and water management, land capability zoning, upland conservation and development of small-scale water control schemes in lowland rice ecologies. It is divided into five sections, of which the Engineering Section is involved in irrigation development.
FIGURE 1: Water withdrawal (total: 0.02 km³ in 1982)
FIGURE 2: Area (ha) of harvested irrigated and rainfed crops (1991)
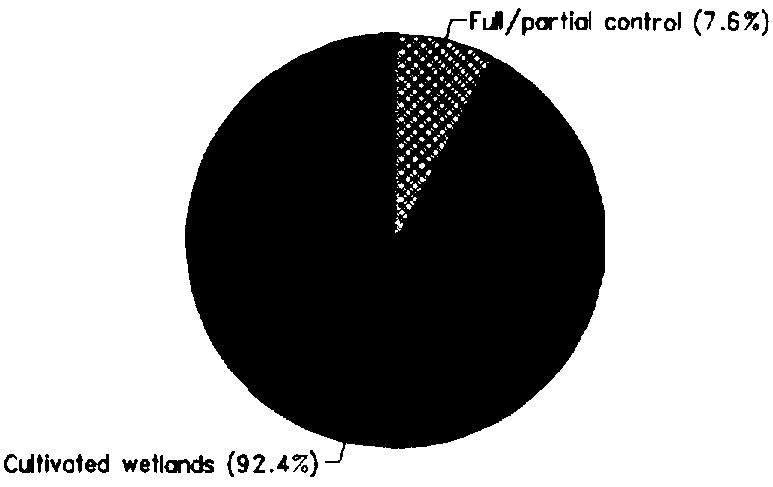
FIGURE 3: Distribution of the water managed areas (1991)
The Department of Water Resources (DOOR) of the Ministry of Natural Resources and Environment (MNR&E) liaises closely with SWMU.
TRENDS IN WATER RESOURCES MANAGEMENT
Rice is traditionally cultivated, primarily in the lowlands, as a subsistence crop. As a consequence of rapid population growth, demand greatly exceeds local production and the country is currently importing large quantities of rice to meet its domestic requirements.
National policies give high priority to increased rice production using technologies which are environmentally sound and sustainable without subsidies. Government also gives high priority to food security and poverty alleviation within the context of sustainable development.
According to a recent IFAD and FAO Investment Centre mission, rice could be produced in a competitive way if it focuses on the appropriate ecology and adopts a simple and sustainable technology. It proposed a 20-year Lowlands Agricultural Development Programme (LADEP) covering traditional rice ecologies throughout The Gambia.
MAIN SOURCES OF INFORMATION
Central Statistics Department, Ministry of Finance and Economic Affairs. 1993. Statistical Abstract of The Gambia 1992.
Department of Planning, Ministry of Agriculture. 1991. Statistical Yearbook of Gambian Agriculture 1990.
FAO. 1982. The Gambia: Water Resources Development in the Framework of the National
Food Plan. Report prepared by P. Pallas and S. N'Guiamba for FAO Technical Cooperation Programme project TCP/GAM/0104. Rome.
FAO. 1984. Agricultural Research in The Gambia River Basin. Rome.
FAO. 1994. The Gambia: Lowlands Agricultural Development Programme. FAO Investment
Centre/IFAD Cooperation Programme report N° 52/94 IFAD-GAM 15. Rome.