![]()
![]()
![]()
3.1 International context
3.2 Present Status - Regional and national energy data
3.3 Classification
3.4 Trends of energy demand in agriculture
References
Appendix 1: Sectoral energy consumption for selected countries 1990 (TJ)
Appendix 2: Commercial energy and food production
Appendix 3: Energy consumption in 10 Southern African countries that comprise SADC (1990)
Appendix 4: Energy consumption in Africa
Africa is endowed with abundant and wide range of energy resources. The region's renewable energy potential include a wealth of biomass, solar and wind resources (Musa, 1993). In addition, the region has over 1.1 million GWh of exploitable hydro capacity (Johansson, et al, 1993); over 9,000 MW of geothermal potential; 59 billion barrels of petroleum; 8 billion cubic meters of natural gas reserves and, over 60 billion tons of coal (Musa, 1993; British Petroleum Company, 1991; World Resources Institute, 1994a). For example, the known exploitable hydroelectric potential in Zaire is equivalent to over 5 times the installed capacity in USA (World Resources Institute, 1994b).
In 1991, per capita consumption of modem energy in Africa was estimated to be 12 GJ which is less than half that of South-America and less than one tenth that of Europe (World Resources Institute, 1994c). In spite of abundant energy resources, available estimates of Africa's energy use indicate limited use of modem energy resources especially in the agricultural sector which accounts for a large proportion of the region's GDP.
For the foreseeable future, heavy dependence on agriculture is likely to continue being the norm rather than the exception for most of sub-Saharan Africa. Exceptions to this rule would include countries that are largely dependent on mining and oil exports such as Botswana, Cameroon, Congo, Nigeria, South Africa, Zambia and Zimbabwe. In 1970, agriculture accounted for 35 percent of sub-Saharan Africa's GDP. In Latin America and the Caribbean, the equivalent figure was 13 percent. By 1991, agriculture still accounted for over a third of sub-Saharan Africa's GDP (World Bank, 1993a).
North African countries, however, registered a gradual shift away from the heavy dependence on agriculture. The contribution of agriculture to Egypt's GDP fell from 29 percent to 18 percent between 1970 and 1991 while that of Tunisia reduced from 20 percent to 18 percent over the same period. It is interesting to note that over the same period both Egypt and Tunisia registered a two-fold increase in per capita consumption of modem energy.
For those countries that will continue to depend on agriculture, the continued low consumption of modem energy is a source of concern. It could be an indication that the agricultural sector is not gaining access to adequate levels of high-grade energy services. In 1989, sub-Saharan Africa consumed an estimated 26 million tons of petroleum fuels which was almost half that consumed by North African countries (World Bank, 1992a).
The availability of modem energy such as petroleum fuels have proven to be essential to increasing the productivity of the agricultural sector in more developed parts of the world. In many other parts of the developing world, increases in agricultural productivity have been accompanied by rapid increases in modem energy particularly oil consumption (Desai et al, 1986a). This is, in part, demonstrated by what appears to be a correlation between high per capita modem energy and food production (Fig 2).
Fig 1: Modern Energy Consumption
Source: World Resources Institute, 1994
As shown in the previous graph, this correlation is especially strong in the South where increased per capita consumption of modem energy appears to be closely linked to higher per capita daily calorie supply. In some respects, this relationship should be expected because of the substantial role of agriculture and food production in the economies of developing countries. Consequently, higher inputs of high grade modem energy is likely to have a positive impact on agricultural output and food production levels.
The link does not appear to hold for developed regions where per capita consumption of modem energy exceeds 2,000 kgoe. For example, per capita modem energy consumption of OECD countries is almost double the average for Europe (which includes economies in transition), but daily calorie supply is actually lower in OECD countries. This could be a demonstration that food production is no longer a major problem in developed countries. Food production levels are near or above required levels and fluctuations in quantity of food production may be attributed to changes in diet (such as preference for more exotic imported food products) rather than increased supply of modem energy.
In developed economies, agriculture generally accounts for a small share of total national energy consumption. Industry, transport and household space conditioning account for the bulk of energy use in developed economies.
Even within the African region, the close link between commercial energy production and daily per capita calorie supply appears to be especially strong at energy consumptions levels below 500 kgoe per capita commercial energy use. For countries with higher per capita consumption of modem energy, the link is tenuous, an indication that there may be other important causal factors such as high use of fossil fuels for countries well endowed with hydrocarbons or abundance of coal resources combined with inequitable distribution of energy resources as in the case of South Africa.
The aforementioned correlation between agricultural productivity and food production should be treated with some caution because of the aggregated nature of the data used in the analysis. This kind of data often fail to discern many of the complexities and characteristics associated with the agricultural sector (Desai et al, 1986a). A more desegregated approach attempted in forthcoming chapters of this report reveal a more differentiated realistic assessment of energy use in the agricultural sector.
The majority of African countries, however, have on average very low per capita consumption of modern energy and low calorie supply levels. This is especially true of sub-Saharan Africa where in 1986, per capita energy consumption was estimated to be 105 kgs of oil equivalent of commercial energy (World Bank, 1989). This was less than half the corresponding figure for all developing countries (301 kgs). In 1990, the situation had not changed significantly. Average per capita consumption of modern energy had reduced to 103 kg which was about half that of South Asia and a fifth of East Asia and the Pacific (World Bank, 1992b). Although per capita consumption of energy increased in 1991 to 135 kgoe, this was still less than half that of South-Asia estimated to be 289 kgoe (World Bank, 1993).
Fig 2: Modern Energy Consumption and Food Production
In 1990, the per capita consumption of modern energy for 21 African countries was less than 100 kgoe (World Bank, 1992b). In many of these countries, daily per capita calorie supply is below 2,000 calories and the average index of food production per capita is below that of 1979-81 (Table 1). In these countries, access to modem energy services is very low and is likely to be contributing to low food production volumes. Food production is unlikely to grow without greater access to modem energy.
With the exception of North Africa and South Africa, the bulk of the energy needs of the region is met by traditional fuels mainly in the form of biomass. Estimates of the World Energy Council (1992), which are based on energy statistics collected by the United Nations, reckon that in 1990, total primary energy demand for sub-Saharan Africa (including the Republic of South Africa) was about 267 Mtoe of which 53 percent was traditional fuels (largely composed of unprocessed biomass) followed by oil (26 %), solid fuels (24 %), hydro (3 %) and gas (2 %).
The share of biomass increases to about 80% if the Republic of South Africa is excluded. Using statistics from the OECD and FAO, Davidson (1992) estimated that in 1988, total energy consumption of the region was about 4,388 PJ of which biomass accounted for 72 percent with the balance composed of oil (22%), hydro (4%) and coal (2%). A significant proportion of the biomass used in both the household and agricultural sectors is collected and consumed outside the market economy which complicates attempts to obtain reliable data (Hall and Mao, 1994).
Table 1: AGRICULTURE PRODUCTION INDICES
|
YEAR |
AFRICA |
FAR EAST |
L. AMER |
N. EAST |
DEVELOPING COUNTRIES |
|
1979 |
98 |
96 |
97 |
96 |
97 |
|
1980 |
100 |
99 |
99 |
101 |
99 |
|
1981 |
102 |
104 |
105 |
103 |
104 |
|
1982 |
105 |
109 |
105 |
107 |
107 |
|
1983 |
104 |
116 |
105 |
107 |
111 |
|
1984 |
105 |
122 |
108 |
107 |
116 |
|
1985 |
114 |
125 |
113 |
114 |
120 |
|
1986 |
120 |
127 |
111 |
119 |
122 |
|
1987 |
118 |
130 |
116 |
119 |
125 |
|
1988 |
126 |
137 |
121 |
125 |
131 |
|
1989 |
131 |
143 |
124 |
118 |
135 |
|
1990 |
132 |
149 |
124 |
130 |
140 |
|
1991 |
138 |
154 |
126 |
130 |
144 |
|
1992 |
134 |
157 |
128 |
136 |
146 |
Fig 3: BIOMASS ENERGY CONSUMPTION IN SUB-SAHARAN AFRICA (1990)
One of the difficulties associated with the collection of data on African agriculture is the prevailing categories of energy demand and supply data collection. Much of the available data usually covers only sub-Saharan Africa excluding South Africa and North African countries. Algeria, Morocco, Egypt, Tunisia and Libya are generally lumped together with the Middle East. This can convey an incorrect impression of the continent's energy sector. For example, North African countries accounted for over two-thirds of Africa's consumption of liquid fuels in 1989 (World Bank, 1992a) and in 1991, close to half the continent's total installed electricity generation capacity was in South Africa (United Nations, 1993a and ESKOM, 1993). The omission of these countries from the energy supply and demand figures of Africa would impart a partial perspective. It is, therefore, essential to qualify and closely examine existing regional data to draw more accurate assessments of the continent's energy sector.
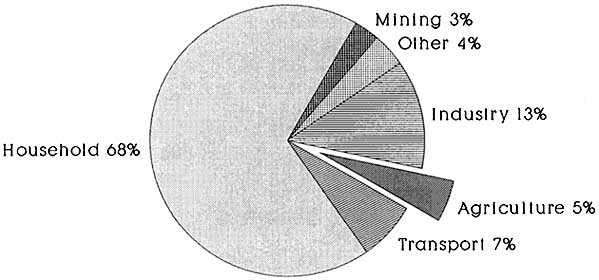
Although accounting for about a sixth of the region's population, the economic and energy characteristics of the 10 member countries of the Southern African Development Community (Angola, Botswana, Malawi, Namibia, Mozambique, Lesotho, Tanzania, Swaziland, Zambia, Zimbabwe) are representative of much of southern Africa with the exception of South Africa. This region is, in some respects, similar to eastern Africa and parts of western Africa. Consequently, the energy consumption of SADC shown in Fig 4 provides, under the circumstances, some useful insights on the major energy demand sectors of Africa (see Appendix III for detailed data).
For the 10 countries of southern Africa, energy used in agriculture accounts for only 5 percent of total energy consumption. This is rather low considering that agriculture dominates the economy of Tanzania which has the largest population in this region (25 million in mid-1991). In 1991, agriculture accounted for 61 percent of Tanzania's GDP (World Bank, 1993).
Biomass (60 %), oil products (17 %) and coal (16 %) are the main sources of energy for the agricultural sector. The bulk of the biomass is used to provide heat for agricultural processing. Petroleum products are used to drive both motive power and stationery processing machinery. Transport is almost entirely fuelled by oil products (Rutabanzibwa, 1989) with small contributions from coal, electricity and ethanol. The SADC region includes two of the three African countries (Kenya, Malawi and Zimbabwe) with ethanol programmes.
Fig 4: Energy Consumption in 10 southern African Countries (1990)
Source: SADC, 1992; Guilherme, 1992
A significant proportion of energy used in the transport sector is linked to the distribution and marketing of agricultural products. This is, however, difficult to discern in existing energy tables that tend to be presented in a highly aggregated format. In contrast to other parts of Africa, the SADC region is well endowed with coal resources. Botswana, South Africa and Zimbabwe possess some of the most developed coal industries in the continent. A more representative sample of eight (8) African countries compiled by the authors provides a somewhat different picture (Appendix I). The sample includes Botswana, Ethiopia, Kenya, Morocco, South Africa, Sudan, Tanzania and Zimbabwe. It covers North African, West Africa, Eastern African and Southern African countries. The only region that is not represented in this sample is Central Africa. As with the SADC region, this sample of countries indicate that agriculture accounts for just over 4% of total energy consumption (figure 6).
Available data on agriculture has major shortcomings but it also highlights the complex nature of energy use in agriculture. Regional aggregates, such as those discussed in the preceding sections, tend to underestimate the energy used in agriculture because of several reasons. Firstly, many energy-intensive agro-processing industries such as coffee drying, tobacco curing and sugar manufacture are often grouped together under energy use in industry. Similarly, transport of agricultural produce is sometimes not included as part of energy consumption in the agricultural sector. Using data from Tanzania and Zimbabwe, an attempt was made to estimate the share of energy used in agriculture-related transport activities. The result of this analysis are shown in Table 3 which indicates that agriculture accounts 13% of total energy consumption is three times higher than estimates shown in official figures of energy use in agriculture (see Appendix IV for detailed data).
Another important source of error is the under-estimation of biomass use in agriculture especially in the small-holder sub-sector which is poorly covered in official statistics. Examples include biomass used for coffee drying and tobacco curing.
Fig 5: Main Fuels Used in Agriculture in 10 Selected African Countries (1990)
Source: United Nations, 1992
Fig 6: Energy Consumption in Africa 1990
The analysis of the agricultural sector presents energy analysts with major challenges. Energy supply, transformation and use in agriculture are of a very dispersed nature, with numerous sources, end-uses and transformation technologies. In addition, many of these activities are seasonal thus diminishing the reliability of existing energy survey data which rarely covers the entire agricultural seasonal cycle. There are no simple categories that one can use to establish an analytical framework for assessment of energy supply and demand in agriculture. This complicates attempts at analyzing energy use in agriculture as well as constraints attempts to make sound projections.
As mentioned earlier, there are a number of factors that complicates evaluation of energy supply and consumption in agriculture. Key among these factors is the question of whether energy used in agro-processing activities and related industries should be incorporated under the category of agriculture. Another important factor is the extent to which fuels used in the transportation should be included in agricultural energy data. Available energy data and documentation shows no consensus on the extent to which related industrial and transportation activities should be counted as part of energy use in agriculture.
In Africa, the problems of collecting and assessing energy data on agriculture are compounded by the very limited information on the perennial tuber agriculture which predominates in wet Africa and seasonal coarse grain agriculture which is important in arid Africa. Biomass and animate energy are two of the most predominant sources of energy in both these agricultural systems.
Biomass fuels have the added complication of being used in both agriculture and household sectors. For example, in Lesotho, crop residues and animal dung, by-products of agriculture and livestock-related activities, meet a significant proportion of household energy needs (Ministry of Water, Energy and Mining, 1988; SADC, 1992). The link between energy use in the household and agricultural sectors can be very close particularly in the small-holders sub-sector which dominates much of African agriculture. Separation of biomass used in agriculture from that used in households appear to be only possible with respect to large-scale centralized farming sector found in countries with large commercial farming sub-sectors such as Côte d'Ivoire Kenya, South Africa and Zimbabwe.
Mechanized agriculture and modem irrigation techniques are still largely under-developed in the continent. Mechanized include the use of tractors and other equipment for land preparation, planting, cultivation and harvesting. Generally, mechanisation has the following two main objectives:
(i) to increase the productivity of agricultural labour by performing agricultural tasks in the shortest possible time and overcome bottlenecks in critical operations; and,(ii) to improve the quality of agricultural work and minimize drudgery.
In 1991, the stock of tractors in Africa was estimated to be about 550,000 (World Resources, 1994b). Over half of the tractors were in three countries, Algeria, Egypt and South Africa. Latin America with under half the population of Africa had over 1,125,000 tractors. Africa has a tractor for every 387 agro-workers versus 36 in South America and a tractor for every 333 hectares versus 102 hectares in South America (World Resources, 1994).
A similar picture emerges with respect to harvesters. The total in Africa was estimated to be just under 70,000 in 1991 with South Africa accounting for over half the stock. This translate1 to about 2,600 hectares of cropland per harvester.
Irrigation is still an embryonic practise in Africa. In 1991, it was estimated that only 6 percent of the continent's cropland is irrigated. In contrast, about a third of Asia's cropland is irrigated. In South-America, irrigation is also not widely practised but the proportion at 8 percent is still higher than Africa (World Resources Institute, 1994).
Limited use of mechanized agricultural practices in Africa means that animate energy (inclusive of human power) continues to be an important source of power for agricultural activities in the continent. Consequently, studies of animate energy and its limitation are critical to gaining an in-depth appreciation of energy supply and use in African agriculture.
Energy studies of agriculture in South America and Asia tend to concentrate on tractor use and irrigation, respectively. Because of limited use of tractors and irrigation, the methodological techniques developed in South America and Asia are unlikely to be relevant to the current situation in the agricultural sector of Africa. These techniques are, however, useful for future projections because increased mechanization and irrigation are expected to occur in Africa. For example, the number of tractors in Africa increased by 21 percent in the last 10 years which compares well with an increase of 23 percent in Latin America over the same period (World Resources Institute, 1994).
Animate energy is crucially important to energy supply and consumption in the agriculture sector of Africa but it is bedeviled by theoretical and empirical constraints. Attempts to overcome this gap have been tried through estimates of employment and use of animals; tune inputs; and, energy value of food intake. All these methods have faced severe conceptual and empirical constraints (Desai et al, 1986b). One of the useful indicators of animate energy use in agriculture is the active fanning population.
Table 2 SELECTED INDICATORS ON AGRICULTURAL MECHANIZATION
|
|
AFRICA |
S. AMER |
EUROPE |
WORLD |
|
Pop. millions (1990) |
643 |
294 |
509 |
5295 |
|
% Pop. 15-65 (av. '75 & '95) |
52 |
59 |
65 |
60 |
|
% Labour force in agric '90 |
63 |
23 |
9 |
47 |
|
Agric. labour force millions |
211 |
40 |
30 |
1481 |
|
Cropland '000 hect '91 |
181,620 |
115,222 |
138,024 |
1441573 |
|
Tractors |
544,757 |
1,125,596 |
10,384,879 |
26,411,984 |
|
Agro-workers per tractor |
387 |
36 |
3 |
56 |
|
Hectares per tractor |
333 |
102 |
13 |
55 |
|
Harvesters |
69,882 |
117,620 |
831,233 |
3,956,306 |
|
Agro-workers per harvester |
3,019 |
340 |
36 |
374 |
|
Hectares per harvester |
2,599 |
980 |
166 |
364 |
Source: World Resources Institute, 1994
Another important analytical issue that needs to be addressed is the extent to which the energy used in the manufacture of fertilizers and pesticides should be considered. From a purely energy systems view, incorporation of energy used in the manufacture of fertilizers implies a much broader life-cycle approach that would go beyond national boundaries. On the other hand, fertilizers and pesticides are two of the most critical inputs to agriculture which, have in the past, proven crucial to increasing productivity. In recent years, especially in Europe and North America, diminishing returns from increased use of fertilizers and pesticides have raised questions about their role in the transition towards more environmentally-sound agricultural practices.
As with mechanization and irrigation, the very low use of fertilizer and pesticides in Africa would suggest that the sustainability question is not yet a pressing issue in the continent. In 1991, about 20 kgs of fertilizer for every hectare of cropland were used in Africa which was less than half that of South America - 44 kgs per hectare (World Resources Institute, 1994).
Of more critical concern to the continent is the growing unsustainability of traditional farming practices such as shifting agriculture. Rapid population growth and a rapidly evolving land tenure environment have begun to constrain traditional agricultural practices such shifting agriculture. For example, the increased deployment of intensive traditional farming techniques (suitable for high potential areas where they evolved) in marginal land unsuitable for intensive farming is now a major source of concern for agricultural planners.
In analyzing energy use in African agriculture, it is important to appreciate the coexistence of very different agricultural systems. This is particularly true of southern Africa and parts of eastern and western Africa were subsistence small-holding agriculture co-exist with commercial large-scale farming. Similar, there are major differences between farming for domestic markets and for export markets. It is also important to distinguish between multiple-cropping farming systems and mono-culture farming systems and to appreciate the unique characteristics associated with extensive farming which is distinct from intensive farming practice (Girod, 1991). Energy use in each of these farming systems significantly differs. In addition, existing analysis rarely takes into account the critical role of solar energy in agriculture (Desai et al, 1986a).
Another complication is whether one should include fisheries and livestock. Although these sectors could, in strict definitional terms, be excluded from the agricultural sector, in reality, separation of livestock and fisheries from agriculture is fraught with difficulties. For example, agriculture and livestock activities are often undertaken on the same piece of land. Similarly, fishing can be an important additional source of income for farmers. In many African countries, central Government Ministries in charge of agriculture are often given the responsibility of overseeing fisheries and livestock sub-sectors.
Consequently, in this report, energy use in the fisheries and livestock sub-sectors will be addressed but because even less is known about the use of energy in these sub-sectors, discussion will be mainly of a qualitative nature with limited use of empirical analytical tools. At a continental level, useful indicators of the livestock sectors include number of cattle, sheep, goats, pigs, buffaloes, camels and chickens. In addition, there is aggregate continental information on the percentage of total grain production that is fed to livestock. For the fisheries sector, use can be made of the contribution of fish products to daily supply of protein.
An analytical structure of energy use that appears to be equally applicable to agriculture, fisheries and livestock is one that differentiates direct and indirect inputs of energy (Desai et al, 1986a). In agriculture, direct energy inputs can be further subdivided into mobile and stationery energy inputs. Mobile energy inputs in agriculture are required during the following activities:
- Soil preparation.
- Sowing.
- Weeding.
- Application of manure, fertilizers and pesticides.
- Harvesting.
- Threshing.
- Transport of harvested crops.
On the other hand stationery inputs are mainly linked to post-harvest operations such as drying, cooling and milling. Indirect energy inputs in agriculture are used for the following activities:
- Provision of water.
- Manufacture of fertilizer.
- Production of pesticides.
Fig 7: Agric, Fisheries & Livestock Energy supply and demand categories
Fig 8: Agriculture Direct energy inputs and end-uses
The direct and indirect input approach with sub-divisions of mobile and stationery inputs is also applicable to the fisheries sub-sector. Direct inputs in fisheries can be subdivided into mobile and stationery inputs. Mobile energy inputs are used in motorized boats or canoes; fishing; and, transportation. Parameters for assessing mobile energy inputs would include (Girod, 1991):
- Number of boats or canoes.
- Total tonnage or capacity.
- Catch tonnage for deep sea fishing, coastal fishing or river fishing.
- Unit energy consumption by tonne of fish caught.
Direct energy inputs that are of a stationery nature are mainly linked to fish treatment and preservations. Energy-related parameters for assessing these inputs include capacity of fish treatment and preservation facilities; and, unit energy consumption by tonne of treated fish (dried or smoked). Indirect inputs in fisheries include energy used in the provision of water which is particularly important for aqua-culture.
Similarly, energy use in the livestock sub-sector can be subdivided between direct and indirect inputs. Direct inputs include energy used in milking equipment and transportation of milk and livestock. Indirect energy inputs are associated with processing of milk, meat, hides and skins.
Fig 9: Fisheries Energy supply and use
Fig 10: Livestock Energy supply and use
The use of energy in the agricultural sector has not been extensively studied which complicates any attempts to project future energy demand of agriculture in Africa. One of the few studies that involved an extensive energy analysis of the agricultural sector was the Zimbabwe Energy Accounting Project (ZEAP), a joint project of the former Beijer Institute of the Royal Swedish Academy of Sciences (now Stockholm Environment Institute) and the former Ministry of Energy Resources and Development of the Government of Zimbabwe (now Ministry of Transport and Energy). More in-depth information on the findings of the ZEAP initiative is provided in the case study chapter of this study. In conjunction with data from other African countries, projections of future energy demand in the agricultural sector generated by the ZEAP study is partially used to estimate desegregated demand-side data for agriculture in Africa.
To encompass the diversity of energy use in the agricultural sector in Africa, sectoral energy consumption of eight representative countries, whose combined population makes up approximately a third of Africa's population, was analyzed (Appendix I). The bulk of the agriculture energy data in the national energy balances excludes agro-processing and ag-transport which are often lumped together with the industrial and transport sectors, respectively. To overcome this shortfall in the available data, the Tanzanian and Zimbabwean case studies was used to estimate the energy consumption attributed to agro-processing and agriculture-related transport activities. Therefore, Tanzania and Zimbabwe's pattern of energy use was considered representative of Africa's average because their energy consumption provide scenarios of typical traditional agriculture and large-scale commercial agriculture respectively. This is representative of the high energy consumers (mainly South Africa and North Africa) and the low energy consumers (the rest of sub-Saharan Africa).
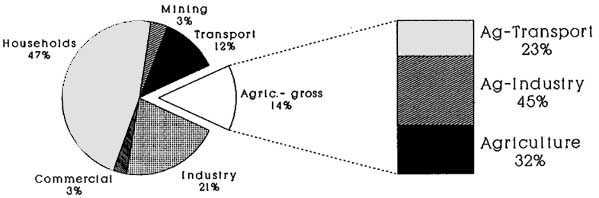
The percentage consumption of various sectors in Africa (Table 3) was estimated to be:
Table 3: Demand-side Sectoral
Distribution of Energy Consumption in Africa
|
Households |
45% |
|
Industry |
21% |
|
Transport |
14% |
|
Agriculture |
13% |
|
Mining |
4% |
|
Commerce and others |
3% |
As shown in figure 11 (and Appendix IV), the bulk of the energy-use in agriculture is used in agro-processing (45%) followed by on-farm agricultural activities (32%) and agriculture-related transport accounting for only 23%.
Fig 11: Africa's Sectoral Energy Distribution 1990
Assuming population growth to be the major driving factor to energy consumption, the analysis estimated total energy consumption in Africa to be 13 million TJ. To crosscheck, the same methodology was applied to the 10 southern African countries that used to constitute SADC (excluding the Republic of South Africa) estimates of energy use. The SADC estimate yields a total of 12 million TJ for the whole of Africa which is within the range of the first estimate. The World Energy Council (1992) estimated energy consumption for Africa is 11 million TJ which is again within the range of the above two estimates. An average of the three estimates was, therefore, used.
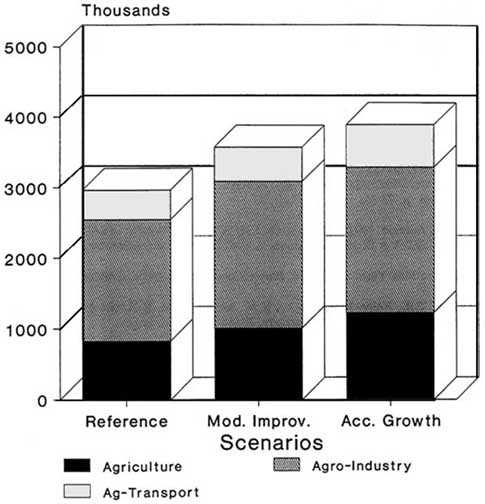
Partially based on the pattern of agricultural energy use in Tanzania and Zimbabwe, the following three scenarios were used to analyse energy use in Africa's agriculture (additional information on the three scenarios is provided in the case studies chapter):
1. Reference ScenarioThis scenario assumes continuation of past trends in energy use in Africa's agriculture with an average growth rate of about 2% per annum. The scenario, therefore, depicts the current minimal utilisation of energy in the agricultural sector which results in relatively stagnant agricultural growth rates, modest increments in yields and thus continued food imports.
2. Moderate Improvement
This scenario depicts a situation of substantial increases in agricultural energy use resulting in moderate growth rates, but lower than the population growth rate. Africa's agricultural growth is estimated at about 3% per year.
3. Accelerated Growth
The scenario reflects agricultural systems that are highly mechanised. The energy intensive nature of the agriculture results in agricultural growth rates of about 4% per year, which are above the population growth rates. Projections for Africa using the three scenarios above are shown in figure 12 (see appendix V for detailed data). It appears from the analysis that Africa will need to double energy use in the agricultural sector in order to achieve self sufficiency in food production. This means that the rate of growth of food production should be equal or more than population growth rate. This is not surprising since it has been noted in other regions that increases in agricultural productive tend to be followed by increases in energy consumption especially oil products which can make the agricultural sector vulnerable to external oil shocks (Desai et al, 1986a).
Fig 12: Projections of Energy Use in Agriculture 1990 - 2010
British Petroleum Company p.l.c., 1991. BP Statistical Review of World Energy. Ashdown Press Ltd. London.
Davidson O. 1992. Energy Issues in Sub-Saharan Africa. Annual Review of Energy and Environment. 17:359-403. Palo Alto: Annual Review Inc.
Desai, AV et al. 1986a. Energy Research - Directions and Issues for Developing Countries. Ottawa: International Development Research Centre, p. 53-60.
Desai, AV et al. 1986b. Energy Research - Directions and Issues for Developing Countries. Ottawa: International Development Research Centre, p. 131-132.
ESKOM, 1993. Statistical Yearbook, 1993. ESKOM: South Africa, p. 92.
Girod, J. 1991. Energy -Diagnosis of Energy Systems in Developing Countries. Report EUR 13068 of the Directorate-General for Energy. Brussels: Commission of the European Communities. p. 73-85.
Guilherme, Antonio. 1992. Update on the SADCC Energy Situation in SADCC Energy, Jan-Feb-Mar, 1992. Vol. IX No. 24. Luanda: SADC Technical and Administrative Unit, TAU.
Hall, D. and Mao Yushi. eds. 1994. Biomass and Coal in Africa. London: ZED Books.
Johansson, T.B., Kelly, H., Reddy, A.K.N., and Williams, R.H. (Eds) 1993 Renewable Energy: Sources for Fuels and Electricity. Island Press: Washington.
Ministry of Water, Energy and Mining. 1988. Lesotho Energy Masterplan: Final Report. Maseru: GTZ and Department of Energy.
Musa E.S. 1993 'The Role of African Development Bank in Energy Development' In: Energy Options for Africa - Environmentally Sustainable Alternatives. eds S. Karekezi and G. MacKenzie. AFREPREN, FWD, UNEP/UCC and Zed books, London pp 86 - 94.
Rutabanzibwa P. 1989. Tanzania's Response to the Oil Crisis - Impacts and Lessons. Nairobi and Gaborone: AFREPREN.
SADC. 1992. SADC 1990 Energy Statistics Yearbook. Luanda: SADC Technical and Administrative Unit (TAU).
World Bank. 1989. Sub-Saharan Africa - From Crisis to Sustainable Growth, A Long-Term Perspective Study. Washington: The World Bank.
World Bank. 1992a. African Development Indicators. Washington: The World Bank. p. 353.
World Bank. 1992b. Word Development Report 1992. Washington: The World Bank.
World Energy Council. 1992. Energy for Tomorrow's World - the Realities, the Real Options and the Agenda for Achievement: Draft Summary of Global Report. London: World Energy Council.
World Resources Institute. 1994a. World Resources 1994-95: A Guide to the Global Environment - People and the Environment. New York: Oxford University Press. p. 336.
World Resources Institute. 1994b. World Resources 1994-95: A Guide to the Global Environment - People and the Environment. New York: Oxford University Press. p. 337.
World Resources Institute. 1994c. World Resources 1994-95: A Guide to the Global Environment - People and the Environment. New York: Oxford University Press. p. 334.
United Nations. 1992. 1990 - Energy Balances and Electricity Profiles. New York: United Nations
United Nations. 1993a. 1991 - Energy Statistics Yearbook. New York: United Nations. p. 332-338.
|
Country |
Sectors |
|
|
|
|
|
|
Population |
|
Agriculture |
Industry |
Transport |
Mining |
Commercial & Others |
Households |
TOTAL |
||
|
Zimbabwe |
27,000 |
48,000 |
36,000 |
8,000 |
14,000 |
118,000 |
251,000 |
9,947,000 |
|
Kenya |
28,549 |
41,441 |
44,204 |
|
11,888 |
181,631 |
307,713 |
23,585,000 |
|
Sudan |
7,701 |
15,916 |
31,112 |
|
11,673 |
198,706 |
265,109 |
25,203,000 |
|
South Africa |
55,000 |
929,000 |
458,000 |
150,000 |
|
364,000 |
1,956,000 |
37,959,000 |
|
Ethiopia |
30,054 |
29,171 |
37,840 |
|
25,072 |
546,343 |
668,480 |
49,830,000 |
|
Tanzania |
27,940 |
82,000 |
13,400 |
|
29,500 |
561,000 |
713,840 |
25,993,000 |
|
Morocco |
23,693 |
67,771 |
68,650 |
|
40,646 |
139,226 |
339,987 |
25,061,000 |
|
Botswana |
514 |
8,665 |
8,306 |
|
1,984 |
23,371 |
42,840 |
1,238,000 |
|
TOTAL |
200,450 |
1,221,965 |
697,512 |
158,000 |
134,764 |
2,132,277 |
4,544,968 |
198,816,000 |
|
Percentage Share |
4.41% |
26.87% |
15.35% |
3.48% |
2.97% |
46.92% |
100.00% |
|
|
|
Kgoe per capita 1990 |
Calories per capita 1989 |
|
SSA - Sub-Saharan Africa |
103 |
2,122 |
|
EAP - East Asia &. Pacific |
553 |
2,617 |
|
SA - South Asia |
205 |
2,215 |
|
MENA - Middle East & N. Africa |
1,102 |
3,011 |
|
LAC - Latin America & Car. |
1,057 |
2,721 |
|
EUR - Europe |
2,677 |
3,433 |
|
OECD - OECD members |
5,179 |
3,417 |
|
Sector |
PJ |
% |
|
Household |
1,050 |
68 |
|
Industry |
200 |
13 |
|
Transport |
110 |
7 |
|
Agriculture |
76 |
5 |
|
Mining |
43 |
3 |
|
Other |
70 |
4 |
|
Total |
1,549 |
100 |
Source: SADC, 1992; Guilherme, 1992.
|
Sector |
1990 |
|
Agriculture |
558,053 |
|
Ag-Transport |
407,327 |
|
Ag-Industry |
782,628 |
|
Industry |
2,620,103 |
|
Transport |
1,535,102 |
|
Mining |
440,368 |
|
Commercial & Others |
374,566 |
|
Households |
5,936,113 |
|
Total |
12,654,260 |
Appendix 5: Projected Energy Requirements for Africa (TJ)
|
Sector |
1990 |
2010 |
||
|
|
Reference |
Moderate Improvement |
Accelerated Growth |
|
|
Agriculture |
558,053 |
829,237 |
1,007,906 |
1,222,763 |
|
Ag-Transport |
407,327 |
417,215 |
482,459 |
605,266 |
|
Ag-Industry |
782,628 |
1,714,834 |
2,076,545 |
2,509,994 |
|
Industry |
2,620,103 |
4,596,257 |
4,596,257 |
4,596,257 |
|
Transport |
1,535,102 |
1,952,566 |
1,948,711 |
1,948,711 |
|
Mining |
440,368 |
680,509 |
680,509 |
680,509 |
|
Commercial & Others |
374,566 |
480,207 |
480,207 |
480,207 |
|
Households |
5,936,113 |
5,819,677 |
5,819,677 |
5,819,677 |
|
Total |
12,654,260 |
16,490,503 |
17,092,273 |
17,863,385 |
![]()
![]()
![]()