![]()
![]()
![]()
David A. Fournier
Otter Research Ltd.
P. O. Box 265, Station A
Nanaimo, B.C. V9R 5K9, Canada
John Hampton
Oceanic Fisheries Programme
South Pacific Commission
B.P. D5, Noumea Cedex, New Caledonia
John R. Sibert
Pelagic Fisheries Research Program
Joint Institute of Marine and Atmospheric Research
University of Hawaii
Honolulu, Hawaii 96822, USA
ABSTRACT
A catch-at-length model based on a multiple fishery extension of the MULTIFAN length frequency analysis model is applied to fisheries catch-at-length data for South Pacific albacore. The model is used to estimate the catches which would be experienced in some fisheries if the catches from other fisheries had not occured.
1. INTRODUCTION
The primary motivation for the development of fisheries resource models is to obtain information useful for making policy decisions regarding future management of the fishery. An equally important motivation is the development of a tool for rigorously examining the data on which these decisions are based. Fisheries data usually come from a variety of different sources and are collected on different temporal and spatial scales of resolution. It is often not easy to determine whether these data sources are internally consistent and consistent with one another. A fisheries model can provide a yardstick with to evaluate the consistency of data.
Much of the information used for managing exploited fish populations is derived at present from the analysis of fisheries catch-at-age data. These data, often combined with additional auxiliary data, are used in age-structured models to obtain estimates of stock size and exploitation rates. The catch-at-age estimates employed in these models are usually obtained by analyzing patterns in various body parts of individual fish, e.g., otoliths or fin ray sections. Fisheries catch-at-length data provide a convenient alternative for analysis by age-structured models. These data are much less costly to obtain and given the inaccurate nature of the age estimates for many fish species may actually provide better estimates of the relevant parameters in some situations.
We have employed an age-structured model based on the MULTIFAN system of converting length composition to age composition (Fournier et al., 1990) to analyze South Pacific albacore catch-at-length and effort data. This new model employs the same assumptions and estimation procedures as MULTIFAN for fitting the catch-at-length data. The main modifications to the model include the parameterization of the proportions at age in the catch via the catch equations, the ability of the model to deal with more than one catch-at-length sample (i.e., more than one fishery), and the inclusion of the total catch data (in this case, total numbers of fish) into the fitting procedure.
An important feature of our model is that it is fully integrated. Growth and age structure are estimated simultaneously with recruitment, selectivity, catchability and natural mortality. Another feature is that missing data and data of different temporal resolutions are allowable and are internally managed by the model. Also, various auxilliary data can be easily incorporate into assessments, as appropriate. Finally, we use more realistic parameterizations of fishing mortality than most previous statistical catch-at-age models. These include the possibility of estimating time series trends in catchability and selectivity.
The data structures and model assumptions necessary for dealing with arbitrary occurences of multiple fisheries are described Fournier et al. (in prep) to which the reader is referred for a more detailed description of the model, but a few equations useful for describing the calculations used in the fishery interaction estimation are presented.
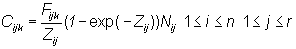
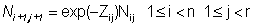
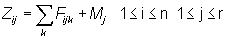
The catch equations relate the numbers of fish in the population to the numbers of fish in the catch of the fisheries. Assume that there are a number of fisheries indexed by k, each of which occurs once per year. The relevant equations are:
|
|
(1.1) |
|
|
(1.2) |
|
|
(1.3) |
|
|
(1.4) |
n is the number of years of fishing,To estimate the interaction of a given fishery or group of fisheries on the other fisheries, the fishing mortality rate for that fishery is set equal to 0 and the Cijk for the other fisheries are recalculated. Letr is the number of distinct age classes in the population (so that group r consist of all fish in age class r or older),
Nij is the number of age class j fish in the population at the beginning of year i,
Cijk is the number of age class j fish in the catch of fishery k in year i,
Fijk is the instantaneous fishing mortality rate for fishery k for age class j fish in year i,
Mj is the instantaneous natural mortality rate for age class j fish,
Zij is the instantaneous total mortality rate for age class j fish in year i,
 denote
the new catch estimates. The ratio of the new catch biomass to the old catch
biomass assumed to be equal to
denote
the new catch estimates. The ratio of the new catch biomass to the old catch
biomass assumed to be equal to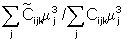
where mj is the estimated mean length of age class j fish.
2. ORGANISATION OF THE DATA
The fishing activities had to be classified into fisheries, which is the fundamental model data structure. Fisheries should ideally consist of collections of similar vessels using similar fishing methods; we therefore defined a longline fishery, a driftnet fishery and two troll fisheries, one in New Zealand coastal waters and the other in the STCZ. The separation of troll into New Zealand (NZ) and STCZ fisheries was justified because of substantial differences in vessel sizes, technological backup and general fishing and searching techniques. Division of longline into several fisheries on the basis of area or targeting behaviour may also have been desirable, but we were prevented from exploring these options because much of the longline length frequency data were not available with sufficient resolution or accompanying information to allow this.
Catch, effort and length frequency data have been routinely collected from these fisheries over a long period of time by various fisheries agencies. Catch and effort data were compiled from fishermen's logbooks, while length frequency samples were taken in unloading ports and by at-sea observers. Generally, we did not have access to these original data, but were supplied with summaries aggregated by various area-time strata; the temporal resolution of the data varies from month to year. Also, there have been times when few or no length frequency data were collected for some fisheries and when no effort data were available. The data comprise 153 fishing incidents, beginning in 1962 and ending in 1992. The fishing period associated with each fishing incident depends on the temporal resolution of data available. Where this was greater than one month, it was assumed that the fishing incident occurred in the middle of the period.
3. ESTIMATION OF FISHERIES INTERACTIONS
To estimate the amount of fishery interaction we set the catch from a fishery or group of fisheries to zero and, using the parameter estimates from the model, calculated the increased catch for the other fisheries, assuming that the fishing mortality rates for these fisheries remained the same. Some remarks concerning the limitations of this approach are in order.
The model is not spatially disaggregated. It assumes that all fisheries are targeting the same group of fish. This is the price one must pay for using a model which does not require any information or assumptions about the movement of fish. If two fisheries are actually exploiting a common subgroup of the population this approach will tend to underestimate the amount of interaction between the two fisheries. On the other hand, if two fisheries are exploiting different subgroups of the population then this approach will tend to overestimate the extent of interaction.
4. RESULTS
The process of hypothesis testing and model selection is to that in MULTIFAN. Extra parameters associated with more complicated hypotheses are added to the model, and their effect on improving the goodness of fit is evaluated using standard significance tests. The process of selecting the "best" value for the natural mortality was more problematic.
To reduce the number of free parameters in the model it is often assumed that the instantaneous natural mortality is a constant, independent of the year and age. For South Pacific albacore, large changes in the proportion of males to females which occur over a small range in length indicate that older females may experience a much higher natural mortality rate than do older males. Since males and females are grouped in this analysis we cannot model this difference in mortality rates explicitly. Instead we have investigated the effect of imposing a higher instantaneous natural mortality rate for the older age classes. To incorporate the effect of larger natural mortality for females we set the instantaneous natural mortality rate 50 percent higher for the last three age classes. Two situations were considered - a natural mortality rate of 0.20 for the younger age classes and 0.30 for the older age classes, and a natural mortality rate of 0.40 for the younger age classes and 0.60 for the older age classes.
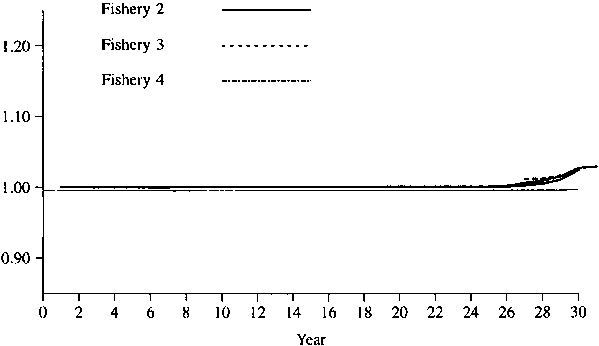
Figures 1 - 2 show the simulated results of setting the catch of fisheries 4 and 5 to 0. Figures 3-4 show the simulated results of setting the catch of fisheries 1 and 5 to 0. As one would expect, the effect is greater for a lower natural mortality rate. In any event, the maximum effect is only about 10%, so that one might conclude that there is no evidence of large amount of interaction for these data.
5. REFERENCES CITED
Fournier, D.A., J.R. Sibert, J. Majkowski and John Hampton. 1990. MULTIFAN: a likelihood-base method for estimating growth parameters and age composition from multiple length frequency data sets illustrated by using data for southern bluefin tuna (Thunnus maccoyii). Can. J. Fish. Aquat. Sci. 47:301-317.
Fournier, D.A., J. Hampton and J.R. Sibert. A length-based age-structured model for fisheries stock assessment, with application to South Pacific albacore Thunnus Alalunga in prep.
Figure 1. Relative catches in fisheries 1 through 3 when there is no catch in fisheries 4 and 5. Natural mortality = 0.2 on first 5 age classes and 0.3 on last 3 age classes.
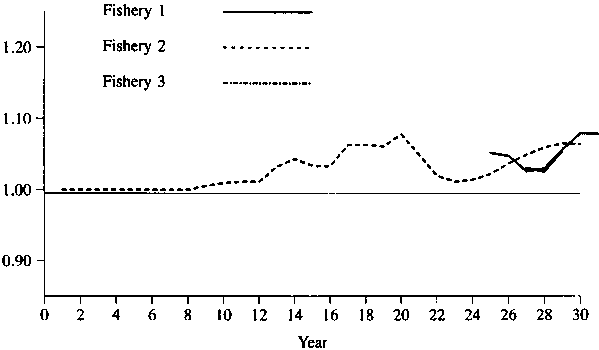
Figure 2. Relative catches in fisheries 1 through 3 when there is no catch in fisheries 4 and 5. Natural mortality = 0.4 on first 5 age classes and 0.6 on last 3 age classes.
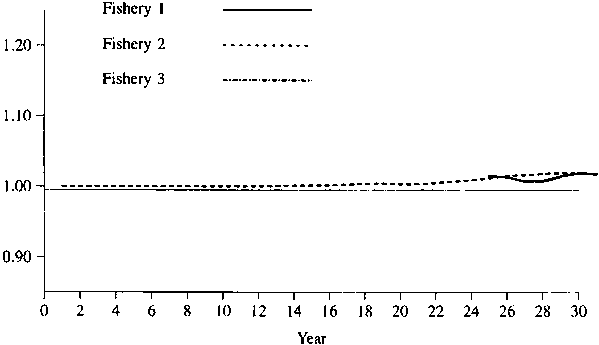
Figure 3. Relative catches in fisheries 2, 3, and 4 when there is no catch in fisheries 1 and 5. Natural mortality = 0.2 on first 5 age classes and 0.3 on last 3 age classes.
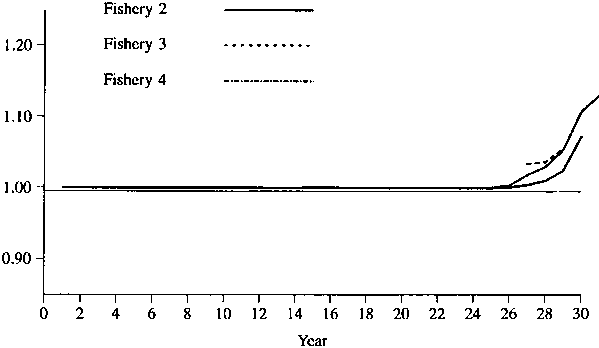
Figure 4. Relative catches in fisheries 2, 3, and 4 when there is no catch in fisheries 1 and 5. Natural mortality = 0.4 on first 5 age classes and 0.6 on last 3 age classes.
![]()
![]()
![]()