Patrick K. Tomlinson
Inter-American Tropical Tuna Commission
c/o Scripps Institution of Oceanography
8604 La Jolla Shores Drive
La Jolla, California 92037 USA
ABSTRACT
Japanese high-seas longline fishery data were used to plot the monthly distribution of catch and effort by 5-degree area. A scheme of weighting each 5-degree square was devised so that the location of catch or effort could be easily determined. The results show that there is a very pronounced pattern of movement in both the locations of the catch and the locations of the effort. Since the effort was more broadly distributed than the catches, it was concluded that large bluefin of the size caught by longliners generally follow a pattern of moving to the west in the spring and to the east in the fall, with most of the fish of this size staying in the northern Pacific Ocean. Occasionally, the eastern extension of the movement makes these large bluefin available to the purse seine fishery in the eastern Pacific Ocean.
1. INTRODUCTION
This study is based on catch and effort data for the Japanese high-seas longline fishery kindly made available to the staff of the Inter-American Tropical Tuna Commission (IATTC) by the National Research Institute of Far Seas Fisheries of Japan.
2. METHODS
The data utilized include summaries of catch by species, in numbers of fish, by year (1952-1986), month, and 5-degree area, and summaries of the effort, in number of hooks (not adjusted for any changes in efficiency over time), by year, month, and 5-degree area. The data for northern bluefin tuna (NBF) were extracted and summarized by month and 5-degree area. For the purpose of showing the distribution of catch by month, two time periods of 14 years each--1959 to 1972 and 1973 to 1986 were selected. Maps of the distributions of catches for each of the two time periods (Figures 1 to 12, top panel for the early period and bottom for the late period) were prepared. After examination of these distributions, a NBF core area was chosen (Figure 13). The core area contains 58 5-degree areas, all in the northern hemisphere. Let
Cijk = NBF catch for year i, month j, and 5-degree area k,
Eijk = number of hooks for year i, month j, and 5-degree area k,
and
Uijk = catch per hook (CPUE) for year i, month j, and 5-degree area k,
Uijk = Cijk/Eijk
where
i = 1, 2, ...., N; N = number of years,
j = 1, 2, ...., M; M = number of months, and
k = 1, 2, ...., L; L = number of 5-degree areas.
Total catches by year for the entire Pacific Ocean (SSS Cijk, N = 1, M = 12, L = 636) and for the core area (SSS Cijk, N = 1, M = 12, L = 58) were compiled (Table 1). The monthly totals, by year, of NBF catch, in numbers of fish, were calculated for the entire Pacific Ocean (SSS Cijk, N = 1, M = 1, L = 636) (Table 2) and for the core area (SSS Cijk, N = 1, M = 1, L = 58) (Table 3). The monthly totals, by year, of longline effort in thousands of hooks, were calculated for the core area (SSS Eijk, N = 1, M = 1, L = 58) (Table 4).
Within each year, a search was made to find the 5-degree area-month strata within the core area which contained the greatest catches and the greatest effort (Table 5). Similarly, the numbers of 5-degree area-month strata with catches of at least one NBF (Table 6), and the numbers of 5-degree area-month strata with effort of at least one hook (Table 7) were counted for each year.
For each longitudinal strip of 5 degrees, starting at the equator and going north or south, each 5-degree area going from 80°W to 80°E was given a number from 1 to 40. For each strip, the numbering starts with 1 in the east and goes sequentially to 40 in the west. The area covered by this numbering system has a total of 880 5-degree areas (22 5-degree strips with 40 5-degree areas per strip), with half the areas north of the equator. An index is formed by multiplying the number of NBF caught in a 5-degree area-month by the numerical value of that area and then summing over all area-months. This sum is divided by the sum of the catches to obtain a weighted estimate of the average index. Let
Xk = k = east-west value of area k; k = 1, 2, ...., 40, and
Vij = SS XkCijkl/SS Cijkl; l = 1, 2, ...., 22 = east-west value for year i and month j.
This provides a numerical representation of the east-west origin of the catch; the higher the value, the more westerly the catch. These east-west values were computed for each month of each year of the 1952-1986 period for the entire Pacific Ocean (Figure 14) and for the NBF core area (Figure 15). Similar east-west values were calculated for effort within the entire Pacific Ocean (Figure 16), effort within the core area (Figure 17), and CPUE within the core area (Figure 18). The monthly values of catch (dotted lines) and effort (solid lines) for each year were plotted for the entire Pacific Ocean (Figure 19) and for the NBF core area (Figure 20) to help determine if the east-west location of catch was influenced by the east-west location of effort.
3. RESULTS
3.1 Longline Catches
The core area usually contained more than 85% of the catch during the 1952-1971 period, but after that the percentages became more variable (Table 1). The data of Nakamura (1969) and Shingu et al. (1974) give the impression that most NBF caught by longline are between about 80 and 200 kg. The longline fishery appears to have made important contributions to the total catch during the early 1960s, but since about 1965 the contribution has been minor.
3.2 Movement
It appears that the large NBF caught by longliners concentrate on or near the spawning grounds in April through June and then move slightly to the north and substantially to the east (Figures 1 to 12, top and bottom, and Figure 17). The fish reach the central Pacific Ocean and beyond, especially during December through February. The distance between the average western location (say 25°N-130°E) in May and the average eastern location (say 32°N-172°E) in December-January is about 2.3 thousand nm (4.2 km). This means that the large NBF move about 383 nm (700 km) per month, or about 13 nm (23 km) per day. Of course, there is considerable variability in the data.
The monthly variation in the east-west location of the catch for the entire Pacific Ocean shows a consistent pattern (Figure 14), while the variation for Pacific-wide effort (Figure 16) is not so consistent. The effort is distributed farther to the east than the NBF catch for the Pacific-wide data, and the timing of the movements for catch (Figure 19, dotted line) differ from those of effort (Figure 19, solid line). However, the results are somewhat different when the analysis is confined to the core area. For the core area, the oscillation for catch (Figure 15) and effort (Figure 17) are much more nearly similar, with similar timing for catch (Figure 20, dotted line) as for effort (Figure 20, solid line). The locations of the greatest CPUEs (Figure 18) within the core area are very similar to the locations of the greatest catches (Figure 15). If the monthly indices for CPUEs are regressed against the indices for catch, the regression explains 89 percent of the variation in the CPUE data and the slope is not significantly different from 1. However, if a similar regression is done with effort, it explains only 51 percent of the variation in the effort data, and the slope is significantly different from 1. In the core area (on a month-by-month basis) the number of 5-degree areas with effort averaged between 11 and 51 (Table 7) with the overall average at about 30, while the number of 5-degree areas with catch averaged between 0 and 24 (Table 6) with the overall average at about 10. Therefore, within the core area, about two-thirds of the month-5 degree areas with effort produced no catch of NBF.
4. DISCUSSION
It is unfortunate that the results on movements must be tempered by the limitations of the data. Most of the NBF are caught from the core area, and within this area the effort moves west to east and then back to the west on a regular cycle which is similar to that of the catch location, but more spread out. Since the distribution of effort is more spread out than the distribution of catch, there must be a high correlation between where the NBF are caught and where they actually are located. Also, the greatest CPUEs for NBF are in the same areas and times as the greatest catches. In other words, the effort seems to bracket the area where the NBF are being caught, with areas surrounding the catch areas having zero CPUE. Figures 21 and 22, which show the locations of catches and locations of areas with effort, but no catch, for two different months (May and December), clearly indicate that effort extends beyond the range of the catch, especially when the catches are from offshore during December. When the areas with catches were within the southwest part of the core area, there were still some effort to the east of where the NBF were being caught, but not much. However, when the main areas with catches were in the northeast part of the core area, there were still large amounts of effort in the western part with small catches of NBF.
Large NBF, similar in size to those caught by longliners, were caught by purse seiners in the eastern Pacific during November and December of 1988 (Foreman and Ishizuka, 1990). These fish may have appeared in the eastern Pacific during the fall of 1988 because they were distributed further to the east than is usually the case. It does indicate there is some possibility that the large NBF usually exploited by longliners in the central Pacific during December to February could be taken by purse seiners operating in the eastern Pacific.
5. LITERATURE CITED
Foreman, T.J., and Y. Ishizuka. 1990. Giant bluefin off Southern California, with a new California size record. Calif. Fish Game 76(3): 181-186.
Nakamura, H. 1969. Tuna Distribution and Migration. London, Fishing News (Books) Ltd. 76 p.
Shingu, C., Y. Warashina, and N. Matsuzaki. 1974. Distribution of bluefin tuna exploited by longline fishery in the western Pacific Ocean. Bull. Far Seas Fish. Res. Lab. 10: 109-140.
Figure 1. January distribution of Japanese longline catches of NBF, summed over two time periods of 14 years each (1959 to 1972).
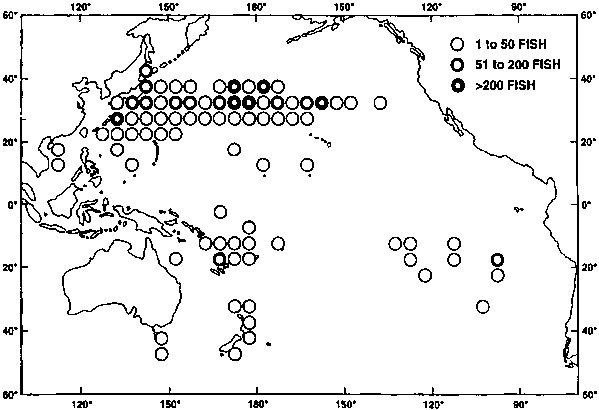
Figure 1. January distribution of Japanese longline catches of NBF, summed over two time periods of 14 years each (1973 to 1986).
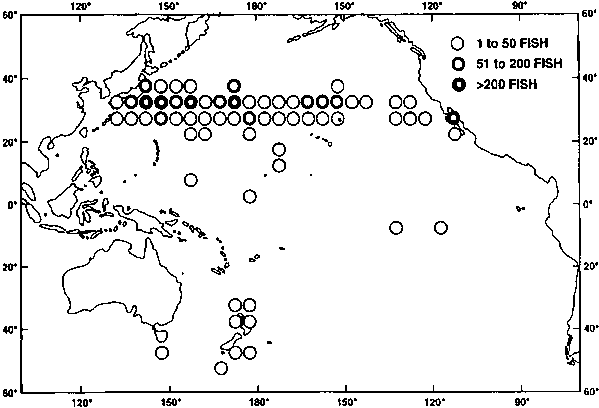
Figure 2. February distribution of Japanese longline catches of NBF, summed over two time periods of 14 years each (1959 to 1972).
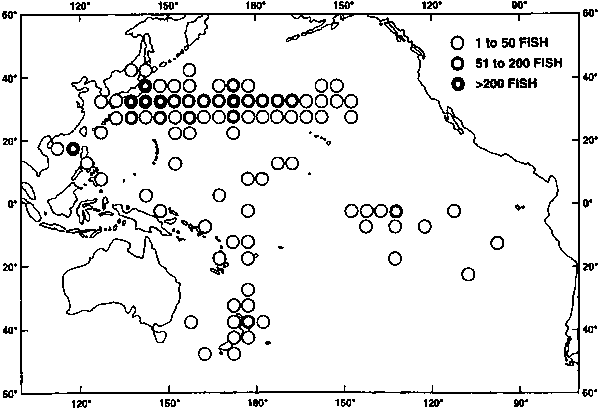
Figure 2. February distribution of Japanese longline catches of NBF, summed over two time periods of 14 years each (1973 to 1986).
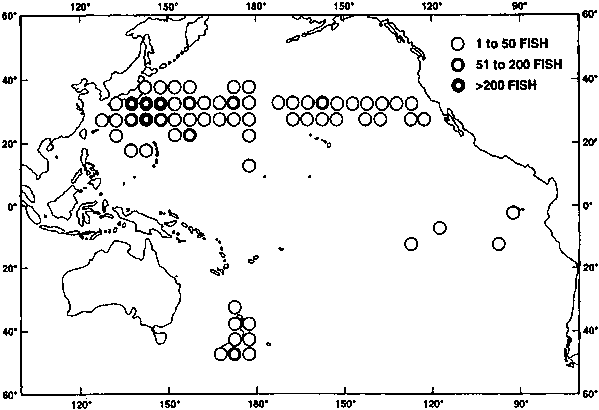
Figure 3. March distribution of Japanese longline catches of NBF, summed over two time periods of 14 years each (1959 to 1972).
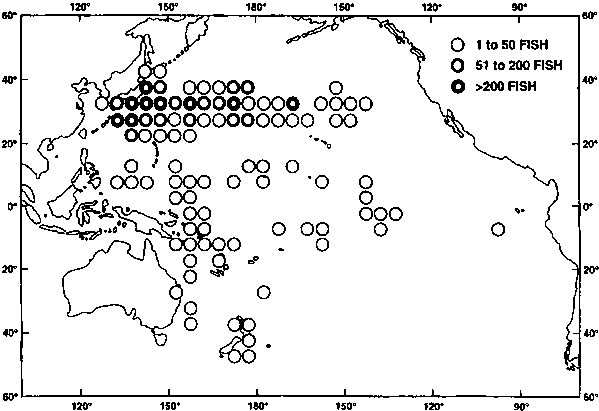
Figure 3. March distribution of Japanese longline catches of NBF, summed over two time periods of 14 years each (1973 to 1986).
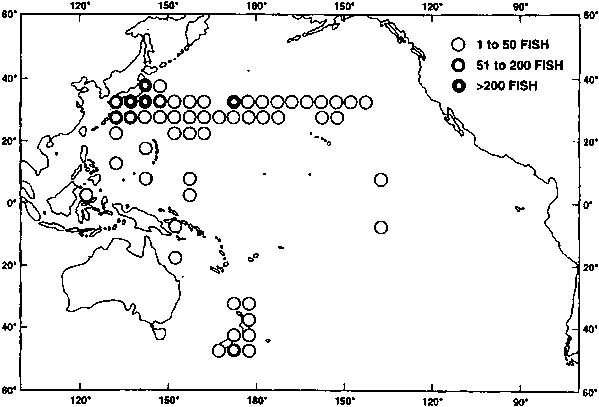
Figure 4. April distribution of Japanese longline catches of NBF, summed over two time periods of 14 years each (1959 to 1972).
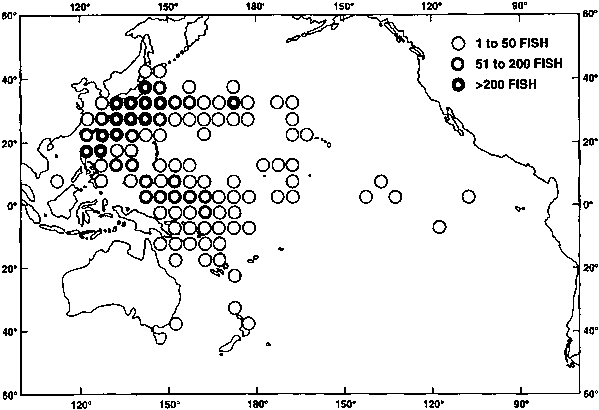
Figure 4. April distribution of Japanese longline catches of NBF, summed over two time periods of 14 years each (1973 to 1986).
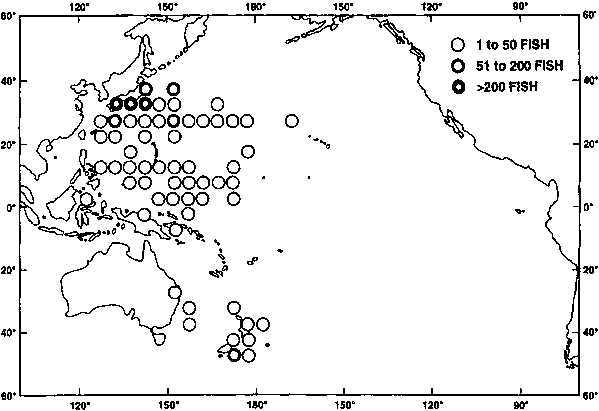
Figure 5. May distribution of Japanese longline catches of NBF, summed over two time periods of 14 years each (1959 to 1972).
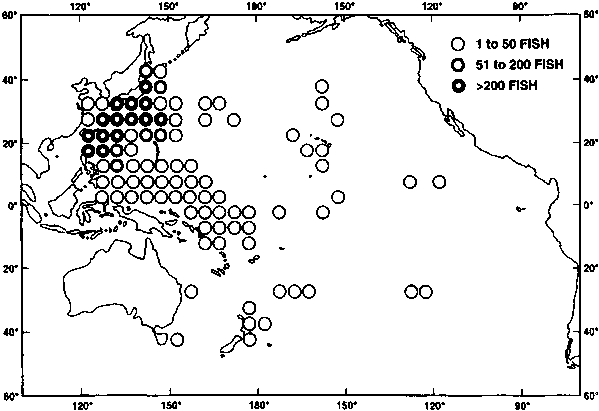
Figure 5. May distribution of Japanese longline catches of NBF, summed over two time periods of 14 years each (1973 to 1986).
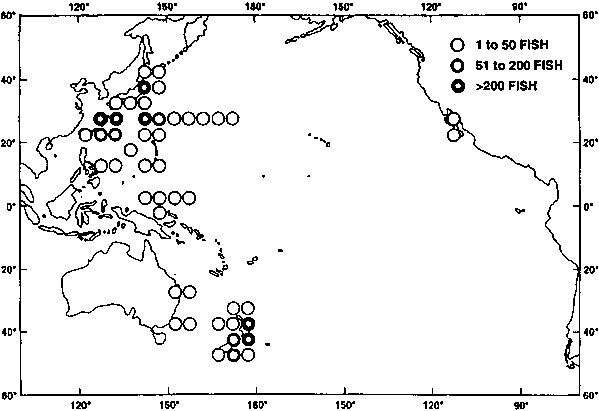
Figure 6. June distribution of Japanese longline catches of NBF, summed over two time periods of 14 years each (1959 to 1972).
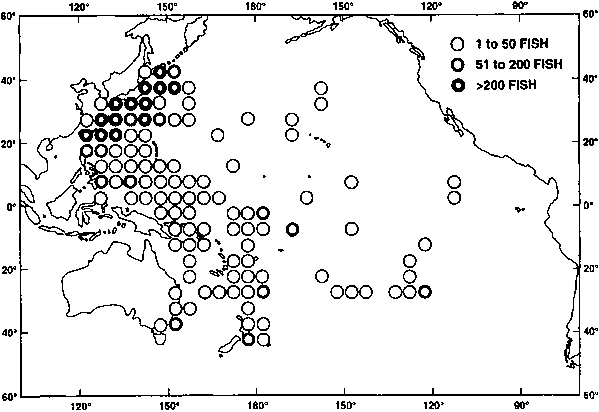
Figure 6. June distribution of Japanese longline catches of NBF, summed over two time periods of 14 years each (1973 to 1986).
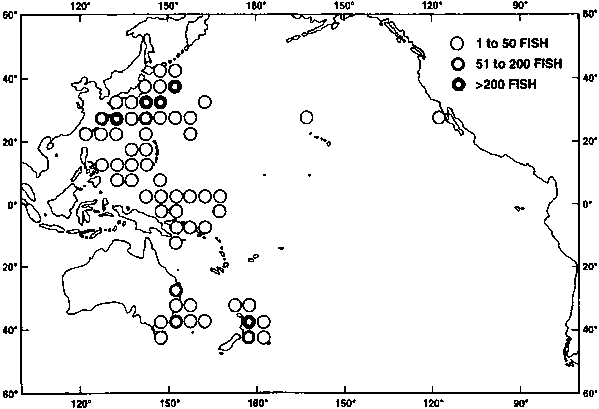
Figure 7. July distribution of Japanese longline catches of NBF, summed over two time periods of 14 years each (1959 to 1972).
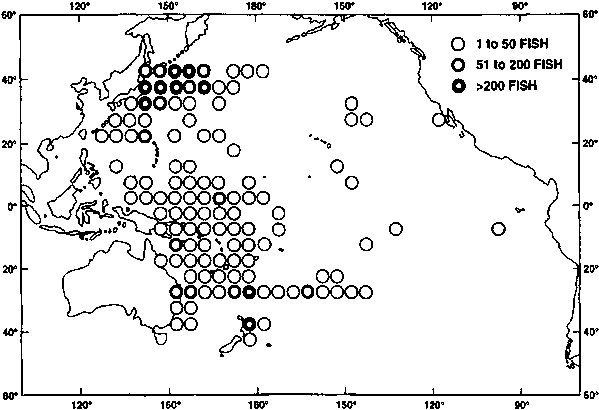
Figure 7. July distribution of Japanese longline catches of NBF, summed over two time periods of 14 years each (1973 to 1986).
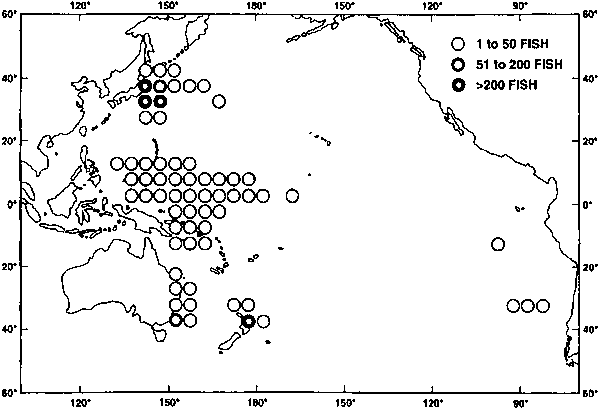
Figure 8. August distribution of Japanese longline catches of NBF, summed over two time periods of 14 years each (1959 to 1972).
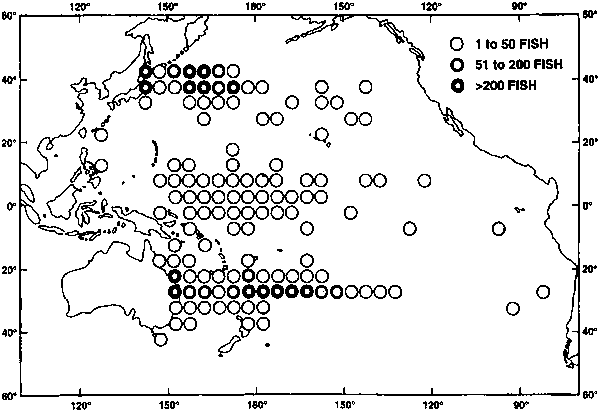
Figure 8. August distribution of Japanese longline catches of NBF, summed over two time periods of 14 years each (1973 to 1986).
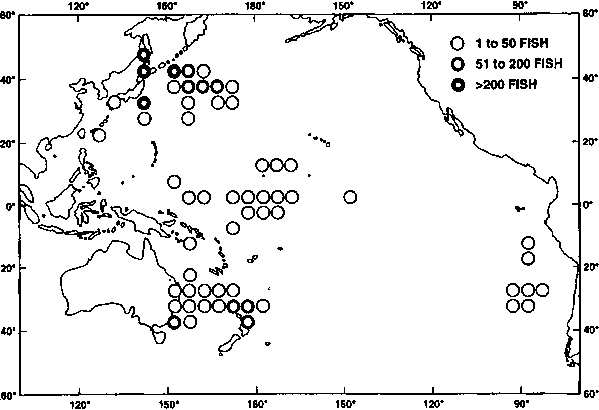
Figure 9. September distribution of Japanese longline catches of NBF, summed over two time periods of 14 years each (1959 to 1972).
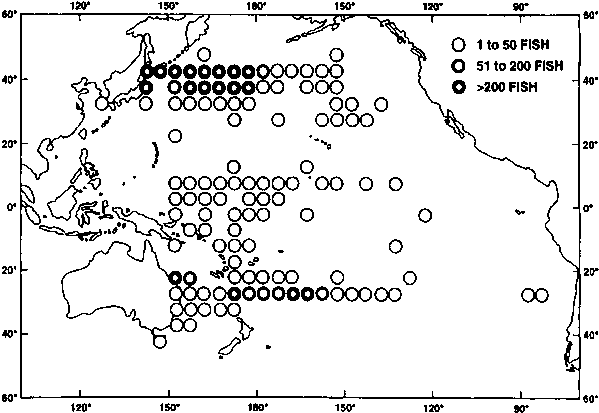
Figure 9. September distribution of Japanese longline catches of NBF, summed over two time periods of 14 years each (1973 to 1986).
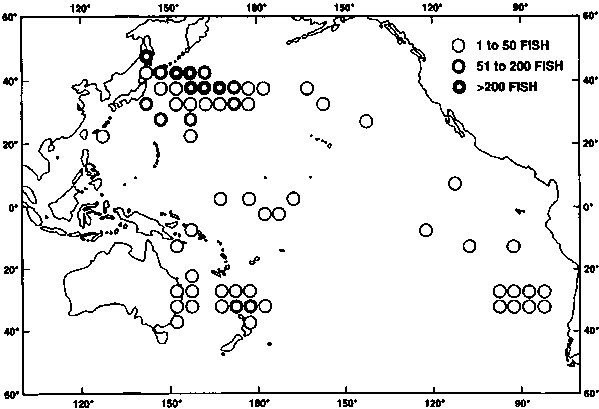
Figure 10. October distribution of Japanese longline catches of NBF, summed over two time periods of 14 years each (1959 to 1972).
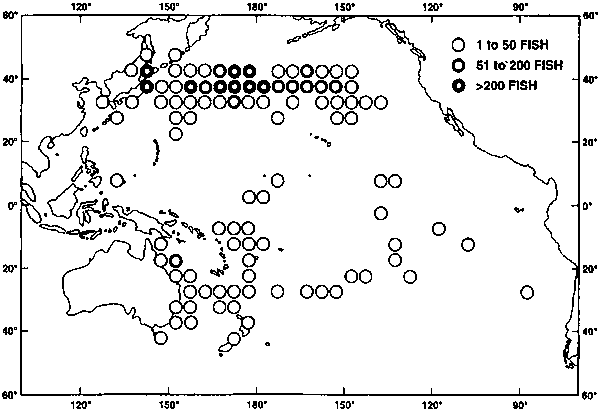
Figure 10. October distribution of Japanese longline catches of NBF, summed over two time periods of 14 years each (1973 to 1986).
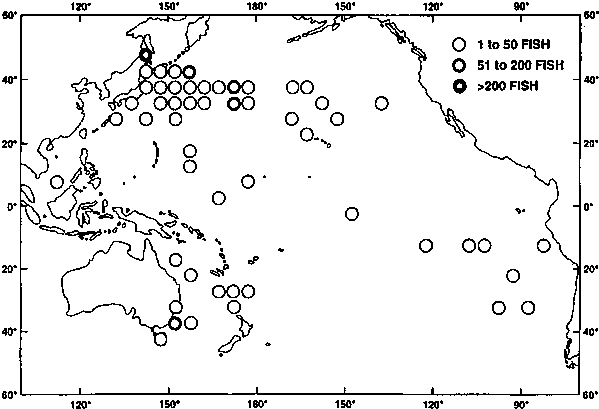
Figure 11. November distribution of Japanese longline catches of NBF, summed over two time periods of 14 years each (1959 to 1972).
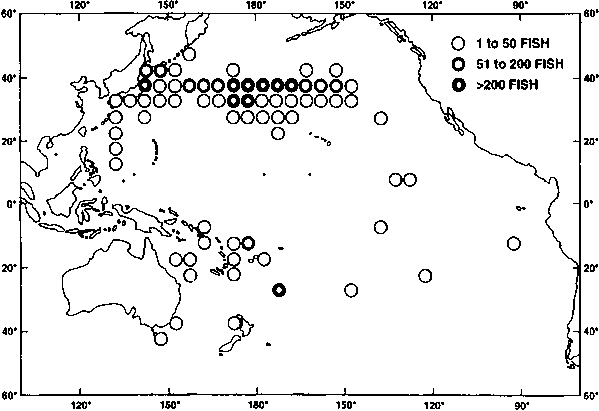
Figure 11. November distribution of Japanese longline catches of NBF, summed over two time periods of 14 years each (1973 to 1986).
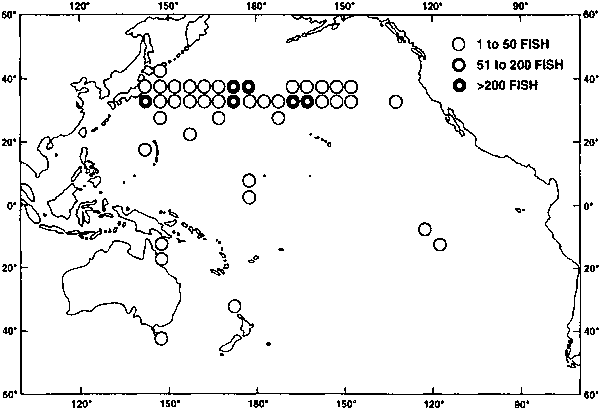
Figure 12. December distribution of Japanese longline catches of NBF, summed over two time periods of 14 years each (1959 to 1972).
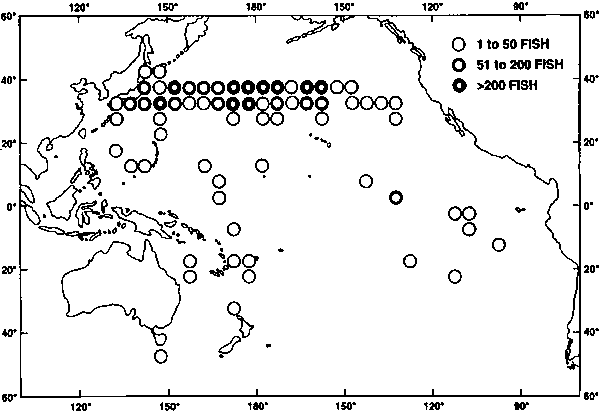
Figure 12. December distribution of Japanese longline catches of NBF, summed over two time periods of 14 years each (1973 to 1986).
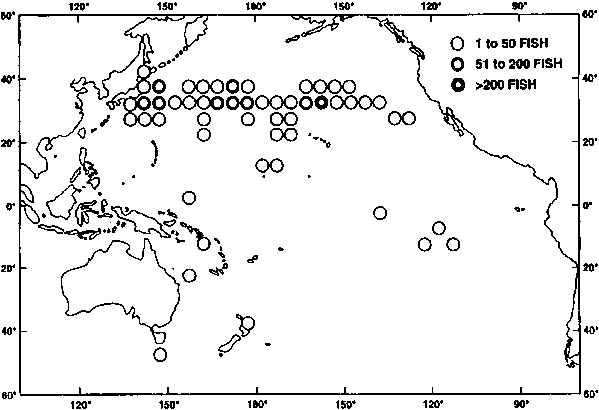
Figure 13. Japanese longline fishery core area for NBF. Total area contains 58 5-degree areas.
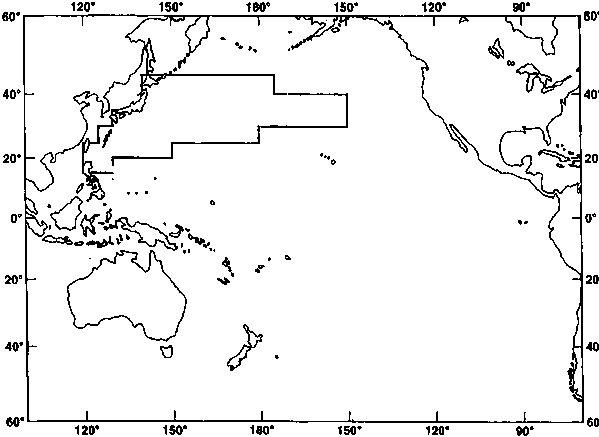
Figure 14. Japanese longline monthly index of east-west location for NBF catches from the entire Pacific Ocean. The greater the number, the farther west the NBF were captured, on average.
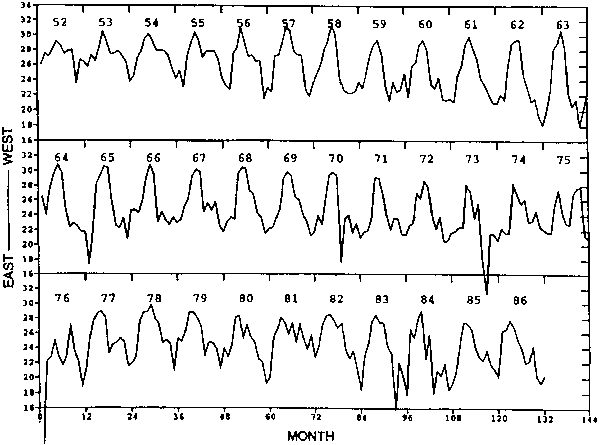
Figure 15. Japanese longline monthly index of east-west location for NBF catches from the core area. The greater the number, the farther west the NBF were captured, on average.
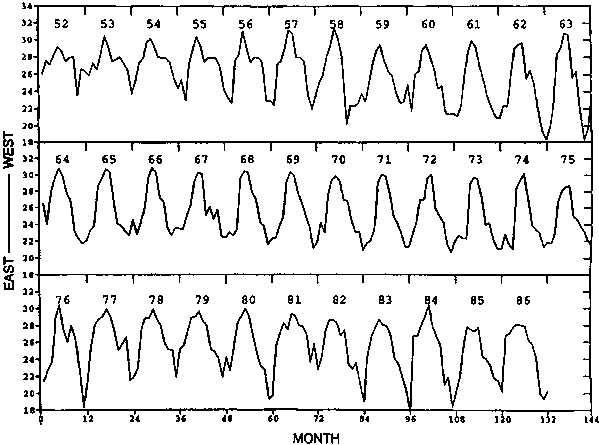
Figure 16. Japanese longline monthly index of east-west location for effort from within the entire Pacific Ocean. The greater the number, the farther west the effort, on average.
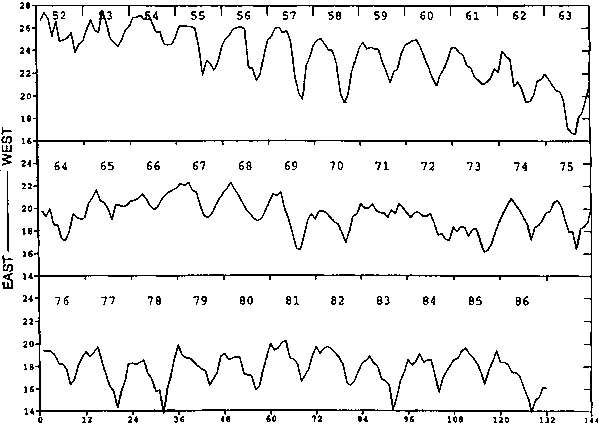
Figure 17. Japanese longline monthly index of east-west location for effort from within the core area. The greater the number, the farther west the effort, on average.
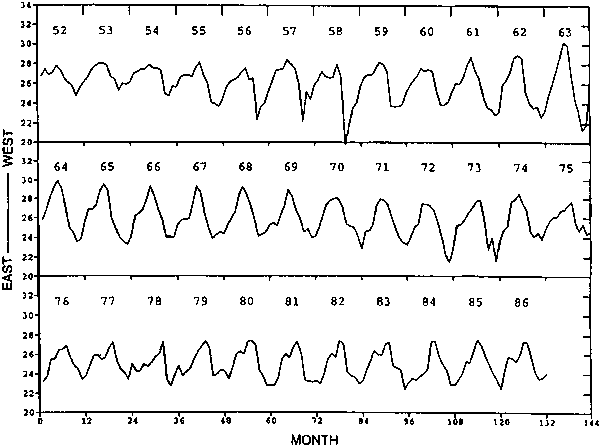
Figure 18. Japanese longline monthly index of east-west location for CPUEs from within the core area. The greater the number, the farther west the greatest CPUE, on average.
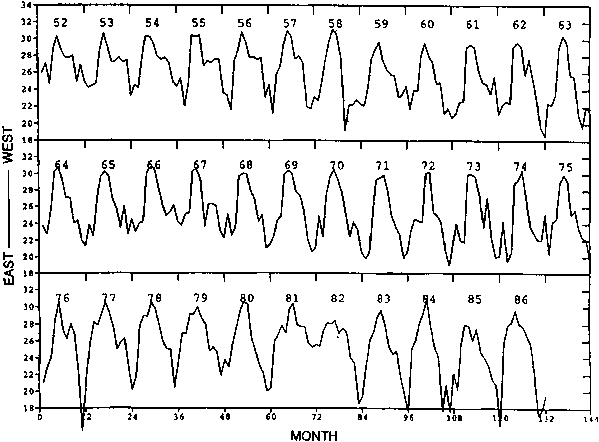
Figure 19. Annual comparisons of the Japanese longline monthly index of east-west location for the NBF catches (dotted line) from the entire Pacific Ocean to those of the effort (solid line). (A)
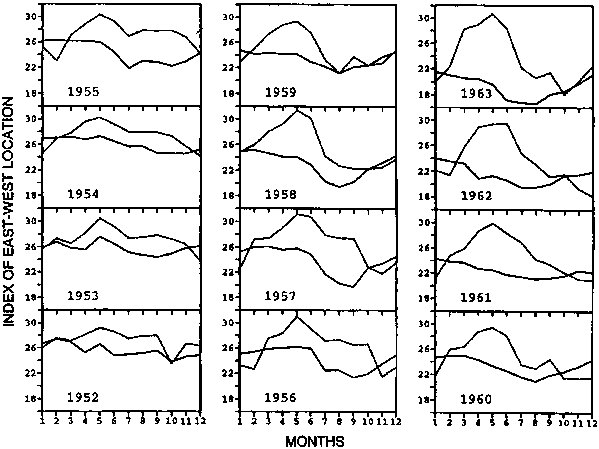
Figure 19. Annual comparisons of the Japanese longline monthly index of east-west location for the NBF catches (dotted line) from the entire Pacific Ocean to those of the effort (solid line). (B)
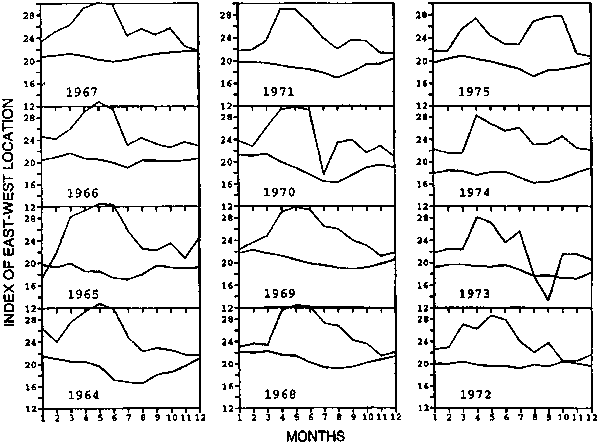
Figure 19. Annual comparisons of the Japanese longline monthly index of east-west location for the NBF catches (dotted line) from the entire Pacific Ocean to those of the effort (solid line). (C)
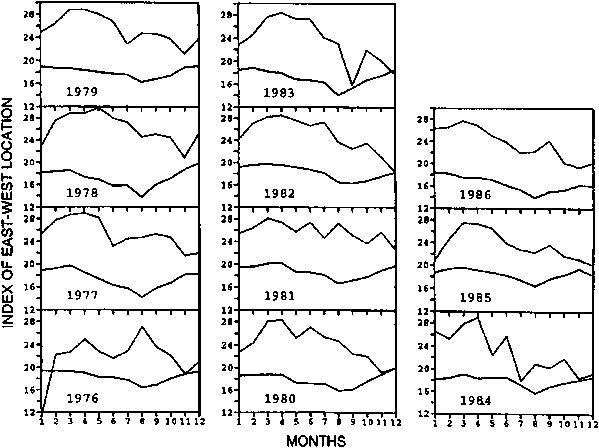
Figure 20. Annual comparisons of the Japanese longline monthly index of east-west location for the NBF catches (dotted line) from the core area to those of the effort (solid line). (A)
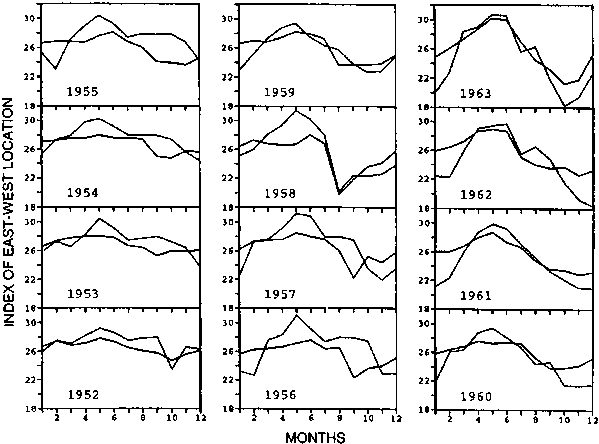
Figure 20. Annual comparisons of the Japanese longline monthly index of east-west location for the NBF catches (dotted line) from the core area to those of the effort (solid line). (B)
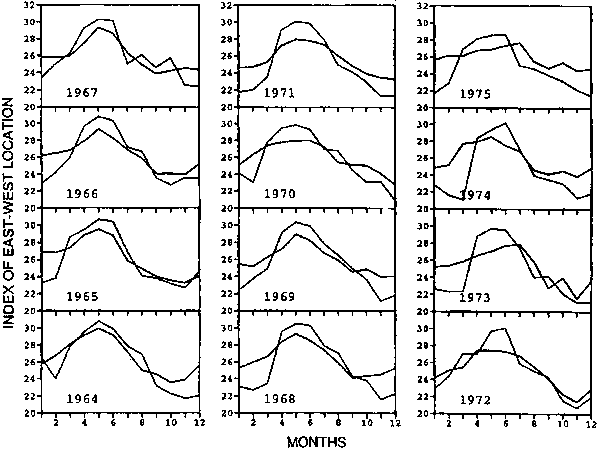
Figure 20. Annual comparisons of the Japanese longline monthly index of east-west location for the NBF catches (dotted line) from the core area to those of the effort (solid line). (C)
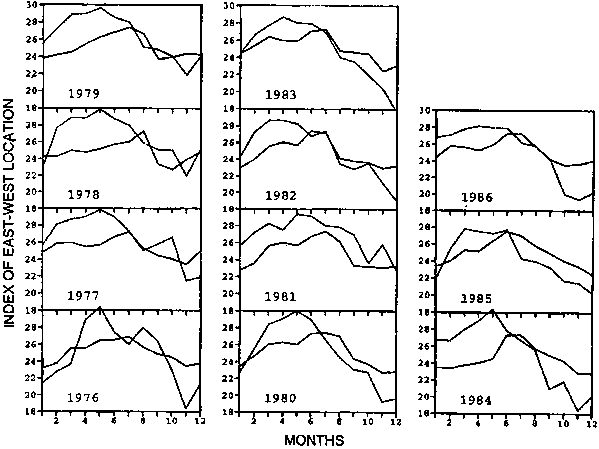
Figure 21. Annual distributions of Japanese longline catches of NBF taken within the core area during May. Catches are indicated by *, +, o, or - (with the greatest to least catches in the same order). Areas with effort, but no catch, are indicated by dots.
Figure 21 a.
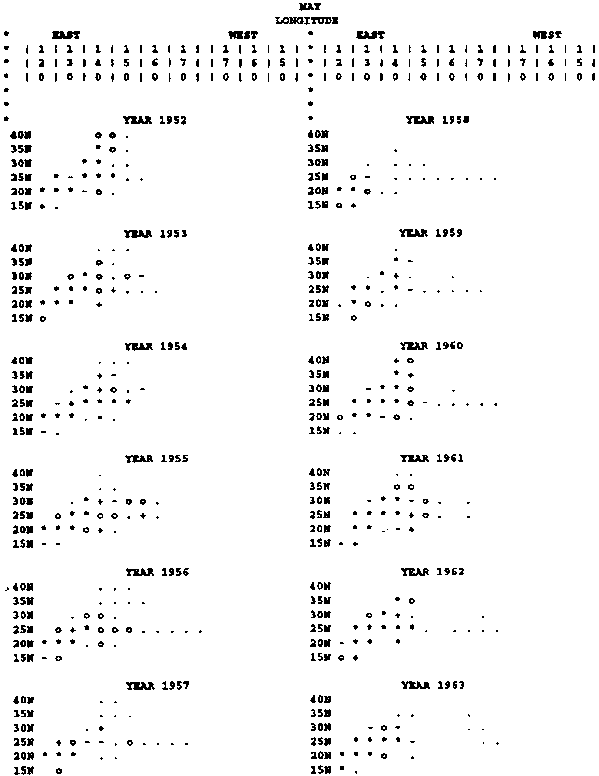
Figure 21 b.
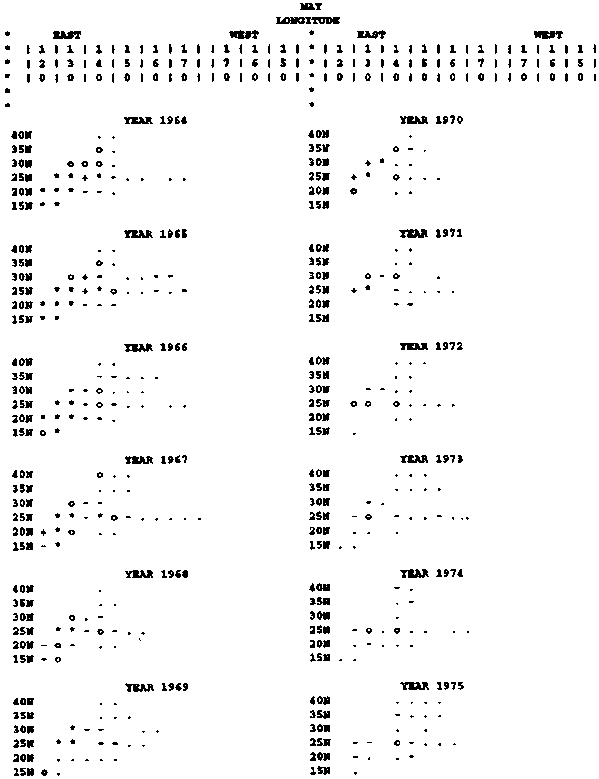
Figure 21 c.
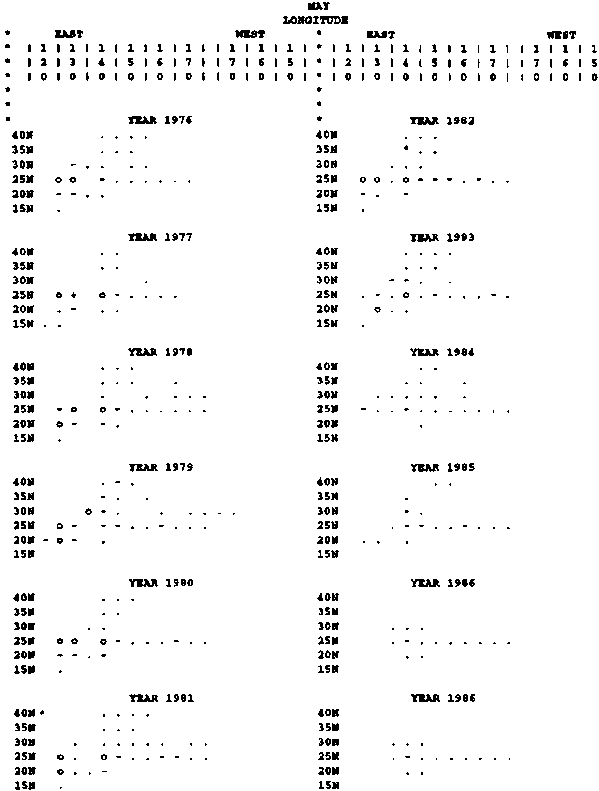
Figure 22. Annual distributions of Japanese longline catches of NBF taken within the core area during December. Catches are indicated by *, +, o, or - (with the greatest to least catches in the same order). Areas with effort, but no catch, are indicated by dots.
Figure 22 a.
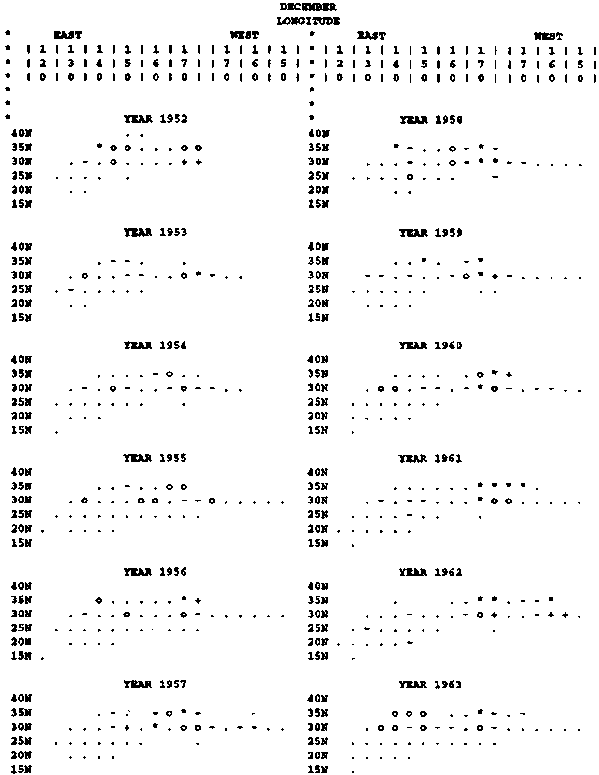
Figure 22 b.
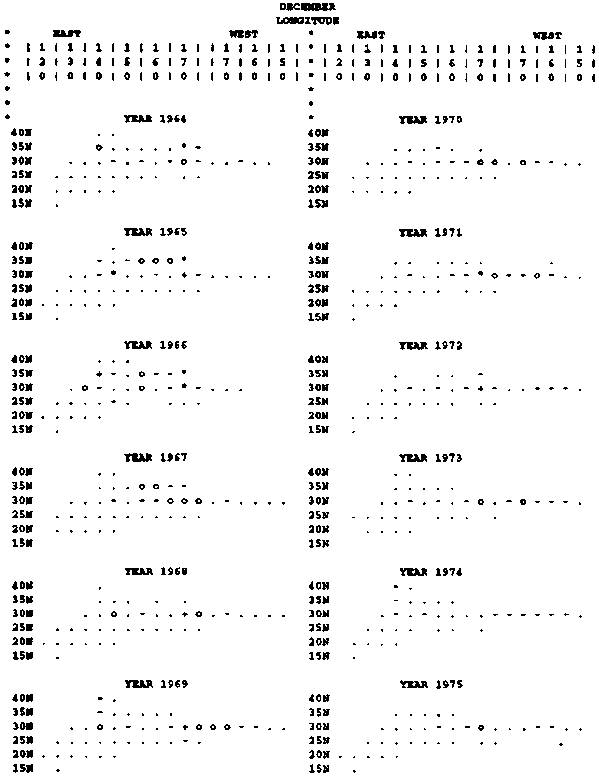
Figure 22 c.
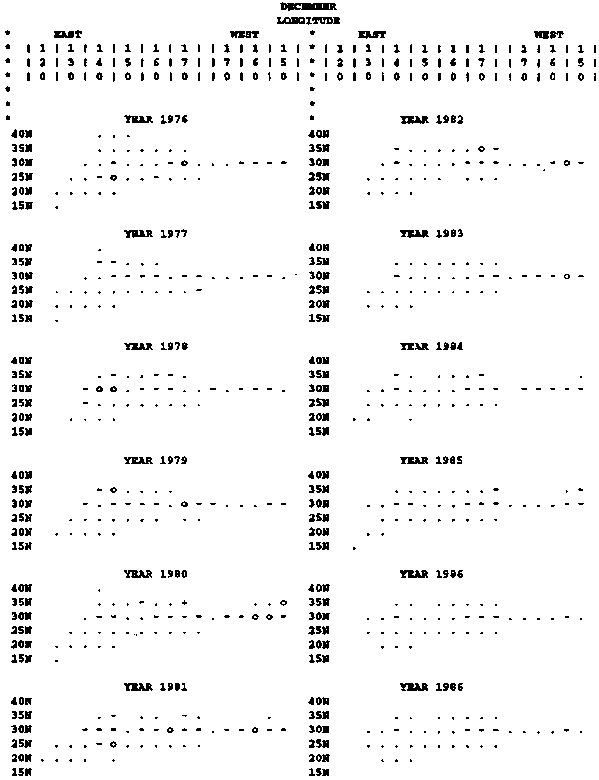
Table 1. Japanese longline catches in number of northern bluefin tuna from the core area and the entire Pacific Ocean.
|
YEAR |
CORE CATCH |
ENTIRE CATCH |
DIFF. |
% DIFF. = |
|
52 |
23853 |
24012 |
159 |
0.662 |
|
53 |
22098 |
22336 |
238 |
1.066 |
|
54 |
24125 |
24472 |
347 |
1.418 |
|
55 |
23064 |
23268 |
204 |
0.877 |
|
56 |
21293 |
22845 |
1552 |
6.794 |
|
57 |
10598 |
11006 |
408 |
3.707 |
|
58 |
6480 |
6684 |
204 |
3.052 |
|
59 |
27741 |
32604 |
4863 |
14.915 |
|
60 |
50599 |
51926 |
1327 |
2.556 |
|
61 |
50755 |
53833 |
3078 |
5.718 |
|
62 |
42970 |
45715 |
2745 |
6.005 |
|
63 |
40690 |
44222 |
3532 |
7.987 |
|
64 |
19755 |
20706 |
951 |
4.593 |
|
65 |
15342 |
17314 |
1972 |
11.390 |
|
66 |
7432 |
9006 |
1574 |
17.477 |
|
67 |
5788 |
6216 |
428 |
6.885 |
|
68 |
3568 |
3756 |
188 |
5.005 |
|
69 |
2588 |
2862 |
274 |
9.574 |
|
70 |
1628 |
1826 |
198 |
10.843 |
|
71 |
1733 |
2030 |
297 |
14.631 |
|
72 |
615 |
801 |
186 |
23.221 |
|
73 |
596 |
1030 |
434 |
42.136 |
|
74 |
583 |
892 |
309 |
34.641 |
|
75 |
342 |
1440 |
1098 |
76.250 |
|
76 |
478 |
1149 |
671 |
58.399 |
|
77 |
2105 |
2275 |
170 |
7.473 |
|
78 |
3034 |
3099 |
65 |
2.097 |
|
79 |
1958 |
2237 |
279 |
12.472 |
|
80 |
871 |
1216 |
345 |
28.372 |
|
81 |
2336 |
2576 |
240 |
9.317 |
|
82 |
2290 |
2437 |
147 |
6.032 |
|
83 |
776 |
882 |
106 |
12.018 |
|
84 |
570 |
748 |
178 |
23.797 |
|
85 |
324 |
412 |
88 |
21.359 |
|
86 |
295 |
395 |
100 |
25.316 |
|
YEAR |
JAN. |
FEB. |
MAR. |
APR. |
MAY |
JUNE |
JULY |
AUG. |
SEP. |
OCT. |
NOV. |
DEC. |
|
52 |
1211 |
277 |
105 |
613 |
7865 |
1961 |
2280 |
6224 |
2188 |
238 |
250 |
800 |
|
53 |
640 |
602 |
70 |
678 |
8818 |
5039 |
866 |
1808 |
2117 |
1061 |
439 |
198 |
|
54 |
760 |
411 |
554 |
1127 |
8144 |
2533 |
3759 |
3250 |
2729 |
840 |
273 |
92 |
|
55 |
351 |
537 |
408 |
2116 |
5724 |
1572 |
298 |
5660 |
3833 |
2123 |
510 |
136 |
|
56 |
235 |
184 |
437 |
2470 |
3662 |
1069 |
546 |
9437 |
3648 |
635 |
253 |
269 |
|
57 |
227 |
331 |
482 |
1886 |
2679 |
601 |
1181 |
2592 |
294 |
36 |
87 |
610 |
|
58 |
273 |
294 |
459 |
1023 |
765 |
461 |
17 |
101 |
1014 |
648 |
873 |
756 |
|
59 |
1014 |
1255 |
1183 |
4960 |
3707 |
3673 |
2021 |
3715 |
2967 |
1528 |
2845 |
3736 |
|
60 |
1061 |
704 |
3554 |
17384 |
10115 |
7119 |
873 |
1427 |
2781 |
1665 |
4532 |
711 |
|
61 |
1136 |
1306 |
3844 |
10297 |
15398 |
4369 |
3752 |
3433 |
4983 |
1514 |
1784 |
2017 |
|
62 |
1668 |
1355 |
2672 |
10719 |
16791 |
5206 |
669 |
1075 |
2057 |
627 |
1009 |
1867 |
|
63 |
884 |
382 |
2100 |
14799 |
18342 |
1949 |
335 |
2237 |
1497 |
589 |
425 |
683 |
|
64 |
581 |
176 |
1066 |
5603 |
7672 |
1676 |
227 |
772 |
1251 |
483 |
685 |
514 |
|
65 |
258 |
366 |
1369 |
3356 |
5988 |
2901 |
175 |
276 |
532 |
610 |
888 |
595 |
|
66 |
91 |
134 |
439 |
1432 |
2269 |
1083 |
593 |
397 |
866 |
940 |
367 |
395 |
|
67 |
387 |
226 |
548 |
871 |
1463 |
406 |
148 |
592 |
987 |
247 |
187 |
154 |
|
68 |
119 |
321 |
752 |
398 |
589 |
322 |
168 |
254 |
367 |
179 |
146 |
141 |
|
69 |
183 |
172 |
244 |
223 |
526 |
174 |
152 |
274 |
396 |
204 |
103 |
211 |
|
70 |
99 |
128 |
112 |
201 |
438 |
316 |
107 |
29 |
60 |
45 |
215 |
76 |
|
71 |
251 |
438 |
449 |
54 |
265 |
197 |
30 |
22 |
53 |
70 |
48 |
153 |
|
72 |
160 |
73 |
46 |
58 |
86 |
89 |
26 |
30 |
33 |
14 |
80 |
106 |
|
73 |
160 |
73 |
119 |
61 |
72 |
265 |
36 |
44 |
40 |
43 |
45 |
72 |
|
74 |
35 |
21 |
38 |
40 |
116 |
170 |
71 |
102 |
150 |
45 |
65 |
39 |
|
75 |
120 |
34 |
28 |
33 |
91 |
121 |
32 |
200 |
438 |
295 |
19 |
29 |
|
76 |
224 |
56 |
87 |
80 |
186 |
118 |
47 |
220 |
33 |
19 |
20 |
59 |
|
77 |
155 |
460 |
453 |
722 |
131 |
76 |
23 |
3 |
178 |
36 |
2 |
36 |
|
78 |
71 |
246 |
526 |
203 |
101 |
43 |
15 |
175 |
1607 |
35 |
13 |
64 |
|
79 |
123 |
130 |
241 |
304 |
98 |
182 |
63 |
172 |
720 |
99 |
48 |
57 |
|
80 |
143 |
51 |
109 |
179 |
251 |
82 |
54 |
50 |
29 |
25 |
80 |
163 |
|
81 |
373 |
412 |
677 |
274 |
81 |
62 |
26 |
247 |
133 |
63 |
130 |
98 |
|
82 |
151 |
293 |
193 |
162 |
206 |
424 |
740 |
87 |
40 |
37 |
39 |
65 |
|
83 |
99 |
121 |
219 |
145 |
46 |
90 |
16 |
28 |
16 |
17 |
33 |
52 |
|
84 |
175 |
133 |
180 |
10 |
32 |
17 |
44 |
54 |
37 |
16 |
16 |
34 |
|
85 |
84 |
78 |
74 |
23 |
9 |
27 |
28 |
18 |
13 |
18 |
20 |
20 |
|
86 |
83 |
70 |
56 |
15 |
8 |
66 |
31 |
18 |
12 |
10 |
13 |
13 |
|
AVG |
388 |
339 |
683 |
2358 |
3507 |
1270 |
556 |
1286 |
1089 |
430 |
473 |
429 |
|
YEAR |
JAN. |
FEB. |
MAR. |
APR. |
MAY |
JUNE |
JULY |
AUG. |
SEP. |
OCT. |
NOV. |
DEC. |
|
52 |
1211 |
277 |
105 |
598 |
7839 |
1941 |
2226 |
6195 |
2183 |
238 |
250 |
790 |
|
53 |
620 |
602 |
67 |
669 |
8785 |
5019 |
832 |
1757 |
2066 |
1044 |
439 |
198 |
|
54 |
660 |
383 |
550 |
1075 |
8126 |
2511 |
3704 |
3238 |
2718 |
821 |
262 |
77 |
|
55 |
342 |
534 |
408 |
2075 |
5695 |
1565 |
261 |
5628 |
3805 |
2111 |
504 |
136 |
|
56 |
233 |
184 |
427 |
2398 |
3655 |
1040 |
517 |
8868 |
3078 |
569 |
57 |
267 |
|
57 |
225 |
331 |
431 |
1837 |
2661 |
574 |
1164 |
2374 |
285 |
28 |
80 |
608 |
|
58 |
261 |
292 |
457 |
1015 |
760 |
439 |
4 |
20 |
975 |
640 |
865 |
752 |
|
59 |
811 |
1225 |
1179 |
4938 |
3645 |
3651 |
829 |
533 |
2930 |
1446 |
2818 |
3736 |
|
60 |
1061 |
689 |
3552 |
17366 |
10092 |
7102 |
382 |
1015 |
2542 |
1628 |
4461 |
709 |
|
61 |
1131 |
987 |
3827 |
10201 |
15378 |
3951 |
3604 |
2655 |
3725 |
1506 |
1778 |
2012 |
|
62 |
1625 |
1148 |
2594 |
10462 |
16682 |
5092 |
414 |
599 |
985 |
585 |
1000 |
1784 |
|
63 |
831 |
346 |
2041 |
14698 |
18308 |
1629 |
101 |
140 |
1189 |
381 |
369 |
657 |
|
64 |
576 |
176 |
1020 |
5484 |
7624 |
1634 |
104 |
422 |
1131 |
423 |
669 |
492 |
|
65 |
170 |
269 |
1327 |
3209 |
5591 |
2702 |
52 |
46 |
400 |
539 |
444 |
593 |
|
66 |
72 |
134 |
425 |
1060 |
2151 |
835 |
120 |
192 |
808 |
898 |
362 |
375 |
|
67 |
386 |
222 |
546 |
833 |
1389 |
331 |
16 |
525 |
969 |
245 |
183 |
143 |
|
68 |
119 |
287 |
749 |
385 |
570 |
278 |
126 |
236 |
361 |
173 |
144 |
140 |
|
69 |
181 |
166 |
232 |
188 |
472 |
156 |
107 |
231 |
364 |
179 |
103 |
209 |
|
70 |
96 |
124 |
81 |
197 |
424 |
308 |
17 |
15 |
54 |
34 |
204 |
74 |
|
71 |
240 |
371 |
436 |
52 |
232 |
129 |
2 |
2 |
28 |
51 |
47 |
143 |
|
72 |
136 |
39 |
46 |
40 |
73 |
58 |
7 |
2 |
27 |
11 |
77 |
99 |
|
73 |
143 |
56 |
118 |
51 |
46 |
37 |
4 |
6 |
16 |
14 |
42 |
63 |
|
74 |
30 |
20 |
31 |
22 |
77 |
62 |
38 |
80 |
125 |
20 |
46 |
32 |
|
75 |
120 |
19 |
20 |
23 |
37 |
16 |
7 |
21 |
32 |
8 |
14 |
25 |
|
76 |
45 |
24 |
44 |
35 |
35 |
7 |
5 |
184 |
5 |
18 |
19 |
57 |
|
77 |
133 |
441 |
447 |
716 |
103 |
16 |
3 |
2 |
173 |
33 |
2 |
36 |
|
78 |
68 |
242 |
522 |
199 |
99 |
28 |
6 |
161 |
1600 |
33 |
12 |
64 |
|
79 |
115 |
89 |
238 |
287 |
70 |
130 |
1 |
145 |
687 |
96 |
44 |
56 |
|
80 |
143 |
35 |
102 |
146 |
106 |
58 |
30 |
0 |
10 |
12 |
79 |
150 |
|
81 |
362 |
360 |
655 |
258 |
44 |
39 |
3 |
222 |
110 |
59 |
128 |
96 |
|
82 |
148 |
286 |
184 |
159 |
188 |
413 |
721 |
20 |
35 |
37 |
39 |
60 |
|
83 |
81 |
94 |
214 |
140 |
41 |
82 |
7 |
16 |
8 |
17 |
28 |
48 |
|
84 |
170 |
117 |
178 |
10 |
5 |
9 |
4 |
10 |
6 |
16 |
16 |
29 |
|
85 |
73 |
73 |
71 |
22 |
7 |
11 |
3 |
2 |
6 |
18 |
19 |
19 |
|
86 |
80 |
67 |
55 |
12 |
3 |
27 |
0 |
4 |
12 |
9 |
13 |
13 |
|
AVG |
363 |
306 |
668 |
2310 |
3458 |
1197 |
441 |
1016 |
956 |
398 |
446 |
421 |
|
YEAR |
JAN. |
FEB. |
MAR. |
APR. |
MAY |
JUNE |
JULY |
AUG. |
SEP. |
OCT. |
NOV. |
DEC. |
|
52 |
17253 |
13048 |
6278 |
5065 |
6390 |
1607 |
2354 |
4338 |
2681 |
4009 |
6686 |
9060 |
|
53 |
15815 |
20780 |
4544 |
2264 |
7190 |
3995 |
1873 |
1897 |
2074 |
4361 |
6893 |
12059 |
|
54 |
14640 |
19319 |
17421 |
7914 |
8230 |
5848 |
2850 |
2266 |
2605 |
3771 |
4925 |
8140 |
|
55 |
14468 |
16626 |
15809 |
10539 |
9133 |
3098 |
364 |
2127 |
3747 |
4723 |
8870 |
11818 |
|
56 |
13963 |
15107 |
16367 |
9945 |
8129 |
4486 |
348 |
739 |
2796 |
5591 |
9827 |
9018 |
|
57 |
14497 |
16868 |
14142 |
8181 |
6146 |
3110 |
355 |
1141 |
2413 |
3619 |
7521 |
13621 |
|
58 |
18609 |
14059 |
11809 |
8568 |
6499 |
3469 |
450 |
1113 |
3561 |
7555 |
12365 |
11206 |
|
59 |
13620 |
13455 |
14129 |
6412 |
5823 |
4463 |
3299 |
2967 |
9492 |
8874 |
12051 |
12183 |
|
60 |
17197 |
17919 |
15242 |
9580 |
8534 |
5906 |
3358 |
2449 |
9096 |
12078 |
12803 |
15312 |
|
61 |
17312 |
15643 |
16157 |
11075 |
9133 |
6099 |
6462 |
6121 |
5142 |
7451 |
11638 |
12250 |
|
62 |
13151 |
13348 |
14524 |
8264 |
7083 |
3216 |
863 |
1627 |
5149 |
5862 |
8898 |
8156 |
|
63 |
8939 |
9824 |
11629 |
10569 |
7089 |
1371 |
565 |
1033 |
4024 |
7620 |
10594 |
15655 |
|
64 |
10063 |
8978 |
9974 |
6696 |
5871 |
2787 |
1375 |
2917 |
5787 |
7571 |
5341 |
5140 |
|
65 |
8572 |
9381 |
9062 |
6120 |
5591 |
3337 |
2895 |
5035 |
7845 |
8808 |
8543 |
8050 |
|
66 |
8300 |
10694 |
10679 |
5917 |
4319 |
2702 |
3059 |
4973 |
7964 |
10485 |
9983 |
9918 |
|
67 |
14449 |
14944 |
16990 |
7504 |
4555 |
2259 |
1476 |
5368 |
9323 |
13524 |
14733 |
12702 |
|
68 |
14168 |
13149 |
11666 |
4626 |
2892 |
2255 |
2436 |
3017 |
6613 |
10351 |
13233 |
12156 |
|
69 |
15191 |
13415 |
11167 |
3470 |
2261 |
2162 |
2739 |
2510 |
6472 |
8278 |
12675 |
11406 |
|
70 |
11093 |
8677 |
6416 |
2756 |
1953 |
1999 |
2119 |
1958 |
4076 |
8917 |
9459 |
10928 |
|
71 |
10273 |
8111 |
7672 |
2161 |
1551 |
1834 |
1611 |
1817 |
5633 |
9212 |
8888 |
9528 |
|
72 |
9121 |
6247 |
3640 |
1903 |
1568 |
1453 |
1062 |
999 |
3641 |
5388 |
9010 |
7900 |
|
73 |
6447 |
5111 |
3594 |
2053 |
2084 |
1765 |
1534 |
1169 |
3650 |
5194 |
8886 |
8667 |
|
74 |
5965 |
3672 |
3206 |
2120 |
1522 |
1297 |
1208 |
1864 |
5269 |
6917 |
8598 |
7939 |
|
75 |
5397 |
3354 |
3191 |
2057 |
1911 |
1630 |
2026 |
1413 |
4700 |
5165 |
6646 |
10002 |
|
76 |
8543 |
6581 |
4748 |
2091 |
1736 |
1949 |
1656 |
2188 |
5025 |
8154 |
10570 |
12990 |
|
77 |
10970 |
8114 |
5215 |
2676 |
2406 |
2292 |
2388 |
1644 |
4737 |
6157 |
8854 |
10408 |
|
78 |
9245 |
7304 |
5579 |
3442 |
2504 |
2438 |
2383 |
980 |
3895 |
7308 |
8808 |
12356 |
|
79 |
12614 |
8856 |
5592 |
3616 |
2865 |
2779 |
2549 |
1207 |
5086 |
7406 |
9276 |
11719 |
|
80 |
7580 |
5597 |
4972 |
4164 |
2865 |
2252 |
2402 |
851 |
4712 |
8102 |
9239 |
13151 |
|
81 |
12457 |
7682 |
6931 |
4389 |
3353 |
2698 |
2269 |
1128 |
5946 |
7667 |
9178 |
13151 |
|
82 |
12887 |
7401 |
5370 |
3445 |
2790 |
2344 |
2194 |
3305 |
5501 |
5523 |
7322 |
9943 |
|
83 |
9600 |
7768 |
7062 |
5011 |
3700 |
3276 |
2532 |
1940 |
4394 |
6041 |
9239 |
11677 |
|
84 |
9488 |
7432 |
5762 |
3115 |
3177 |
2803 |
2446 |
3697 |
6040 |
7767 |
10120 |
11852 |
|
85 |
10558 |
8234 |
6901 |
4582 |
3696 |
3544 |
3251 |
3408 |
5239 |
6287 |
9468 |
12986 |
|
86 |
11311 |
7296 |
6424 |
5435 |
3952 |
3703 |
3359 |
2641 |
6719 |
7726 |
9907 |
10190 |
|
AVG |
11822 |
10686 |
9139 |
5364 |
4529 |
2921 |
2117 |
2396 |
5173 |
7242 |
9458 |
10950 |
|
YEAR |
MO. |
AREA |
CATCH |
MO. |
AREA |
HOOKS |
|
1952 |
AUG |
140 E 35 N |
4571 |
FEB |
140 E 30 N |
3010309 |
|
1953 |
MAY |
125 E 20 N |
4332 |
FEB |
140 E 30 N |
5712033 |
|
1954 |
MAY |
130 E 20 N |
2777 |
MAR |
140 E 30 N |
6754806 |
|
1955 |
AUG |
140 E 40 N |
4695 |
FEB |
140 E 30 N |
4918182 |
|
1956 |
AUG |
140 E 40 N |
8785 |
JAN |
160 E 30 N |
2859595 |
|
1957 |
AUG |
140 E 35 N |
1495 |
MAR |
140 E 30 N |
2896375 |
|
1958 |
SEP |
170 E 40 N |
517 |
FEB |
140 E 30 N |
3244643 |
|
1959 |
APR |
135 E 30 N |
3707 |
MAR |
135 E 30 N |
3877797 |
|
1960 |
APR |
135 E 30 N |
14505 |
APR |
135 E 30 N |
3983831 |
|
1961 |
APR |
135 E 30 N |
6612 |
APR |
135 E 30 N |
4178016 |
|
1962 |
APR |
135 E 25 N |
5491 |
APR |
135 E 30 N |
2897219 |
|
1963 |
MAY |
125 E 20 N |
12733 |
MAR |
135 E 30 N |
4882053 |
|
1964 |
MAY |
125 E 20 N |
2970 |
APR |
135 E 30 N |
2892769 |
|
1965 |
MAY |
125 E 20 N |
2102 |
FEB |
140 E 30 N |
1996443 |
|
1966 |
MAY |
125 E 25 N |
798 |
OCT |
155 E 35 N |
4002019 |
|
1967 |
MAY |
130 E 25 N |
470 |
OCT |
150 E 35 N |
4394869 |
|
1968 |
MAR |
170 E 30 N |
571 |
OCT |
155 E 35 N |
2924598 |
|
1969 |
MAY |
125 E 25 N |
168 |
NOV |
150 E 30 N |
2486019 |
|
1970 |
JUNE |
135 E 30 N |
184 |
NOV |
150 E 30 N |
2250384 |
|
1971 |
MAR |
170 E 30 N |
310 |
MAR |
170 E 45 S |
3224520 |
|
1972 |
DEC |
170 E 30 N |
73 |
MAR |
170 E 45 S |
3273213 |
|
1973 |
JUNE |
175 E 35 S |
174 |
JULY |
150 E 35 S |
2034063 |
|
1974 |
JUNE |
175 E 35 S |
84 |
FEB |
170 E 45 S |
1914188 |
|
1975 |
SEP |
140 E 45 N |
405 |
MAR |
170 E 45 S |
2596276 |
|
1976 |
AUG |
140 E 40 N |
182 |
MAR |
170 E 45 S |
3336438 |
|
1977 |
APR |
135 E 30 N |
703 |
MAR |
170 E 45 S |
3920323 |
|
1978 |
SEP |
155 E 40 N |
1230 |
OCT |
160 E 35 N |
2084425 |
|
1979 |
SEP |
155 E 40 N |
509 |
MAR |
170 E 45 S |
3835096 |
|
1980 |
APR |
135 E 30 N |
88 |
MAR |
170 E 45 S |
4460543 |
|
1981 |
MAR |
140 E 35 N |
365 |
APR |
170 E 45 S |
3947549 |
|
1982 |
JULY |
145 E 30 N |
408 |
JULY |
175 E 35 S |
3220419 |
|
1983 |
MAR |
140 E 30 N |
167 |
MAY |
80 W 0 N |
2896969 |
|
1984 |
JAN |
140 E 30 N |
132 |
APR |
170 E 45 S |
2396459 |
|
1985 |
MAR |
140 E 35 N |
34 |
DEC |
140 E 30 N |
2526485 |
|
1986 |
JAN |
140 E 30 N |
36 |
DEC |
140 E 30 N |
2545577 |
|
YEAR |
JAN. |
FEB. |
MAR. |
APR |
MAY |
JUNE |
JULY |
AUG. |
SEP. |
OCT. |
NOV. |
DEC. |
|
1952 |
9 |
9 |
5 |
10 |
17 |
10 |
5 |
6 |
4 |
8 |
11 |
9 |
|
1953 |
11 |
18 |
4 |
12 |
16 |
18 |
7 |
8 |
5 |
7 |
13 |
9 |
|
1954 |
10 |
17 |
9 |
15 |
17 |
20 |
3 |
4 |
8 |
15 |
14 |
9 |
|
1955 |
14 |
13 |
13 |
12 |
18 |
15 |
5 |
12 |
14 |
10 |
10 |
9 |
|
1956 |
10 |
12 |
9 |
15 |
14 |
11 |
6 |
5 |
6 |
10 |
5 |
7 |
|
1957 |
12 |
16 |
12 |
19 |
10 |
8 |
4 |
3 |
8 |
7 |
7 |
13 |
|
1958 |
13 |
16 |
13 |
14 |
7 |
8 |
1 |
5 |
9 |
11 |
11 |
15 |
|
1959 |
13 |
17 |
19 |
17 |
11 |
14 |
7 |
14 |
12 |
16 |
15 |
11 |
|
1960 |
18 |
20 |
24 |
21 |
19 |
18 |
10 |
9 |
14 |
14 |
11 |
13 |
|
1961 |
11 |
14 |
24 |
19 |
19 |
18 |
12 |
13 |
15 |
11 |
12 |
11 |
|
1962 |
13 |
21 |
23 |
21 |
16 |
16 |
12 |
9 |
12 |
16 |
13 |
15 |
|
1963 |
16 |
19 |
20 |
21 |
13 |
12 |
6 |
7 |
12 |
10 |
11 |
20 |
|
1964 |
15 |
13 |
13 |
16 |
16 |
17 |
13 |
8 |
9 |
11 |
7 |
10 |
|
1965 |
11 |
22 |
19 |
21 |
23 |
21 |
14 |
11 |
13 |
12 |
16 |
11 |
|
1966 |
9 |
14 |
19 |
20 |
17 |
12 |
11 |
12 |
14 |
12 |
18 |
14 |
|
1967 |
17 |
19 |
23 |
22 |
15 |
9 |
6 |
11 |
12 |
9 |
9 |
12 |
|
1968 |
7 |
13 |
15 |
14 |
12 |
8 |
4 |
8 |
10 |
11 |
11 |
6 |
|
1969 |
9 |
10 |
13 |
15 |
8 |
7 |
4 |
9 |
12 |
5 |
8 |
12 |
|
1970 |
14 |
12 |
11 |
6 |
8 |
10 |
4 |
3 |
8 |
6 |
10 |
10 |
|
1971 |
9 |
12 |
13 |
6 |
8 |
5 |
1 |
1 |
7 |
9 |
6 |
9 |
|
1972 |
10 |
7 |
4 |
7 |
5 |
3 |
2 |
1 |
3 |
3 |
5 |
10 |
|
1973 |
7 |
5 |
8 |
5 |
5 |
6 |
2 |
3 |
4 |
3 |
11 |
9 |
|
1974 |
4 |
7 |
5 |
6 |
6 |
3 |
2 |
7 |
6 |
5 |
10 |
10 |
|
1975 |
5 |
3 |
4 |
7 |
7 |
4 |
1 |
4 |
3 |
2 |
2 |
5 |
|
1976 |
7 |
5 |
8 |
5 |
6 |
4 |
3 |
3 |
2 |
6 |
8 |
10 |
|
1977 |
15 |
14 |
7 |
9 |
5 |
4 |
3 |
1 |
7 |
7 |
2 |
11 |
|
1978 |
13 |
9 |
4 |
7 |
7 |
4 |
1 |
3 |
8 |
4 |
4 |
14 |
|
1979 |
16 |
15 |
7 |
9 |
12 |
11 |
1 |
4 |
7 |
9 |
8 |
14 |
|
1980 |
11 |
9 |
10 |
9 |
8 |
5 |
3 |
0 |
5 |
3 |
12 |
14 |
|
1981 |
19 |
18 |
12 |
14 |
7 |
8 |
1 |
5 |
8 |
11 |
19 |
18 |
|
1982 |
22 |
16 |
11 |
11 |
10 |
10 |
7 |
5 |
9 |
11 |
7 |
12 |
|
1983 |
15 |
9 |
12 |
8 |
7 |
3 |
3 |
4 |
4 |
6 |
11 |
8 |
|
1984 |
11 |
13 |
8 |
5 |
2 |
3 |
3 |
5 |
4 |
6 |
11 |
11 |
|
1985 |
14 |
11 |
7 |
8 |
4 |
4 |
2 |
1 |
3 |
4 |
9 |
9 |
|
1986 |
8 |
11 |
9 |
6 |
1 |
4 |
0 |
2 |
5 |
3 |
7 |
5 |
|
AVG |
12 |
13 |
12 |
12 |
11 |
10 |
5 |
6 |
8 |
8 |
10 |
11 |
|
YEAR |
JAN. |
FEB. |
MAR. |
APR |
MAY |
JUNE |
JULY |
AUG. |
SEP. |
OCT. |
NOV. |
DEC. |
|
1952 |
26 |
27 |
28 |
25 |
25 |
16 |
11 |
13 |
16 |
19 |
26 |
27 |
|
1953 |
27 |
27 |
24 |
18 |
24 |
27 |
22 |
15 |
14 |
25 |
32 |
27 |
|
1954 |
29 |
26 |
27 |
30 |
25 |
25 |
20 |
15 |
22 |
32 |
33 |
33 |
|
1955 |
37 |
38 |
36 |
33 |
26 |
25 |
19 |
22 |
30 |
37 |
40 |
39 |
|
1956 |
37 |
35 |
33 |
30 |
30 |
24 |
18 |
16 |
29 |
41 |
42 |
39 |
|
1957 |
39 |
37 |
29 |
26 |
23 |
19 |
12 |
20 |
28 |
33 |
38 |
35 |
|
1958 |
35 |
31 |
27 |
29 |
22 |
21 |
13 |
24 |
24 |
30 |
32 |
35 |
|
1959 |
34 |
27 |
29 |
27 |
24 |
22 |
21 |
23 |
38 |
41 |
39 |
34 |
|
1960 |
34 |
36 |
35 |
30 |
28 |
33 |
22 |
21 |
29 |
39 |
39 |
37 |
|
1961 |
40 |
31 |
33 |
30 |
26 |
30 |
27 |
25 |
25 |
35 |
39 |
42 |
|
1962 |
37 |
33 |
41 |
34 |
23 |
26 |
22 |
17 |
27 |
42 |
47 |
41 |
|
1963 |
36 |
37 |
37 |
29 |
22 |
19 |
21 |
23 |
31 |
41 |
44 |
49 |
|
1964 |
39 |
34 |
32 |
26 |
26 |
25 |
30 |
21 |
33 |
43 |
48 |
44 |
|
1965 |
35 |
40 |
40 |
30 |
32 |
35 |
33 |
37 |
38 |
42 |
51 |
43 |
|
1966 |
43 |
34 |
32 |
29 |
30 |
31 |
27 |
28 |
37 |
47 |
42 |
41 |
|
1967 |
38 |
36 |
31 |
33 |
27 |
28 |
31 |
31 |
39 |
43 |
44 |
46 |
|
1968 |
40 |
35 |
33 |
26 |
21 |
23 |
28 |
26 |
35 |
35 |
50 |
45 |
|
1969 |
41 |
34 |
31 |
26 |
23 |
19 |
31 |
22 |
42 |
35 |
43 |
45 |
|
1970 |
42 |
34 |
26 |
22 |
19 |
26 |
31 |
26 |
35 |
41 |
40 |
42 |
|
1971 |
43 |
39 |
41 |
21 |
18 |
27 |
24 |
20 |
32 |
38 |
38 |
39 |
|
1972 |
39 |
37 |
31 |
26 |
19 |
18 |
21 |
20 |
20 |
26 |
36 |
41 |
|
1973 |
37 |
33 |
34 |
25 |
22 |
27 |
22 |
19 |
26 |
28 |
42 |
38 |
|
1974 |
35 |
34 |
26 |
21 |
20 |
19 |
21 |
18 |
23 |
29 |
38 |
35 |
|
1975 |
37 |
30 |
30 |
24 |
22 |
21 |
18 |
14 |
19 |
20 |
31 |
36 |
|
1976 |
34 |
36 |
38 |
25 |
26 |
26 |
27 |
26 |
32 |
43 |
46 |
42 |
|
1977 |
35 |
32 |
34 |
28 |
19 |
21 |
29 |
22 |
31 |
37 |
38 |
38 |
|
1978 |
33 |
29 |
29 |
21 |
27 |
22 |
21 |
11 |
32 |
30 |
35 |
35 |
|
1979 |
29 |
26 |
25 |
24 |
28 |
26 |
26 |
23 |
30 |
36 |
37 |
38 |
|
1980 |
34 |
27 |
27 |
24 |
23 |
20 |
16 |
16 |
27 |
35 |
41 |
42 |
|
1981 |
35 |
35 |
35 |
30 |
30 |
30 |
27 |
24 |
36 |
44 |
48 |
40 |
|
1982 |
35 |
35 |
31 |
29 |
24 |
21 |
19 |
22 |
28 |
33 |
35 |
39 |
|
1983 |
33 |
32 |
25 |
26 |
26 |
23 |
24 |
22 |
32 |
33 |
40 |
37 |
|
1984 |
35 |
34 |
29 |
24 |
23 |
25 |
20 |
25 |
36 |
32 |
34 |
36 |
|
1985 |
35 |
33 |
34 |
24 |
17 |
14 |
18 |
23 |
25 |
28 |
37 |
38 |
|
1986 |
33 |
36 |
33 |
26 |
14 |
15 |
21 |
25 |
31 |
32 |
36 |
36 |
|
AVG |
36 |
33 |
32 |
27 |
24 |
24 |
23 |
22 |
29 |
35 |
39 |
39 |