1.1 Rationale
1.2 Pulp and Paper Industry
1.3 Panels
1.4 Estimated wood raw material requirement and availability
Wood fibre is admittedly the most favoured raw material for pulp and paper as well as panels. In view of diminishing forest resources and limitations on enlarging man made forests, non wood fibre sources have gained importance. In the context of increasing demand on paper and panels on the one hand and declining forest resources on the other hand, it is inevitable that dependence on non wood fibre sources will grow further.
Bamboo, although a non wood fibre source, being largely a forest based resource, is beset with the same constraints as wood resource and therefore will be treated along with wood. The requirement of raw material to meet the current and projected (up to year 2010) demand of paper and panels will be assessed in terms of wood fibre, its availability examined and strategies adopted and to meet the requirement discussed. In view of the large gap between demand and supply of wood, the policy interventions to utilize the varied non wood fibre sources in India as well as recycled fibre will be explained and the future role of these resources in the context of inadequate wood fibre supplies, will be discussed. The pulp paper and panels industries will be dealt with separately for this purpose.
1.2.1 Current installed capacity, production and demand
1.2.2 Estimated future demand of paper and newsprint
1.2.3 Raw material requirement
The per capita consumption of paper in India is 3.6 kg, which is far below the world average of 45.6 kg. Although India accounts for 16% of world's population, it consumes only about 1.2% of paper, paper boards and newsprint produced in the world. The first paper mill in India was established in 1867 and the raw materials utilized were rags and waste paper. Commercial scale production was started in 1882 and the raw materials were again non wood fibres, viz., Eulaliopsis binata and Sacharum bengalense. With the advent of fractional process of pulping bamboo developed at the Forest Research Institute, Dehra Dun during 1922-24, pulp and paper industry in India received an impetus and bamboo became the main raw material for making various grades of paper (Singh et al, 1992).
The installed capacity of Indian paper industry in 1995 was as follows:
|
Paper and Paperboard |
3.95 million tonnes |
|
Newsprint |
0.40 million tonnes |
|
Total |
4.35 million tonnes |
This is exclusive of the unregistered capacity of hand made paper spread over some 400 tiny units. The industry has remained highly fragmented and the present number of mills is 380. The size varies from less than 5,000 tonnes per annum (TPA) to over 100,000 TPA. The distribution is as follows (Singhania, 1996).
Table 1 - Indian Paper Mills: Distribution of capacities (excluding newsprint)
|
Size in TPA |
Number |
Percentage of total production |
|
50,000 and more |
13 |
33.0 |
|
20,000 - 50,000 |
25 |
17.4 |
|
10,000 - 20,000 |
27 |
12.2 |
|
5,000 - 10,000 |
118 |
25.1 |
|
Below 5,000 |
197 |
12.3 |
|
Total |
380 |
100 |
There are only 4 mills of over 100,000 TPA capacity and the average size is 10,400 TPA (compared with 85,000 TPA in Asia and 300,000 TPA in Europe/America). 315 mills have capacity less than 10,000 TPA and account for nearly 50% production. The size has been a major factor favourable to utilization of non wood fibre raw material, which is highly dispersed.
The production in 1995 was 2.54 million tonnes, including 0.3 million tonnes newsprint. The consumption during the same period was 2.54 million tonnes of paper and 0.69 million tonnes of newsprint. The additional demand was met by imports.
The scenario in 1995
(Figures in million tonnes)
|
|
Paper and Paperboard |
Newsprint |
Total |
|
Installed capacity |
3.95 |
0.4 |
4.35 |
|
Production |
2.51 |
0.3 |
2.81 |
|
Consumption |
2.54 |
0.69 |
3.23 |
|
Import |
0.03 |
0.39 |
0.42 |
|
Capacity utilization |
64% |
75% |
65% |
The growth in capacity establishment and production in respect of Paper and Paperboards is shown in Table 2 (JCPI, 1996).
Table 2 - Growth in capacity establishment and production
|
Year |
No. of units |
Installed capacity (million tonnes) |
Production (million tonnes) |
|
1950-51 |
17 |
0.13 |
0.11 |
|
1960-61 |
25 |
0.40 |
0.34 |
|
1970-71 |
57 |
0.77 |
0.75 |
|
1980-81 |
135 |
1.65 |
1.11 |
|
1989-90 |
317 |
3.23 |
1.87 |
|
1990-91 |
325 |
3.30 |
2.06 |
|
1991-92 |
326 |
3.36 |
2.11 |
|
1992-93 |
340 |
3.55 |
2.12 |
|
1993-94 |
380 |
3.79 |
2.32 |
|
1994-95 |
380 |
3.95 |
2.51 |
There was a sharp increase in capacity in the eighties as a result of Government allowing import of second hand machines to manufacture paper from what was termed as unconventional raw materials (non wood and non bamboo). It increased rapidly in early nineties, when the process of liberalization of the economy started in India and mills based on unconventional raw materials (non wood and non bamboo) were taken out of the purview of licensing. The effective capacity utilization was more than what is implied in columns 3 and 4 of above Table, as actual capacity was lower than installed capacity due to non operation of about 130 units for various reasons, chiefly, non availability of raw material.
The composition of demand for paper was as follows: Industrial Paper: 50.30%; Cultural Paper: 44.75%; and Speciality Paper: 4.95%.
Early Projections
Several estimates have been made on future demand for Paper, Paperboard and Newsprint. A brief resume is attempted below.
A comprehensive study to estimate demand for pulp and paper, panel products, fuelwood, etc., was carried out in the Planning Commission by Prof. G.R. Gregory, a Ford Foundation Consultant in the early Seventies. Largely based on the sectoral analysis of forest and forest industries sectors carried out by him, the National Commission on Agriculture (NCA) made demand projections for wood based industries, and raw material required for the same (GOI 1972). On the strength of these estimates, the Directorate General of Technical Development (Ministry of Industry, Govt. of India) prepared a background paper entitled "Progress and present status of paper industry in India" in which following estimates were made (Table 3A&B), which were adopted by the Development Council for Paper, Pulp and Allied Industries (Development Council, 1983).
Table 3A - Demand Projections: Paper (Development Council, 1983)
|
Year |
Population |
Rate of growth % |
Capacity creation |
80% capacity utilization |
|
1991 |
801 |
5.0 |
2.8 |
2.24 |
|
1996 |
873 |
4.5 |
3.5 |
2.80 |
|
2000 |
946 |
4.0 |
4.3 |
3.4 |
Table 3B - Demand Projections: Newsprint (Development Council, 1983)
|
Year |
Population |
Capacity to be created |
80% capacity utilisation |
|
1991 |
801 |
0.8 |
0.6 |
|
1996 |
873 |
1.0 |
0.8 |
|
2000 |
946 |
1.3 |
1.0 |
It is pertinent to reproduce here, some of the recommendations made by the National Commission on Agriculture to meet the future raw material requirement (Govt. of India, 1976):
"We are of the view that there should be two pivotal points on which the national forest policy should rest. One is to meet the requirements of goods, that is, industrial wood for forest based industries, defence, communications and other public purposes, and small timber, fuelwood and fodder for the rural community. The other is to satisfy the present and future demands for protective and recreative functions of the forests. All the requirements must be met in full and self-sufficiency achieved as early as possible.""Since forest based industries are dependent on forest raw materials, interdependence between forestry sector and forest industries is vital. As forest crops can be harvested only periodically, the forest policy should lay down the need for resources planning taking into account the inevitable time lag which may be from 10 to 30 years or more. Integrated planning for raw material production and forest based industry would have to be one of the basic props of future policy. The new policy must take into account the institutional changes and the infrastructure required for utilization of the forest raw materials from the point of view of self-sufficiency, reduction in net imports of wood-based products and substantial exports of consumer items like panel products."
"It is clear that any strategy for forest development must take into account the goods and services that the forest should provide. Goods and services are both tangible and non-tangible. Production of industrial wood would have to be the raison d'être for the existence of forests. Actually it is in this value that many other values that have been claimed or stressed for forests so far can be absorbed. Other tangible benefits are the production of minor forest produce, fuelwood and fodder. Non-tangible benefits are the conservation of soil, moderation of run-off flows, recreation, maintenance of ecological balance, environment and wildlife, though in developed countries parameters are being evolved for evaluating benefits for their economic appraisal."
"The first element of the strategy would have to be production forestry for industrial wood production, supplemented by adequate forest based industries, for which necessary institutional and technical changes should be made."
These recommendations were largely accepted by the Government and in course of time, as many as 14 Forest Development Corporations were established, mainly to undertake plantations to meet projected demand for timber and other forest products. Had these programmes been pushed, the shortages in wood and bamboo raw material supplies would not have been as grave as it is now. But, on account of the negative image of wood based industries in the context of environmental awareness, movement against monoculture, etc., the strategies for generation of raw material for forest based industries were diluted and the demand forecasts as well as recommendations of NCA relegated to the down under.
Several attempts have been made in the recent past to estimate the future demand for paper and newsprint and work out the requirement of raw material. The strategies to be adopted and policy interventions needed to meet the raw material supplies have also been suggested.
Revised demand projection by the development council
The Demand projection for paper, board and newsprint made by the Development Council for Pulp, Paper and Allied Industries are as follows (Singhania, 1990):
Table 4 - Revised Demand Projection: Paper and Newsprint (Development Council, 1990)
|
Year |
Paper and Board |
Newsprint |
Total |
|
1995 |
2.5 |
0.7 |
3.2 |
|
2000 |
3.2 |
0.9 |
4.1 |
|
2005 |
3.7 |
1.3 |
5.0 |
|
2010 |
4.4 |
1.8 |
6.2 |
|
2015 |
5.3 |
2.6 |
7.9 |
The projections are made on the basis of following assumptions:
· The compounded annual growth rate (CAGR) in respect of paper and board will stabilize at 3.5% per annum in the period 2000-2015 as against 5.2% during 1980-2000.· In respect of newsprint, the CAGR will be 7.1% during 2000-2015 as against 6.1% during 1995-2000 as a direct result of increase in literacy.
Demand projections by other agencies
An Expert Group constituted by the Industry at the instance of Ministry of Industry, Govt. of India in 1993, however, felt that Demand projections made by the Development Council were conservative. The Group was of the view that the post liberalization scenario would result in higher CAGR and push the demand upwards (Gopalaratnam, 1996). The CAGR adopted and projections made are summarized below (Table 5).
Table 5 - Demand Projections: Expert Group (1993)
|
|
Paper and Board |
Newsprint |
Total |
||
|
CAGR % |
Demand |
CAGR % |
Demand |
(million tonnes) |
|
|
1994-95 |
7.8 |
2.6 |
4.4 |
0.7 |
3.3 |
|
2000-01 |
6.5 |
4.0 |
5.0 |
0.9 |
4.9 |
|
2005-06 |
5.0 |
5.5 |
5.0 |
1.2 |
6.7 |
|
2010-11 |
5.0 |
7.1 |
5.0 |
1.5 |
8.6 |
|
2015-16 |
- |
9.0 |
- |
1.9 |
10.9 |
A High Level Committee (HLC) constituted by the Ministry of Industry conducted an independent study and made projections which were slightly at variance with the findings of the Expert Group. The projections made by this Committee are as follows (JCPI 1996).
Table 6 - Demand Projections: High Level Committee (1994)
|
Year |
Paper and Paper Board |
Newsprint |
Total |
||
|
CAGR % |
Demand (million tonnes) |
CAGR % |
Demand (million tonnes) |
||
|
1994-95 |
- |
2.6 |
- |
0.7 |
3.3 |
|
2000-01 |
7.8 |
4.05 |
4.4 |
0.90 |
4.95 |
|
2005-06 |
6.5 |
5.48 |
4.0 |
1.09 |
6.57 |
Source: HLC (1994).
The National Productivity Council (NPC), on the other hand, came up with projections based on an uniform CGAR of 5% for both Paper, Paperboards and Newsprint. Their projections were as follows (NPC 1990):
Table 7 - Demand Projections: NPC
|
Year |
CAGR % |
Demand (million tomes) |
|
1995 |
5 |
3.2 |
|
2000 |
5 |
4.7 |
As may be seen from the demand projections worked out by various agencies, the estimated Demand, largely agree with each other except the earlier projections made by the Development Council and those of the NPC. For purposes of this study, the projections of the Development Council (1990) given in Table 4 are adopted for following reasons:
· A complete spectrum of stakeholders was involved in the exercise;· The demand projection for 1995 made in 1990 more or less agreed with actual consumption that year.
Wood equivalent of needs
The estimated requirement of raw material, based on above demand projection (if total demand is to be met by wood sources) will be somewhat as follows (Table 8). It is assumed that 2.8 tonnes of wood (bone dry) is required to manufacture 1 tonne of paper and that 2 tones of the same is required to produce 1 tonne of newsprint (Singhania, 1990). On the basis of data obtained for eucalypts, it is reckoned that 2.2 cu.m stacked wood with bark at 70% moisture content will yield 1 tonne of bone dry material. Thus wood required for 1 tonne of paper is 6.16 cu.m and for newsprint, 4.4 cu.m. (These conversion factors are based on actual industry experience and differ from other reported conversion factors, i.e., 4.8 to 5.5 cu.m of wood for 1 tonne paper pulp and 2.8 cu.m for 1 tonne of newsprint ICFRE, 1995).
Table 8 - Wood raw material requirement if demand is to be met entirely by wood
|
Year |
Estimated Demand (million tonnes) |
Wood requirement (million cu.m) |
Total wood requirement (million cu.m) |
||
|
Paper & board |
Newsprint |
Paper & board |
Newsprint |
||
|
1995 |
2.5 |
0.7 |
15.4 |
3.1 |
18.5 |
|
2000 |
3.2 |
0.9 |
19.7 |
3.9 |
23.6 |
|
2005 |
3.7 |
1.3 |
22.8 |
5.7 |
28.5 |
|
2010 |
4.4 |
1.8 |
27.1 |
7.9 |
35.0 |
|
2015 |
5.3 |
2.6 |
32.6 |
11.4 |
44.0 |
Before examining whether the projected requirement can be met by wood fibre resources, the present pattern of utilization of raw material will be analysed.
Present pattern of raw material utilization
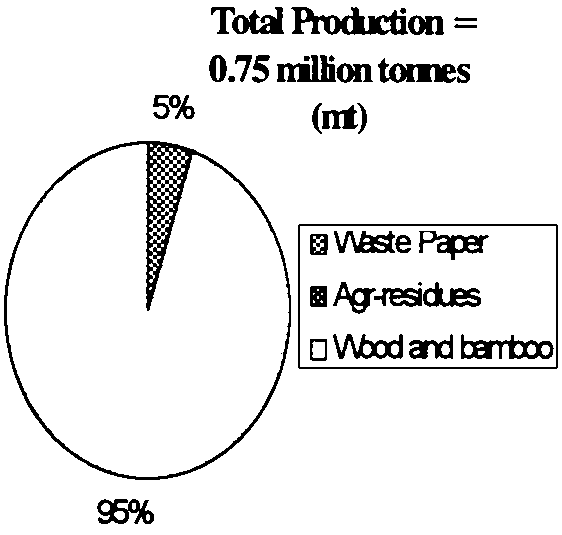
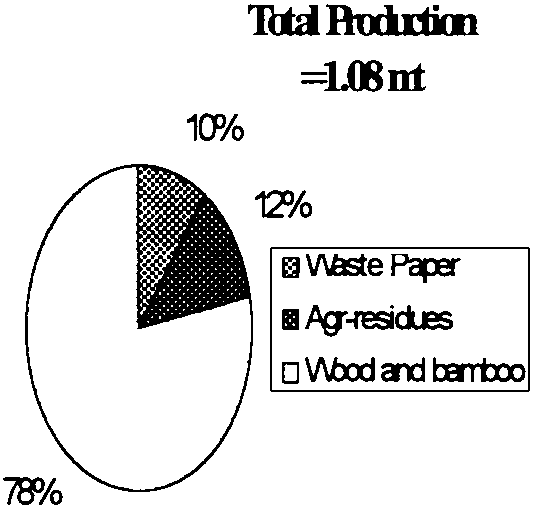
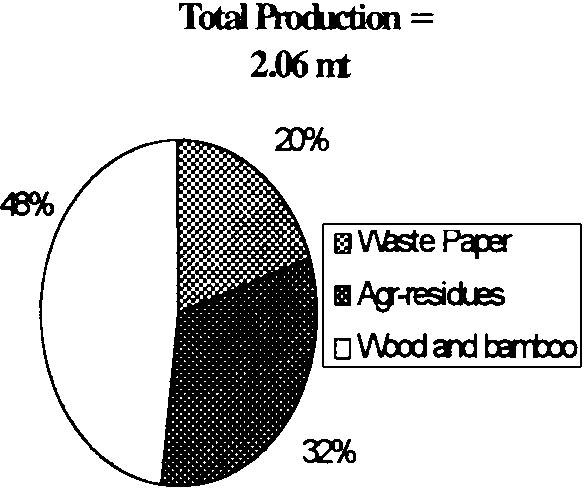
In the seventies and eighties, wood and bamboo constituted the chief raw material. With their scarcity increasing and impetus given by Government to utilize non wood fibre resources by measures like import of second hand machines to process agro-based materials, removal of licensing prerequisites to mills based on 75% "unconventional" raw material, provision to import wood, chips, pulp and waste paper at substantially decreased customs duty under the Open General Licence (OGL) procedure, etc., the raw material utilization profile changed significantly as shown in Table 9 and Fig. 1.
Table 9 - Profile of raw material utilization
|
Year |
Percentage of production based on |
||
|
Wood and bamboo |
Agri residues |
Waste paper |
|
|
1970 |
95 |
5 |
0 |
|
1990 |
48 |
32 |
20 |
|
1995 |
38 |
36 |
26 |
Had not the policy intervention taken place at the right time, production based on non wood fibre sources, perhaps, would not have taken place and domestic pulp and paper industry collapsed. The trend discernible in Table 9 is continuing and will be analysed later. At present, while large mills are essentially wood/bamboo or imported pulp based, small mills depend heavily on non wood and recycled fibre sources, chiefly straw, bagasse and waste paper. The pattern of utilization of raw materials is illustrated in Table 10 (Singh et al 1992).
Figure 1 - Pattern of Raw Material Utilization - Pulp and Paper
1970
1979
1990
1995
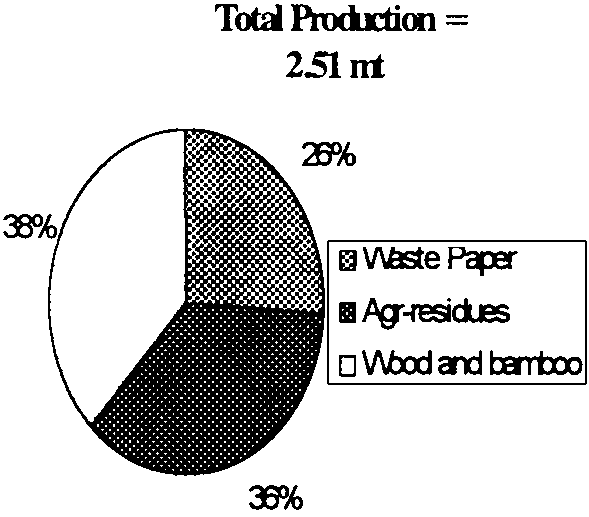
Table 10 - Illustrative examples of existing pattern of raw material utilization
|
Name of mill |
Capacity (TPA) |
Raw material utilized |
Grades of paper produced |
|
1 |
2 |
3 |
4 |
|
Andhra Pradesh Paper Mills Ltd Secunderabad |
92,500 |
Wood, bamboo, imported pulp rags |
Writing, Printing and packaging paper, paper board |
|
Hindustan Paper Corporation Cachar |
100,000 |
Bamboo, wood imported pulp |
Printing and writing paper |
|
The Coastal Chemicals Ltd., Pulp & Paper Dn. Visakhapatnam |
16,500 |
Rice straw |
Writing, Printing, Poster and plain kraft paper |
|
Kolleru Paper Ltd Ramachandrapeta |
10,000 |
Waste paper |
Writing and printing papers |
|
Agrashakti Paper, Mills Pvt. Ltd, Valsaad |
6,500 |
Rice straw & waste paper |
M.G. Kraft paper |
|
Shanti Paper Mills Sonepat |
3,000 |
Rice straw, wheat straw, bagasse |
Semi kraft & Media kraft paper |
|
Sidhartha Paper Daruhera |
1,800 |
Imported pulp, waste paper |
Speciality paper |
|
Cauvery Paper Mills Kollegal |
10,000 |
Bagasse, jute, imported pulp Waste paper |
Kraft and Poster paper |
|
Serapally Whitley Pvt. Ltd., Ramanagaram |
5,000 |
Waste paper |
Paper board |
|
Ajanta Paper Products, Kalyan |
7,000 |
Waste jute, Hessian, Pulp, Waste paper |
Kraft paper |
|
Aurangabad Paper Mills Aurangabad |
15,000 |
Bagasse, Waste paper, Gunny |
M.G. Kraft Paper |
|
Seshasayee Paper and Board Ltd Erode |
55,000 |
Wood, bamboo bagasse, waste paper, pulp |
Printing, writing, packaging paper and board |
|
Tamilnadu Newsprint and Papers Ltd Pugalur |
90,000 |
Bagasse, wood |
Newsprint, writing & Printing papers |
|
Kulik Paper Industries Ltd Rai Ganj |
6,000 |
Cereal straw, Jute waste, Waste paper |
M.G. Kraft Paper |
N.B: The above list is illustrative and not exhaustive. Small mills have the in built provision to switch over from one non wood fibre source to the other or to waste paper.
Future pattern of raw material utilization
An idea of the emerging scenarios with regard to raw material utilization is available from the planned capacity additions between 1996 and 2000. Not only are the existing large mills planning substantial additions to their capacity, but several major companies are diversifying into paper production. About 2.5 million Mt. additional capacity is expected to be added in 4 years, out of which orders for 0.82 million TPA capacity have already been placed by a total of 13 mills. 17 mills are planning further addition to their installed capacity to the total extent of 1.68 million TPA. They are, however, yet to place orders (Anon 1996). Some noteworthy features of the planned addition to capacity are:
· A significant portion of planned additional capacity is non wood/bamboo and recycled fibre based;· As against earlier scenario of non wood/recycled fibre based mills being small, large capacities (95 to 150,000 TPA) are planned indicating that several of the problems encountered in their utilization have been overcome and that economies of scale will be an important consideration to remain competitive;
· Entrepreneurs have realized that size has to be sufficiently large to provide for economical chemical recovery systems and to conform to pollution control norms about which environmental and judicial activism have been growing.
The scenario is summarized in Table 11.
Table 11 - Planned capacity addition: 1996-2000 (Paper, Paperboard and Newsprint)
|
Proposed raw material |
No. of units |
Capacity planned (TPA) |
Capacity range (TPA) |
|
1. Wood fibre |
1 |
16,000 |
|
|
2. New wood fibre | |||
|
i. Bamboo |
1 |
80,000 |
|
|
ii. Bagasse |
7 |
700,000 |
75 to 150,000 |
|
iii. Straw |
1 |
40,000 |
|
|
Sub total (Non wood) |
10 |
820,000 |
|
|
3. Recycled fibre | |||
|
Waste paper (domestic and imported) |
8 |
483,000 |
33 to 100,000 |
|
4. Pulp (imported) |
5 |
436,000 |
12 to 285,000 |
|
5. Multiple fibre sources | |||
|
i. Wood and bamboo 4 |
120,000 |
13 to 50,000 |
|
|
ii. Wood, bamboo and waste paper |
1 |
155,000 |
|
|
iii. Wood and waste paper |
1 |
100,000 |
|
|
iv. Wood and bagasse |
1 |
60,000 |
|
|
v. Bagasse and pulp |
1 |
125,000 |
|
|
vi. Bagasse and waste paper |
1 |
75,000 |
|
|
vii. Pulp and waste paper |
1 |
65,000 |
|
|
Sub total (multiple sources) |
10 |
700,000 |
|
|
TOTAL |
33 |
2,455,000 |
|
The contribution of each fibre source in the planned additional capacity is shown in Table 12. Where more than one fibre source is utilized in an unit, it is assumed that quantities are equally distributed. For example, in an unit of capacity 155,000 TPA utilizing wood, bamboo and waste paper, it is assumed that quantity of each raw material is 52,000 TPA.
In the planned capacity expansion during next 3 to 4 years, the role of wood fibre is expected to be limited to 8.5% of total capacity. The non wood fibre sources (including bamboo) will account for 43.2% of which bagasse is the dominant raw material constituting 33.8% of total capacity. Recycled fibre will also play an important role, forming 26.7% of total additional capacity.
Table 12 - Distribution of fibre sources in the planned capacity expansion: 1996-2000
|
Raw material |
Anticipated quantity |
(TPA) |
% of Total |
||
|
As one source only |
As two or more sources |
||||
|
1. Wood fibre |
16,000 |
192,000 |
208,000 |
8.5 |
|
|
2. Non wood fibre |
|||||
|
|
i. Bamboo |
80,000 |
112,000 |
192,000 |
7.8 |
|
|
ii. Bagasse |
700,000 |
130,000 |
830,000 |
33.8 |
|
|
iii. Straw |
40,000 |
- |
40,000 |
1.6 |
|
3. Recycled fibre |
|||||
|
|
Waste paper |
483,000 |
172,000 |
655,000 |
26.7 |
|
4. Pulp (imported) |
436,000 |
94,000 |
530,000 |
21.6 |
|
|
TOTAL1 |
1,755,000 |
700,000 |
2,455,000 |
100.0 |
|
1 Capacity using one source only would account for 72% of planned expansion.
It is evident that the pulp and paper industry is gearing up to substitute and complement wood fibre, whose supplies are diminishing, by non wood and recycled fibres. The situation in the panels industry will now be examined.
1.3.1 Plywood
1.3.2 Particleboard
1.3.3 Fibreboard
1.3.4 Medium density fibreboard
The wood based panels manufactured in India are plywood, particleboard, fibreboard and medium density fibreboard (MDF). Of these, plywood is most common and accounted for about 93% of the quantity of all boards produced in 1994-95. Normally plywood would not have been dealt with in this report, as non wood materials are not utilised in their manufacture. The advent of Bamboo Mat Board (a substitute for thin plywood) has somewhat altered the situation and therefore this product will be dealt with briefly.
The manufacture of plywood in commercial scale started in this country in the beginning of this century to produce packing cases for export of tea. With the establishment of suitability of indigenous species for its manufacture and R & D backstopping it received, the industry grew impressively and diversified to manufacture all grades of plywood conforming to international standards. When import of wood under Open General Licence (OGL) was permitted in view of growing scarcity of indigenous supplies, and import duty slashed to 10%, a large number of small units came up in a quick time.
As on 1 January 1997, there were 404 production units, 62 of registered annual capacity of 1,000 cu.m or more and 342 small units with lesser capacity (FIPPI 1997). The estimated capacity in 1994-95 was 0.96 million cu.m and production about 0.6 cu.m, capacity utilization being in the order of about 60%.
As in the case of pulp and paper, several exercises have been carried out to project future demand. Considering the near agreement between projected and reported consumption in 1995, the projection made by the Development Panel (now Development Council) for Wood based Industries (Anon 1987) has been adopted for this study and based on this, estimated requirement of wood raw material for plywood and decorative veneer industries at 80% capacity utilization is as follows (Table 13) assuming plywood out turn as 50%.
Table 13 - Raw material requirement for plywood and decorative veneer industries
|
Year |
Wood raw material requirement (million cu.m) |
Plywood volume* |
|
1995 |
1.22 |
0.61 |
|
2000 |
1.45 |
0.72 |
|
2005 |
1.69 |
0.85 |
|
2010 |
1.92 |
0.96 |
* 50% yield.
A significant development in India towards utilization of non wood raw material for panel similar to plywood was the improved Bamboo Mat Board made out of woven bamboo slivers (Ganapathy, 1992). Based on the technology, 7 mills (3 small scale units exclusively producing bamboo mat boards and 4 integrated to plywood production) started manufacturing this panel and estimated annual production was about 2,000 cu.m (Ganapathy et al, 1996). Considering the quick commercialization of the technology, it was felt that bamboo mat board would substitute plywood to a significant extent and that non wood material replace wood in this strong wood based sector. But subsequent developments have belied this optimism. On account of shortage of bamboo supplies in places where mat weaving skills were present; about 600% increase in the cost of mats in 3 years, i.e., from Rs.2.70 per square meter to Rs.18/and persistent consumer resistance, the much expected growth of this product has not taken place. In fact, except for one unit in which captive raw material supply is arranged, production is severely curtailed or closed in other units (Adkoli, 1997).
Further R & D efforts to reduce production cost, especially urea formaldehyde (UF) bonded board, vigorous marketing efforts, mechanization of weaving in cooperatives of weavers and above all, enduring tie up arrangements between bamboo growers and weavers, will be required to promote Bamboo Mat Board. It is expected that additional R & D inputs will be available in the next 2-3 years and therefore non wood raw material is expected to penetrate this citadel of wood products.
Current production
Unlike the general world trend, growth of particleboard in India has been sluggish, because of high production cost, strongly influenced by economies of scale2 as well as high cost of petroleum-based resin adhesives and resistance of carpenters (who have been playing a dominant role in shaping consumer acceptance) to work this material.
2 The tendency for India to have relatively small or very small units for this and other products reflects the structure of policy incentives which favour small scale industries and discourage larger size. Liberalized policies could soon change this and permit more internationally competitive industry to emerge (editor).
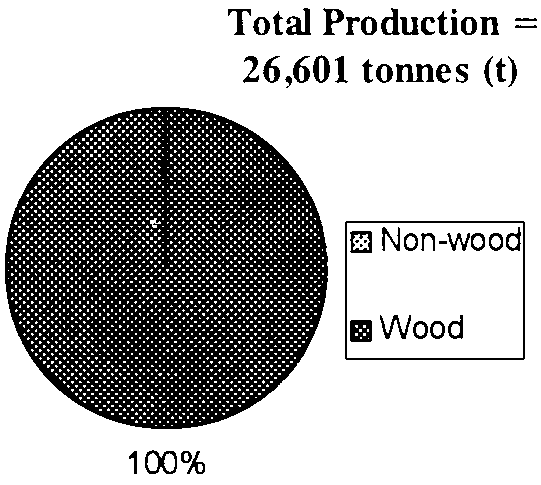
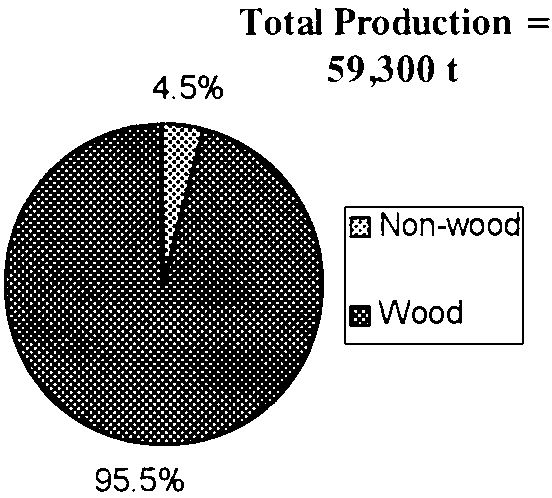
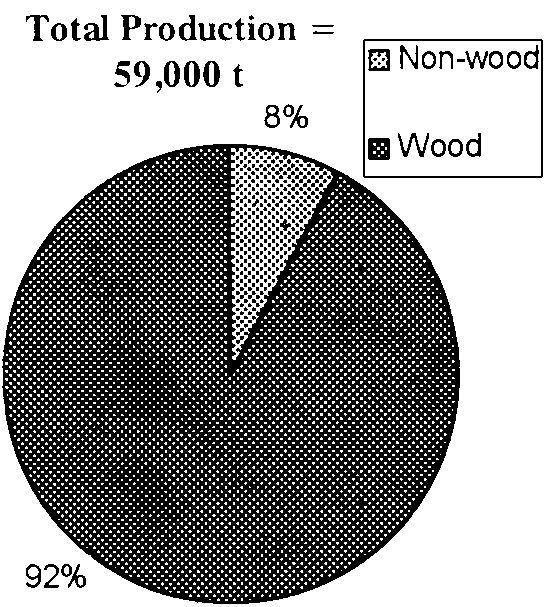
The first particleboard unit was set up in the country in 1950. As on 1 January 1997, there were 11 units with installed capacity ranging from 1,700 to 19,200 tonnes per annum (TPA). The total installed capacity was 85,134 tonnes, of which one unit of 2,500 TPA based on wood and another of 6,000 TPA based on wood and bagasse remained non-operational. The capacity utilization in others varied from plant to plant, ranging from 11 to almost 100%. The overall capacity utilization was 67% and estimated production during the year was 57,000 tonnes. In addition, a bagasse based unit started producing about 1800 TPA and marketing its product under the trade name ECO WOOD. Another small unit based on rice husk increased its capacity from 1,500 to 3,000 TPA, but produced only 500 tonnes. The current scenario is summarised in Table 14 and Fig.2.
Table 14 - Particleboard: Current Raw material Utilization
|
Raw material |
Installed capacity (TPA) |
Production (estimated) (TPA) |
|
Registered units | ||
|
Wood |
68,134 |
52,400 |
|
Wood and bagasse |
6,000 |
0 |
|
Bagasse |
11,000* |
4,600 |
|
Sub total: |
85,134 |
57,000 |
|
Unregistered units | ||
|
Bagasse |
3,000** |
1,800** |
|
Rice husk |
3,000** |
500** |
|
Total: |
91,134 |
59,300 |
*This bagasse based unit converted itself into bagasse and wood (6200 and 4800 TPA respectively), bagasse-based product being about 2500 TPA only.**Personal communication.
At present, therefore, hardly 4800 tonnes of particleboard is produced based on non-wood sources, which is about 8% of the total. When import of second hand machinery for manufacturing panel products based on agricultural residues was allowed, a number of manufacturers applied for licence to set up units to utilize non wood sources. As in the case of pulp and paper, manufacture of panel products based on non wood sources was taken out of the purview of licensing. As a result, more manufacturers came forward to plan units based on non wood sources. But none of them have started production.
Figure 2 - Pattern of Raw Material Utilization - Particle Board
1985
1995
1997
Particleboard production has largely remained wood based, inspite of availability of a variety of non wood raw materials, whose suitability to produce particleboard conforming to relevant Indian Standard Specifications has been investigated in laboratories (George, J. 1982) and in some cases, like rice husk, demonstrated in pilot scale trials (Krishna Prasad and George, J. 1991; Zoolagud and Rangaraju, 1994). As far as India is concerned, the statement on utilization of non wood sources for production of panels made in the FAO International Conference (1957) on Reconstituted Wood Panels and reiterated by Chittenden (1970) still holds good:
· "The greatest obstacle to increase the utilization of non wood fibres is the problem of collection and storage and lack of suitable equipment for the purpose";· "And there are also problem materials, which are available in sufficient quantities on site, but not used, because of technical intractability or alternate use considerations or both factors".
In a widely circulated submission to Government (Anon. 1990), a pioneering manufacturer of bagasse based particleboard brought out following problems:
· The duration of sugar crushing season varies from year to year and therefore availability of mill run bagasse drops to 5 months;· Total area required for storage of mill run bagasse, depithed bagasse and pith at the peak loading level for a 11,000 TPA factory is 12,000 sq.m. Such a large storage area and subsequent movement of material is a serious constraint;
· Because of large quantity involved, mill run bagasse is procured from different sugar mills, which results in quality variations with regard to moisture change, silica content and fibre structure. This situation will not permit maintaining consistent quality of the product;
· Bagasse stored in open areas is exposed to rain, sand and fungal attack. This results in degradation of fibre quality and consequently poor yield of net fibre.
The above problems have largely been overcome in other countries and by pulp and paper industries in India. Thus, there is every reason to be optimistic that Indian particleboard industry will overcome these problems in the future and that bagasse and other non wood fibre resources will play a significant role. Constraints (GOI 1991) will, however, continue to be:
· Economies of scale. Machinery for manufacturing particleboard, fibreboard, etc., are based on high production capacities. Small sized plants are uneconomical;· Gaps exist in process parameters provided by machinery manufacturers and overseas collaborators. The parameters, for example, did not match with actual operation conditions in respect of a recently established bagasse particleboard and an MDF unit, resulting in delay, cost escalation, etc.;
· Manufacturers cannot afford individual R & D back up to adapt technologies to specific local conditions. Absence of R & D facilities at national level and lack of trained manpower are serious bottlenecks.
It is anticipated that these problems will gradually be overcome. This expectation is substantiated by the interest evinced by entrepreneurs to establish units based on non wood fibre resources. The details are furnished below (Table 15).
Table 15 - Particleboard capacities planned
|
Raw material |
No. of units |
Capacity (TPA) |
% |
|
Under implementation | |||
|
Bagasse |
7 |
260,935 |
65 |
|
Cotton stalk |
1 |
12,500 |
3 |
|
Jute stalk |
1 |
6,000 |
1 |
|
Rice straw |
4 |
56,250 |
14 |
|
Rice husk |
4 |
120,000* |
3 |
|
Wood |
6 |
53,600 |
14 |
|
Sub total |
23 |
401,285 |
100 |
|
Letter of Intent issued | |||
|
Wood (sourced from farm forestry and rubber wood) |
4 |
335,685 |
|
|
Total |
27 |
736,770 |
|
*Personal communication.
Out of the capacity reported to be under implementation, 88% capacity is based on non wood fibre sources, and if total capacity planned is taken into account, it works out to be 48%.
Demand projection for particleboard
In the demand projection made by the Development Panel for Wood based Industries (Anon. 1987), based on the sluggish growth trend during 15 preceding years, a growth rate of 4.69% was adopted. A FAO (1983) study forecast a higher growth potential and estimated the demand in the year 2000 as 135,000 tonnes against 1985 installed capacity of 64,100 tonnes, capacity utilization of 41.5% and production of 26,601 tonnes. The position in 1995 showed that the Development Panel projection was an underestimate and that consumption had increased resulting in improved capacity utilization and production, i.e., 67% and 57,000 TPA respectively. Based on the improved trend and presuming that at least one-tenth of planned capacity will materialise by end of the century and that the same trend will continue thereafter, following projection is made, assuming 80% capacity utilization (Table 16).
For computation of raw material requirement, it is reckoned that for production of board 1.2 tonnes of air dry wood chips are required and that 2.2 cu.m of unbarked round wood at 70% moisture content is required to obtain 1 tonne of dry chips. Thus, the requirement of wood works out at 2.64 cu.m for a tonne of board (Anon. 1987).
Table 16 - Particleboard: Anticipated demand and raw material requirement, if entire production is wood based
|
Year |
Installed capacity (million tonnes) |
Capacity utilization % |
Production (million tonnes) |
Wood raw material requirement (million cu.m) |
|
1995 |
0.085 |
67 |
0.057 |
0.15 |
|
2000 |
0.16 |
80 |
0.13 |
0.34 |
|
2005 |
0.23 |
80 |
0.18 |
0.49 |
|
2010 |
0.31 |
80 |
0.25 |
0.65 |
While the product was totally wood based till recently, about 4% was based on non wood fibre sources in 1995 and 8% in 1997, thereby making a small dent in utilization of non wood fibre. The planned capacity is in the direction of tapping non wood resources.
Current production
The products like hardboard, insulation board are included in this category. The first unit in India was established in the early fifties. At present there are 3 units. Their details are furnished in Table 17.
Table 17 - Fibreboard: Installed capacity and production
|
Year |
No. of units |
Installed capacity (TPA) |
Production (TPA) |
Capacity utilization, % |
Remarks |
|
1985 |
3 |
53,000 |
33,719 |
64 |
- |
|
1993 |
3 |
57,140 |
31,051 |
54 |
1 unit was non operational |
|
1994 |
3 |
57,140 |
47,881 |
84 |
- |
|
1995 |
3 |
57,140 |
51,059 |
89 |
- |
|
1997 |
3 |
57,140 |
- |
- |
- |
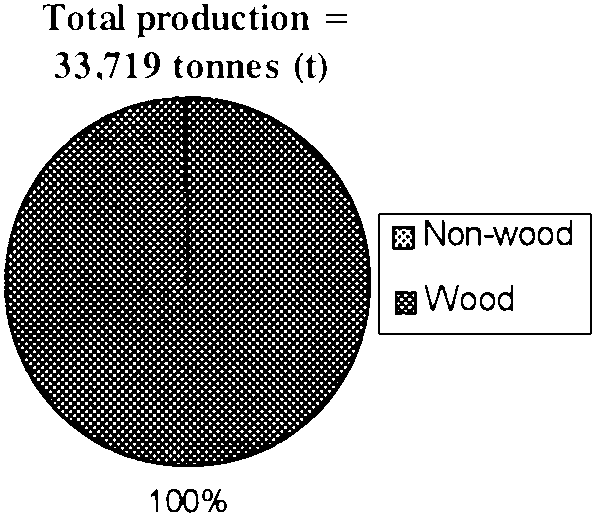
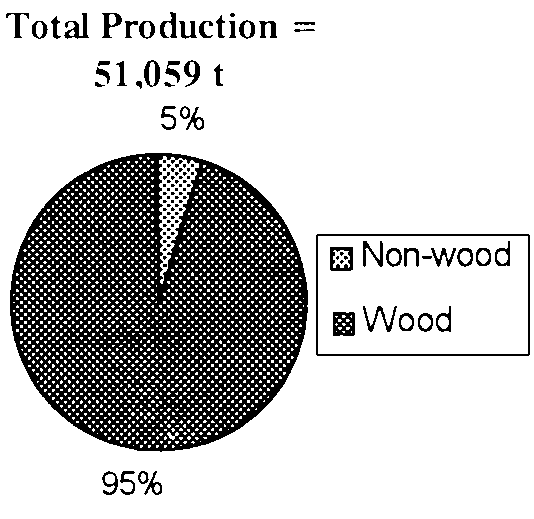
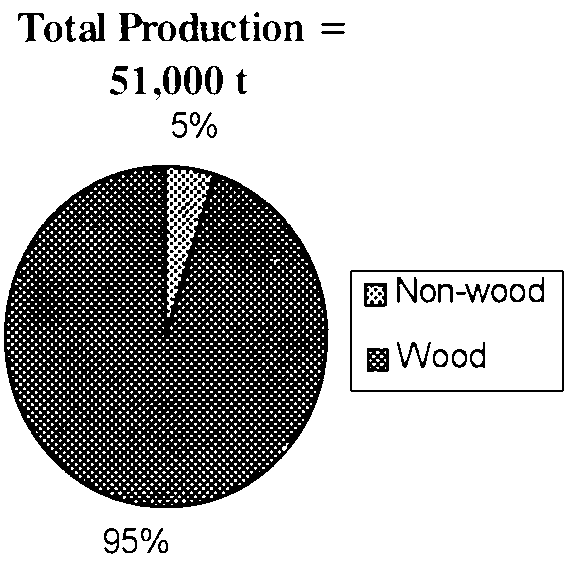
The number of units has remained the same and one unit has added some 4,000 TPA additional capacity; 2 are wood based and one is partially bagasse based. In this unit, out of the production of about 19,000 tonnes, some 2,500 tonnes of insulation board was bagasse based. Thus fibreboard utilizing non wood sources was about 5% only (Fig.3).
With liberalization of policy in the import of second hand machinery and removing non wood based enterprises from the purview of licensing, additional capacity has been planned as detailed below.
Table 18 - Fibreboard: Capacity planned
|
Raw material |
No. of units |
Capacity TPA |
%* |
|
Under implementation | |||
|
Bagasse & Cotton stalk |
1 |
22,500 |
6 |
|
Cotton stalk |
3 |
93,000 |
24 |
|
Straw |
1 |
50,000 |
14 |
|
Bagasse & wood |
1 |
30,000 |
8 |
|
Wood |
3 |
165,000 |
46 |
|
Sub-total |
9 |
360,500 |
100 |
|
Letter of Intent issued | |||
|
Wood |
1 |
85,000 |
- |
* % calculated by editor.
Figure 3 - Pattern of Raw Material Utilization - Fibreboard
1985
1995
1997
Demand projections for fibreboard
As for particleboard, no new capacity was installed, except augmenting capacity in one mill. With respect to fibreboard also, the projection made by the Development Council based on growth rate in the preceding years will not reflect the current situation. Taking advantage of new schemes announced by the Government, additional capacity is already planned and presuming that at least one tenth of planned capacity will materialise by the turn of the century and that the same trend will continue, following projection is made, assuming 80% capacity utilization (Table 19). To project raw material requirement, the conversion factor at 2.5 cu.m round wood with bark at 70% moisture content for a tonne of fibreboard is adopted (Anon. 1987).
Table 19 - Fibreboard: Anticipated Demand and raw material requirement if entire production is wood based
|
Year |
Installed capacity (million tonnes) |
Capacity utilization % |
Production (million tonnes) |
Raw material requirement (million cu.m) |
|
1995 |
0.057 |
89 |
0.059 |
0.13 |
|
2000 |
0.11 |
80 |
0.859 |
0.22 |
|
2005 |
0.16 |
80 |
0.13 |
0.32 |
|
2010 |
0.27 |
80 |
0.17 |
0.41 |
The product was totally wood based till recently. By 1995, about 5% was based on non wood source. It remained more or less at the same level in 1997. Looking at the raw material source proposed for planned capacity, increasing utilization of non wood sources, particularly cotton stalk, is discernible.
This product is new to the country. At present, there are only 2 units one based on wood. The other was planned for utilizing cotton stalk. This project was based on pilot scale technology developed by the overseas collaborator/machinery manufacturer and it was the first attempt in the world to produce MDF with this non wood fibre source. On account of problems relating to technology adoption and economic utilization of the raw material, the unit switched over to partial utilization of wood. It is understood that at present entire production is wood based. Efforts are being made to overcome the technical problems. Relevant details of extant production of MDF in the country are given in Table 20.
Table 20 - MDF: Installed capacity and production
|
Year |
No. of units |
Installed capacity (TPA) |
Production (TPA) |
Capacity utilization, % |
Remarks |
|
1985 |
2 |
65,400 |
13,595 |
21 |
1 unit was non operational |
|
1993 |
2 |
65,400 |
12,317 |
19 |
1 unit was non operational |
|
1994 |
2 |
65,400 |
54,869 |
84 |
- |
|
1995 |
2 |
65,400 |
49,100 |
75 |
- |
There is no increase in either number of units or installed capacity. One unit which was established to produce cotton stalk based MDF for the first time in the world faced insuperable technical problems and switched over to wood.
With the new incentives announced, MDF, as in respect of other reconstituted panels, is also looking up and additional capacity as detailed below is planned (Table 21).
Table 21 - MDF: Capacity planned
|
Raw material |
No. of units |
Capacity, TPA |
|
Letter of intent issued | ||
|
Wood |
5 |
384,200 |
It is interesting to note that unlike particleboard and fibreboard, the planned capacity is entirely wood based, although non wood sources like bagasse and cotton stalk have been found to be good. It is perhaps reflective of the difficulties encountered by the only non wood based unit. It is, however, believed that MDF will become increasingly dependent on non wood sources. It is foreseen that in view of market penetration and consumer acceptance of the product, the planned capacity will materialise quickly. The raw material requirement is estimated based on the premise that planned capacity will be achieved in next 15 years. The conversion factor adopted is 2.5 cu.m wood to 1 tonne MDF (Anon. 1987).
Table 22 - MDF: Anticipated Demand and Raw material requirement, if entire production is wood based
|
Year |
Installed capacity (million tonnes) |
Capacity utilization % |
Production (million tonnes) |
Raw material requirement (million cu.m) |
|
1995 |
0.065 |
75 |
0.05 |
0.12 |
|
2000 |
0.20 |
80 |
0.16 |
0.40 |
|
2005 |
0.34 |
80 |
0.27 |
0.67 |
|
2010 |
0.47 |
80 |
0.38 |
0.95 |
1.4.1 Wood budget
1.4.2 Tree plantations
1.4.3 National Forest Policy 1988
1.4.4 Measures taken by the Government to meet the problems of wood shortage
Assuming that pulp and paper and panels industries will be using only wood as raw material, the estimated requirement of wood, based on the conversion factors already explained will be as shown in Table 23.
Table 23 - Requirement of raw material for paper and panels, in the event of entire production being wood based
|
Sector |
Wood requirement (million cu.m) |
||
|
2000 |
2005 |
2010 |
|
|
Pulp, Paper, Newsprint |
23.60 |
28.50 |
35.00 |
|
Plywood |
1.45 |
1.69 |
1.92 |
|
Particleboard |
0.34 |
0.49 |
0.65 |
|
Fibreboard |
0.22 |
0.32 |
0.41 |
|
MDF |
0.40 |
0.67 |
0.95 |
|
Total |
26.01 |
31.67 |
38.93 |
The Forest Survey of India (FSI) has recently carried out a demand/supply exercise in respect of fuel wood, timber and fodder from the forests of India (Rai and Chakrabarti, 1996) based on the results of field studies conducted by that organization during the last several years. The findings are summarized below.
Table 24 - Demand and supply of wood (in million cu.m)
|
|
1996 |
2001 |
2006 |
|
Wood requirement (for housing, furniture, agricultural implements, industrial uses, etc.) |
64 |
73 |
82 |
|
Output from natural forest |
12 |
12 |
12 |
|
Output from plantations raised under production and social forestry schemes and other wood lots |
41 |
47 |
53 |
|
Deficit |
11 |
14 |
17 |
Above details pertain to total wood demand and supply. It is assumed that supplies from natural forests and old plantations will not increase from the current level of about 12 million cubic meters. It is likely that even this availability may decline, in the context of increasing restrictions on fellings from forests. The remaining supplies are from plantations raised under production forestry, social forestry schemes, etc., as detailed below (ICFRE 1995). In recent years, the tempo of planting activity has increased considerably, i.e., from about 10,400 ha per annum in 1951-52 to 1-1.7 million ha per year after 1988-89 (Annex 4).
|
Box 1: Particulars of tree planting | |
|
1. Area planted under various production/social forestry schemes (including area covered by farmers out of nursery grown seedlings distributed to them, assuming that in one ha., an average of 2,000 seedlings were planted) |
23,000,000 |
|
2. Area planted under externally aided Social Forestry projects (1981-82 to 1992-93) including gross area covered by seedlings distributed to farmers (assuming 2,000 seedlings in a ha) |
|
|
Farm forestry |
1,242,293 |
|
Village wood lots |
508,730 |
|
Strip plantation |
77,590 |
|
Rehab. of degraded forests |
239,870 |
|
Sub total |
2,068,483 |
|
3. Area planted by voluntary agencies under grant-in-aid scheme (1985-86 to 89-90) |
41,364 |
|
4. Area planted by Tree Growers Cooperative Societies (up to 1993-94) |
4,099 |
|
5. Area planted under Compensatory Afforestation Scheme, against forest area diverted to other purposes (as provided under Forest Conservation Act 1980) |
199,762 |
|
Total |
25,313,708 |
Even conceding that the bulk of the produce from this recently created plantation resource will be fuelwood, the timber output estimated by FSI appears to be very conservative. Saxena (1994) has questioned the estimated gap between demand and supply of industrial wood, particularly pulpwood. He has quoted the example of steep decline in price of eucalypts produced by farmers in north west India to argue that supplies are not short relative to demand. Notwithstanding such isolated examples in Punjab, Haryana and some parts of Karnataka, it can be stated that there is a wide gap between availability and requirement. Inspite of massive plantation programmes, this gap is unlikely to be bridged in the next 10-15 years.
The pulp and paper and panel industries will have to compete with other demands, viz., agricultural implements, poles for rural construction, sawmill industries, etc., for wood from forests (both natural forests and plantations) and the same produced under social forestry schemes. Apart from advantages like proximity to supplies, the industries will be at a disadvantage, as compared to pulls from socially stronger demands, in the light of provisions in the National Forest Policy 1988. Hence, inspite of significantly increased plantation activity, the pulp and paper industries will not be able to meet their entire requirement of industrial wood from out of supplies from forests. It is however expected that the industry will manage to obtain supplies at the current level in future years. These supplies will include bamboos. The particleboard, fibreboard and MDF industries will be able to obtain their requirements from wood generated under social forestry schemes, mostly from farmers, supplemented by sales conducted by forest departments/corporations.
The above situation needs to be viewed against the provisions in the National Forest Policy enunciated in 1988. In respect of supply of raw materials to industries, it is enunciated as follows in the Policy (GOI 1988):
· As far as possible, a forest based industry should raise the raw material needed for meeting its own requirements, preferably by establishment of a direct relationship between the factory and the individuals who can grow the raw material by supporting the individuals with inputs including credit, constant technical advice and finally harvesting and transport services.· Farmers, particularly small and marginal farmers, would be encouraged to grow, on marginal/degraded lands available with them, wood species required for industries. These may be grown along with fuel and fodder species on community lands not required for pasture purposes and by local forest departments/corporations on degraded forests, not earmarked for natural regeneration.
· The practice of supply of forest produce to industry at concessional prices should cease. Industry should be encouraged to use alternative raw materials. Import of wood and wood products should be liberalized.
Whether it will be possible for the industries to obtain their total requirement through the involvement of farmers, is a question for which there is no clear answer. A few paper industries have already joined hands with farmers and through bipartite (industry and farmer) or tripartite (industry, farmer and National Bank for Agriculture and Rural Development NABARD for refinancing the planting activity) agreements for buy back of wood at the end of predetermined periods after planting, launched programmes envisaged in the National Forest Policy. By supplying improved clones of fast growing species suitable for pulping and extending technical backstopping, the industries in some cases have obtained greater productivity than forest plantations and provided attractive returns to the farmer. It is, however, argued by the industries that exclusive dependence of wood based industries on such uncertain and undependable source of raw material cannot stimulate expansion and growth of the industry. Statutory ceiling limits on agricultural land resulting in fragmented and small holdings, and competing usages to which such holdings are subjected to, according to them, cannot be expected to generate entire requirement of industrial wood (Piare Lal, 1996).
The government, which has been the main producer and supplier of wood to industries, has been aware of the widening gap between demand and supply and apart from substantially increasing the plantation activity, taken several initiatives to meet the situation. Several expert committees were constituted by the government to study the problems and recommend measures. The more important of these were:
· Committee to recommend alternate sources of raw materials for wood based industries in the event of a moratorium on fellings in the forests of India: This multidisciplinary Committee was constituted in 1983 and it submitted its report in 1984;· The Inter Ministerial Group on Wood Substitution: This high level Group was constituted by the Ministry of Environment & Forests in 1985 and consisted of senior policy level functionaries of the Ministries of Environment & Forests, Commerce, Industry, Railways, Coal, Works & Housing, Science & Technology, chief functionaries of national laboratories dealing with forests and forest products and leading environmentalists. The Group submitted its report in 1986 in which several important recommendations were made;
· The Policy Advisory Group on Wood Substitution: This Group constituted in 1990 by the Ministry of Environment & Forests consisted of senior bureaucrats involved in formulating policies, top functionaries of national laboratories concerned with Material Science, senior representatives of user Ministries like Railways, Urban Development, etc., State governments and major industries. The Group submitted its report in 1992.
Based on the recommendations of these Expert committees and policy level Groups, the Govt. took several measures to supplement indigenous wood supplies with imports and substitute wood by non wood fibre sources. The decisions of relevance to Paper and Panel industries are summarized below.
· Exemption from obtaining import licence and provision to import logs, fuelwood, wood chips and wood pulp under Open General Licence (OGL);· Progressive reduction of import duty on wood, fuelwood and wood chips (from 60% + auxiliary Duty in 1984-85 to full exemption from import levies in the budget for 1997-98);
· Progressive reduction of import duty for paper and paperboard (from 140% + countervailing duty of 10% and Rs.2425 per tonne in 1992-93 to 20% import duty and 2% countervailing duty in 1996-97);
· Progressive reduction in import duty on pulp and wastepaper to 5% + 2% countervailing duty and total exemption of import duty on pulp for manufacturing newsprint with effect from 1995-96;
· Exemption from the provision of industrial licensing in respect of pulp and paper mills using "non conventional raw materials", i.e., non wood/bamboo to the extent of 75% and particleboard, fibreboard and MDF mills using such materials;
· Reduction in excise duty to 5% (for clearance up to first 10,000 tonnes in a year and thereafter 10%) for paper and board produced in mills using "unconventional" raw material up to 75% as against 20% excise duty for paper produced, using wood and bamboo. Reduction of excise duty on particleboard, fibreboard and MDF to 18%;
· Notifying that building boards manufactured out of non wood sources such as bagasse, cotton stalk, rice husk, etc., are environment friendly and eligible for ECOMARK (Govt. of India Notification No. 170 dated 17th May 1996).
The incentives, as may be seen from above details, are of two broad categories viz., liberalization of imports of raw material and impetus to utilization of non wood fibre sources. While both paper and pulp and panels industries have taken advantage of and benefited by liberalization of imports, it is only the pulp and paper industry which has taken advantage of incentives for utilizing non wood and recycled fibre sources, as evident from the increase in production of non wood fibre based paper and board from about 5% in 1970 to 36% in 1994-95 and 0 to 26% in respect of recycled fibre during the same period.