![]()
![]()
![]()
1.1 Rice in Asia
1.2 The Demand for Rice
1.3 The Demand-Supply Gap
1.4 Rice Outside Asia
Rice is a major food crop for the people of the world in general and Asians in particular; nearly 90% of the world's rice is produced and consumed in this region (Table 1.1). Furthermore, rice is a staple food for nearly 2.4 billion people in Asia, and except for Pakistan and some parts of India and China, rice provides two thirds of the calories for most Asians with rice-based diets.
Following the introduction of IR-8 rice during the 1960s, rice production in Asia grew at an unprecedented annual rate of 3.0% during 1967-85. Similar growth of world rice production also occurred during this period. For Asia, the output growth rate exceeded the population growth rate, which was about 2.14% (Tables 1.2 and 1.3).
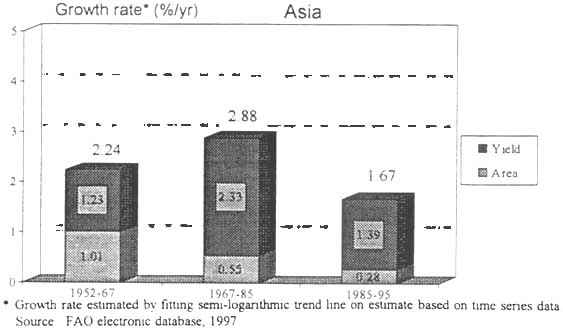
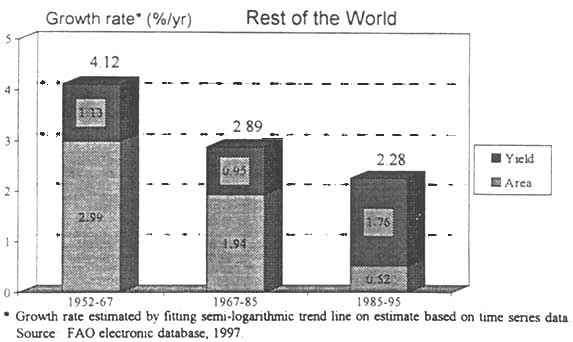
During the post-green revolution period, most growth in rice production was due to yield increases brought about by the introduction of new seed and fertilizer technology. The contribution of area increases to growth of output was small and declined over time (Figure 1.1). However, the growth rate in rice production has declined sharply from about 3% during the period 1967-85, to 1.7% during 1985-95 due primarily to a decline in the growth rate of rice yields, from 2.32% per annum during 1967-85 to 1.35% during 1985-95. A decline in growth rates of both output and yield has taken place in all the major rice producing countries in Asia except in India, where growth rates of both output and yield of rice rose significantly during 1985-95, (Tables 1.2 and 1.3 and Figure 1.1) because of the spread of new seed and fertilizer technology to the rainfed eastern regions where improved water management and irrigation facilities are being introduced.
The rapid growth in rice output during 1967-85 had positive effects. Firstly, it resulted in a decline in the real price of rice over the period, thereby benefiting a large percentage of the rural and urban poor people living in South and South East Asia (Figure 1.2). Secondly, the poor benefited because the yield increases led to increases in the incomes of numerous small and marginal farmers in that region who form a major proportion of the poor. However, the success achieved caused a general complacency about food security, and led to less investment in irrigation, agricultural research and extension, and other rural infrastructure that contributed to increased rice production.
The problems increased during the 1990s because of economic liberalization and tight fiscal policies, at both global and national levels. Agricultural research and investment commitments by multilateral agencies, already reduced during the 1980s, became even smaller. At the same time, there were indications of a further decline in the growth rate of yield increase, and stagnation of the highest yield levels attained in high-output irrigated rice, the predominant source of rice output. Despite the increasing use of fertilizers and other inputs, further increases in yields were becoming more difficult to achieve and more costly in terms of inputs, so that total factor productivity was tending to decline.
Table 1.1 Production, Import, and Export of Rice During the Triennium Ending 1995 (million tons)
|
Country/Continent |
Production |
Export |
Import |
Net Trade |
Consumption |
Self - Sufficiency Ratio (%) |
|
|
ASIA |
329.4 |
12.6 |
9.1 |
3.4 |
326 |
101 |
|
|
South Asia |
|||||||
|
|
India |
80.9 |
2.0 |
0.1 |
1.9 |
79 |
102 |
|
|
Bangladesh |
17.5 |
|
0.5 |
-0.5 |
18 |
97 |
|
|
Pakistan |
3.8 |
1.3 |
0.0 |
1.3 |
2 |
152 |
|
|
Sri Lanka |
1.5 |
|
0.1 |
-0.1 |
2 |
94 |
|
China |
121.1 |
1.1 |
1.0 |
0.1 |
121 |
100 |
|
|
East Asia |
|||||||
|
|
Indonesia |
31.8 |
0.2 |
1.3 |
-1.1 |
33 |
97 |
|
|
Vietnam |
16.4 |
2.1 |
|
2.1 |
14 |
115 |
|
|
Thailand |
13.5 |
5.1 |
|
5.1 |
8 |
161 |
|
|
Myanmar |
12.1 |
0.0 |
0.4 |
-0.4 |
12 |
97 |
|
|
Japan |
8.5 |
0.1 |
0.9 |
-0.7 |
9 |
92 |
|
|
Philippines |
7.0 |
|
0.2 |
-0.2 |
7 |
98 |
|
|
Korea, Rep. of |
4.4 |
|
0.0 |
0.0 |
4 |
100 |
|
|
Korea, DPR |
2.0 |
0.0 |
|
0.0 |
2 |
100 |
|
AFRICA |
9.2 |
0.3 |
3.7 |
-3.4 |
13 |
73 |
|
|
North Africa |
3.0 |
|
0.2 |
-0.2 |
3 |
94 |
|
|
|
Egypt |
3.0 |
0.2 |
0.0 |
0.2 |
3 |
108 |
|
|
Sub-Saharan Africa |
6.1 |
|
3.5 |
-3.5 |
10 |
64 |
|
|
Western Africa |
3.5 |
|
|
0.0 |
3 |
100 |
|
|
Central + Eastern & Southern Africa |
2.6 |
|
|
0.0 |
3 |
100 |
|
CENTRAL AMERICA |
1.2 |
0.0 |
1.2 |
-1.2 |
2 |
49 |
|
|
SOUTH AMERICA |
12.0 |
1.1 |
1.3 |
-0.2 |
12 |
98 |
|
|
|
Brazil |
7.0 |
|
0.9 |
-0.9 |
8 |
89 |
|
NORTH AMERICA |
5.3 |
2.8 |
0.4 |
2.4 |
3 |
182 |
|
|
|
United States |
5.3 |
2.8 |
|
2.8 |
2 |
214 |
|
EUROPE |
1.4 |
0.3 |
1.1 |
-0.8 |
2 |
64 |
|
|
CIS |
1.0 |
0.0 |
0.3 |
-0.3 |
1 |
76 |
|
|
OCEANIA (Australia) |
0.7 |
0.5 |
0.3 |
0.2 |
0 |
148 |
|
|
WORLD |
360.2 |
17.6 |
17.4 |
0.1 |
360 |
100 |
|
|
Asia |
329.4 |
12.6 |
9.1 |
3.4 |
326 |
101 |
|
|
Rest of the World |
30.9 |
5.0 |
8.3 |
-3.3 |
33 |
-1.0 |
|
|
Developing Countries |
343.3 |
13.8 |
14.1 |
-0.3 |
344 |
100 |
|
|
Developed Countries |
17.0 |
3.8 |
3.3 |
0.5 |
17 |
103 |
|
Source: FAO Food Outlook. Various Issues
Table 1.2 Rate of Growth of Population, Area, Production, and Yield
Source: United Nations World Urbanization Prospects: The 1994 Revision, New York 1995 FAO electronic database, 1997.
Table 1.3 Progress Made in Raising Productivity of Riceland in Different Parts of the World, 1951 to 1996
|
Region/country |
Average yield 1994-96 (tons/ha) |
Increase in yield ratesb/ (kg/ha/year) |
|||||
|
1951 to 1965 |
1965 to 1975 |
1975 to 1985 |
1985 to 1990 |
1990 to 1995 |
|||
|
Asia |
3.77 |
26 |
41 |
83 |
54 |
36 |
|
|
|
China a/ |
5.97 |
28 |
53 |
181 |
60 |
72 |
|
|
India |
2.82 |
16 |
29 |
53 |
80 |
41 |
|
|
Japan |
5.93 |
101 |
85 |
37 |
-103 |
-15 |
|
|
Korea |
6.12 |
43 |
119 |
93 |
-33 |
-23 |
|
Sub-Saharan Africa |
1.62 |
16 |
11 |
9 |
34 |
-8 |
|
|
South & Central America |
3.03 |
-1 |
13 |
44 |
64 |
89 |
|
|
World |
3.69 |
26 |
39 |
78 |
53 |
37 |
|
Notes: a/ China includes Taiwan; b/ Based on three-yearly averages centered around the year. Source: IRRI, World Rice Statistics, 1993-95 and FAO electronic database, 1997.
The sustainability of high yields was also becoming more doubtful because the heavy use of water and fertilizer in intensive systems was leading to some complex environmental hazards, such as pollution of groundwater and changes in soil structure.
Against the scenario of increasing rice production and supply, there was an increase in the growth rate of demand for rice. Also, the rice and total cereal demand scenario became more complex. Increased demand for rice was greatest in low-income countries and regions, where cheap carbohydrates to meet energy requirements are still the primary need of consumers In these countries, despite a declining trend, the demand elasticity's for rice and other cereals for both the low-income and high-income groups were quite high (Table 1.4). This increase in demand was caused both by accelerating growth of per capita incomes in most of these countries, and by quite high population growth rates. The food grain demand growth was particularly high in China, which had to resort to large imports of wheat. Trends for high growth in demand for total cereals including rice, are likely to continue in the low-income developing countries for at least the next two or three decades.
On the other hand, in some high-income Asian countries there were factors that caused a decline in total demand for rice and other food grains. Firstly, there was increasing evidence of declining population growth rates (Table 1.2). Secondly, and more importantly, the rapid rise in per capita incomes in countries such as Japan, Korea, and Taiwan, resulted in diversified food habits, with consumers moving away from rice and cereals to other foods In these countries, the demand elasticity for rice had become very low, was declining, and (in a few cases) had even become negative The economic prosperity in middle- and high-income countries caused smaller increases (for some countries even a decline) in per capita rice consumption (see Figure 1 3) There was much greater diversity in diet pattern, and willingness to pay higher prices for better quality rice This tendency is likely to become even stronger in the future as more countries reach high-income status Even for low-income countries with high growth rates in per capita income, food demand is likely to diversify from rice to fruits, vegetables, livestock products, and processed products For rice, this could mean that the demand pattern may change more from table rice as a source of staple carbohydrates to processed rice and non-rice substitutes.
Figure 1.2 Trend in World Rice and Wheat Prices, 1976-96.
Table 1.4 - Demand Elasticities for Rice in Selected Asian Countries
|
Country |
Type of Household |
Elasticity |
|
South Korea |
(Income Elasticity) |
|
|
Farm Households |
-0.135 |
|
|
Non-Farm Households |
-0.089 |
|
|
Thailand |
(Expenditure Elasticities) |
|
|
Rural Households |
-0.136 |
|
|
Urban Households |
-0.211 |
|
|
Taiwan |
(Expenditure Elasticities) |
|
|
Farm Households |
0.02 |
|
|
Non-Farm Households |
-0.21 |
|
|
Bangladesh |
(Expenditure Elasticities) |
|
|
All Rural Households |
0.41 |
|
|
All Urban Households |
0.27 |
|
|
India |
(Expenditure Elasticities) |
|
|
Rural Households |
0.20 |
|
|
Urban Households |
0.05 |
On balance, however, despite the visible decline in rice demand in high-income Asian countries, the aggregate demand for rice is expected to continue to grow at a rapid rate for decades Such growth will be due to the twin influence of expected rapid income growth and relatively high population growth in low-income South Asian countries.
Population growth rates in Asia have declined (Table 1 2), but despite this, the population is likely to grow at a relatively high rate of 1 7 to 1 8% per annum during 1995-2010. Demand elasticities for rice are also declining, but are likely to be in the range of 0.15 to 0.20 during the next fifteen years (Table 1 4) Taking both these into account, total rice demand in Asia is likely to grow by not less than 1 8 %, and in South Asia by more than 2% per annum.
Figure 1.3 Changes in Per Capita Rice Consumption, 1974-76 to 1989-91
Table 1.5 gives alternative demand projections for 2010 as estimated by IRRI, FAO and IFPRI. Except for IFPRI, which gives a low figure of 578 million tons, the other estimates project demand at about 612 million tons, up by about 150 million tons compared with the estimated current production of 463 million tons for Asia. The demand is thus expected to grow at a rate of 1.66% per annum, which is much higher than the demand growth rate of 1.43% recorded during 1985-95. Because of significant increases in food and feed demand consequent on the diversification of diets, total cereal demand is likely to grow at a much higher rate (Figure 1.4), and is likely to put pressure on the area under rice as cropping systems diversify. Hence, the entire growth in rice demand would have to be met through increased yield growth because more rice land may be diverted to other crops and to non-agricultural uses.
Table 1.5 Actual Output in 1993, and Alternative Projections of the Demand for Rice in Developing Asia (million tons of rice paddy)
|
Country/region |
1993 Actual Output |
Projections for 2010 |
||
|
FAO |
IFPRI |
IRRI |
||
|
China |
187 |
n/a |
216 |
228 |
|
India |
116 |
n/a |
154 |
160 |
|
Indonesia |
49 |
n/a |
62 |
66 |
|
East Asia |
200 |
396 |
230 |
243 |
|
Southeast Asia |
110 |
n/a |
142 |
152 |
|
South Asia |
153 |
216 |
206 |
216 |
|
Asia |
463 |
612 |
578 |
611 |
Growth Rate in Demand (% per year)
|
|
Asia |
South Asia |
China |
|
IFPRI |
1.31 |
1.76 |
0.85 |
|
FAO/IRRI |
1.66 |
2.05 |
1.17 |
Currently, Asia is not only meeting its own rice consumption demand, but also enjoys a net trade surplus of 3.4 million tons (Table 1.1). Since the rice production in the rest of the world is not expected to rise significantly, not much surplus is likely to emerge there in the future. In fact, without a technological breakthrough, Africa is likely to continue to depend on rice imports and food aid. The problem may become even more serious, because the 20 million tons of paddy grown in Japan and Korea, at a very high cost, is likely to decline in the future if they implement the GATT provisions on the liberalization of rice trade.
Consequently, the entire increase in rice demand would have to be met through enhanced production in Asia. Rice output in Asia should, therefore, grow at a minimum of 1.66% per annum during 1995-2010 to meet the growth in demand projected above. Notably, during the next period, almost the entire growth in output will have to come from growth in yield since there is little scope for the area under rice to increase. In fact, as discussed above, because of its likely diversion to other crops, the area under rice might even decline.
Figure 1.4 Projected Change in the Growth Demand for Cereals
During the decade 1985-95, rice production in Asia grew at 1.68% per annum. The growth rates of output and yield already show a perceptibly declining trend compared with the earlier period 1965-85 (Table 1.2). Especially notable is the decline in growth rate of yields from 2.32% per annum during 1967-85 to 1.35% during 1985-95. The deceleration in rate of growth of yield increase during the last decade took place because of a decline in investment in irrigation, and because farmers were approaching the yield ceiling with existing technologies, particularly in high-output irrigated systems.
This trend would have to be reversed and rates of yield growth would have to rise to 1.66% per annum from the current level of 1.35%. Keeping in view the current trend, this would be a challenge. Hence, it is necessary to take measures to raise rice production in Asia to avoid a serious erosion of the food security so painstakingly achieved during the last decade. This would require investment in irrigation, other infrastructure, and rice research. Special efforts would be needed to shift the yield frontier in irrigated systems and to close yield gaps, along with introducing yield-enhancing technologies in rainfed areas.
Only about 9% of the total world harvest is produced outside Asia, the other major producers being South and Central America, and Africa (Table 1.1). In South and Central America, rice production is scattered throughout the region, but taken together, these regions are self-sufficient.
The story is slightly different for Sub-Saharan Africa. In Madagascar and parts of West Africa, some populations eat rice as a staple diet. With rapid population growth, the demand for rice outstrips the supply, and Sub-Saharan Africa has resorted to large-scale imports; in 1995, these reached 35% of the consumption demand. This has serious implications for the food security of a large proportion of the poor in that region.
Current trends in production and consumption of rice in Sub-Saharan Africa highlight the serious food security challenges that many developing and poor countries and regions are likely to face during the early part of the next century. They further reinforce the urgent need to augment rice supplies by research and development.
![]()
![]()
![]()