![]()
![]()
![]()
Introduction
Trade conditions
Important influences on trade
Non-wood forest products (NWFPs)
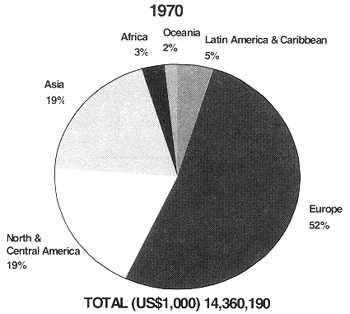
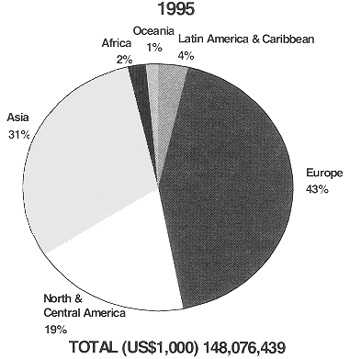
Globally, forest product exports were valued at about US$140 billion in 1995. While several Asia-Pacific countries are major exporters of forest products (exports totalled US$20 billion in 1995), the region's role as an importer is even more significant (US$44 billion). In 1995, the region accounted for 14 percent of world exports, up from 12 percent in 1970 (Figure 5.1). The region's share of imports was around 32 percent, up from 21 percent in 1970 (Figure 5.2).
Figure 5.1: Global forest product imports by region, 1970
Figure 5.1: Global forest product imports by region, 1995
Source: FAO.
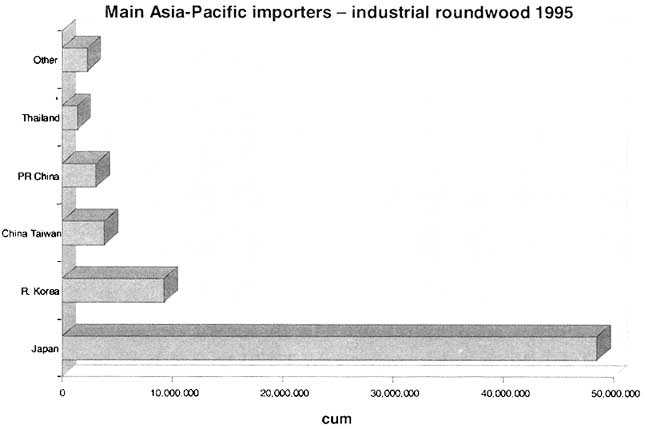
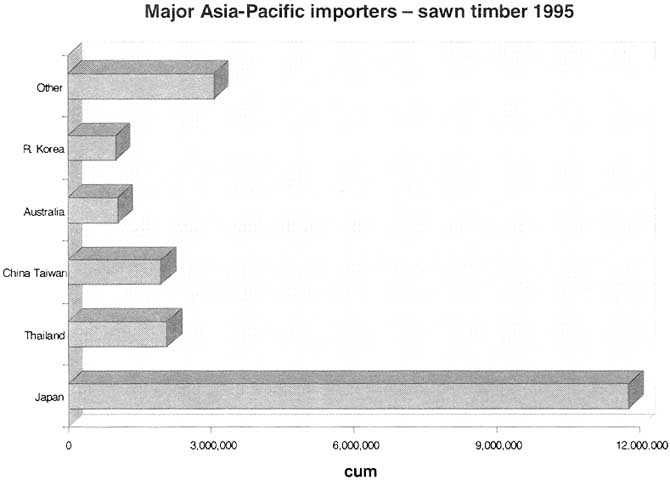
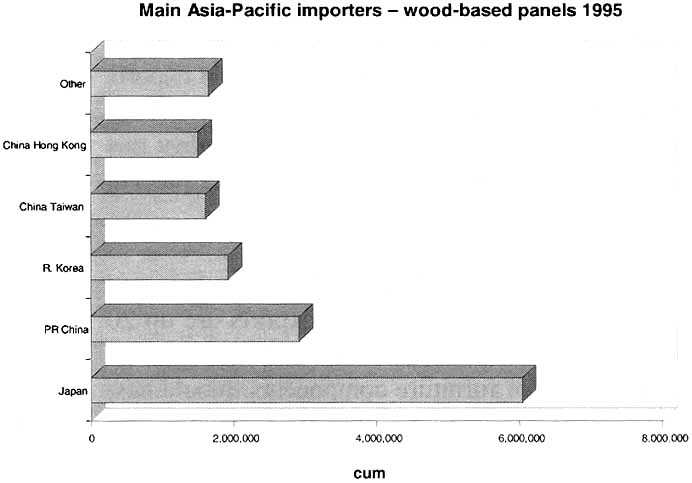
Japan is easily the largest forest products importer in Asia-Pacific and is in a class alone with the United States as a "mega-importer" (Table 5.1). The rapid growth of the Republic of Korea - notwithstanding recent economic shocks - has been sufficient to boost it into a second tier of global importers, along with the People's Republic of China.
Japan's imports of industrial roundwood and sawn timber are more than four times greater than those of the next largest importers in the region (the Republic of Korea and Thailand, respectively) (Figure 5.3). Japanese imports of wood-based panels are twice those of the People's Republic of China (the second-largest importer in the region).
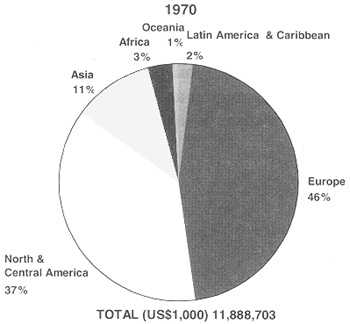
Figure 5.2: Global forest product exports by region, 1970
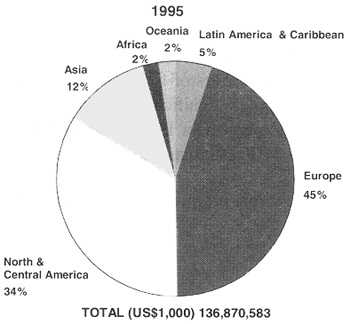
Figure 5.2: Global forest product exports by region, 1995
Source: FAO.
Table 5.1: Major global importers and exporters of forest products, 1995
|
Imports (US$1,000) |
Exports (US$1,000) | ||
|
United States |
22,448,040 |
Canada |
27,786,860 |
|
Japan |
19,485,870 |
United States |
18,148,300 |
|
Germany |
10,947,790 |
Finland |
11,953,190 |
|
Italy |
8,637,262 |
Sweden |
10,849,980 |
|
France |
8,197,550 |
Germany |
7,779,174 |
|
United Kingdom |
8,083,620 |
France |
5,850,807 |
|
Netherlands |
5,163,185 |
Indonesia |
4,727,553 |
|
The Republic of Korea |
4,972,032 |
Malaysia |
4,225,865 |
|
Belgium-Luxembourg |
4,066,241 |
Brazil |
3,547,061 |
|
Spain |
3,826,287 |
Austria |
3,360,990 |
|
The People's Republic of China |
3,383,015 |
Russian Federation |
3,230,725 |
|
- Taiwan Province of China |
3,840,477 |
Netherlands |
3,017,387 |
|
- Hong Kong SAR, China |
2,796,112 |
Italy |
2,874,407 |
|
Canada |
2,952,518 |
Bel-Lux |
2,790,723 |
|
Switzerland |
2,856,728 |
Norway |
2,179,431 |
Source: FAOSTAT.
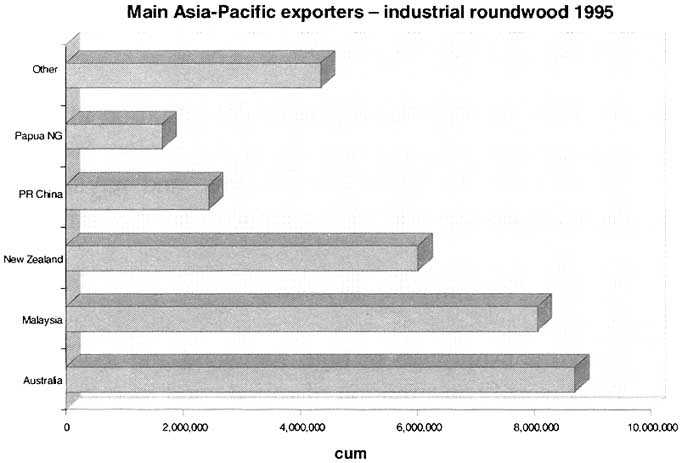
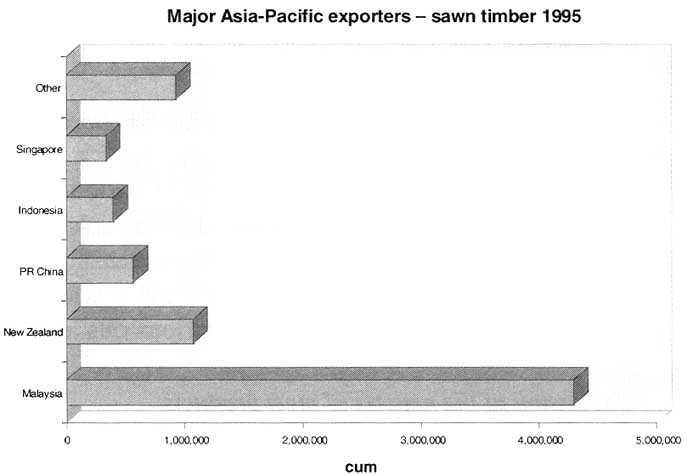
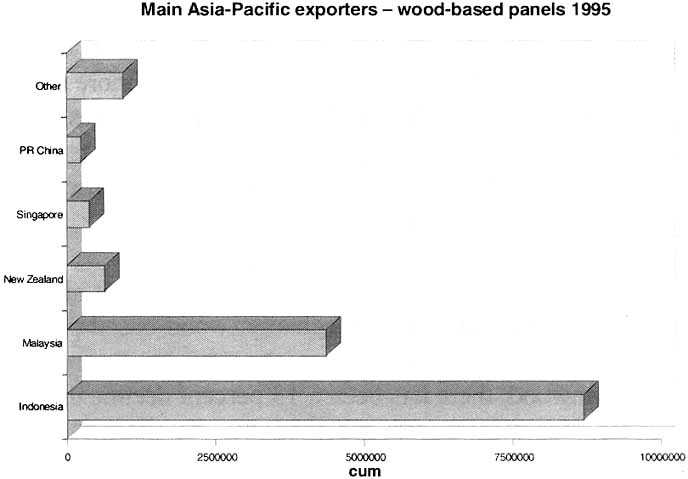
Figure 5.3: Main importers and exporters of solidwood forest products in Asia-Pacific
Source FAOSTAT
Changes in the forest resource
As a result of the rapid rate of deforestation in Asia and the Pacific, and global calls for sustainable forest management, many countries in the region are reducing timber harvests, changing management to more environmentally favourable systems, and paying more attention to non-economic factors. Actions such as these are having, and will continue to have, significant impacts on trade.
Expanded consumption of wood
Global consumption of both fuelwood and industrial wood has shown substantial growth in recent decades. Total world consumption of roundwood increased from around 2.4 billion cubic metres in 1970 to 3.4 billion cubic metres in 1995, a 36 percent rise. The level of consumption varies markedly by country and with the products involved. The main consumers in Asia and the Pacific are either the larger countries (i.e. India, the People's Republic of China and Indonesia) or the more developed countries (i.e. Japan and Australia). Total consumption in Asia and the Pacific now exceeds that of Europe in all products except wood-based panels. The implications of expanded consumption for forestry trade are obvious. Since growth in demand is not confined to forest-rich countries, by necessity trade will expand to meet shortfalls.
Non-wood forest products (NWFPs) receiving more attention
In addition to wood, the consumption of various NWFPs has been growing rapidly. It is difficult to place a figure on their significance because of a lack of data and in many cases a lack of formalised markets. Nonetheless, it is evident that they are increasingly being traded both domestically and internationally. Many countries in the Asia-Pacific region trade a wide variety of NWFPs, with the most extensive being rattan, bamboo, ginseng, mushrooms, and various oils and spices.
Expansion of the exports of most products
At a global level, exports of industrial roundwood have increased by 30 percent since 1970 to 121.7 million cubic metres. Sawnwood and wood pulp exports both have almost doubled to 108.5 million cubic metres and 31.4 million metric tonnes, respectively. Wood-based panel exports have increased fourfold to 41.4 million cubic metres. Paper and paperboard exports have trebled to 73.1 million metric tonnes. Similar growth has also occurred in the Asia-Pacific region for many of the products and in most cases the performance of the Asia-Pacific region has been a major factor in the global situation. In Asia-Pacific, since 1970, export volumes of sawnwood expanded strongly (more than doubled) to 7.5 million cubic metres; wood pulp exports increased eight-fold (to 1.0 million metric tonnes); wood-based panel exports increased fivefold to 15.2 million cubic metres; and paper and paperboard exports increased sevenfold to 6.3 million metric tonnes. Against this pattern, and unlike the global trend, Asia-Pacific industrial roundwood exports have decreased by 3.2 percent to 31.2 million cubic metres.
Conditions, however, have changed somewhat since 1990. For example since that time: industrial roundwood exports have declined marginally; wood-based panel exports are up 22 percent; wood pulp exports are up 20 percent; and paper and paperboard exports are up 60 percent, though from a small base. In the case of sawnwood, there has been a 13 percent decline during the 1990s. Exports of furniture components, mouldings, etc., have increased substantially. As markets have changed, resource conditions altered, product forms changed, and consumption levels within domestic markets altered, there have been substantial changes in the importance of different countries as exporters.
Table 5.2: Major Asia-Pacific forest product exporters and importers
|
Country |
Exports-1995 (US$1,000) |
|
Indonesia |
4,727,553 |
|
Malaysia |
4,225,865 |
|
Japan |
1,781,177 |
|
New Zealand |
1,634,147 |
|
The Republic of Korea |
1,210,245 |
|
The People's Republic of China |
767,715 |
|
- Hong Kong SAR, China |
853,774 |
|
- Taiwan Province of China |
716,577 |
|
Singapore |
746,262 |
|
Australia |
737,797 |
|
Thailand |
552,939 |
|
Papua New Guinea |
536,220 |
|
Myanmar |
307,303 |
|
Cambodia |
171,139 |
|
Solomon Islands |
115,219 |
|
Philippines |
91,323 |
|
Laos |
70,427 |
|
Viet Nam |
62,087 |
|
Fiji |
37,385 |
|
India |
34,516 |
|
Other |
27,291 |
|
TOTAL Asia-Pacific |
19,406,961 |
|
Country |
Imports-1995 (US$1,000) |
|
Japan |
19,485,870 |
|
The Republic of Korea |
4,972,032 |
|
The People's Republic of China |
3,383,015 |
|
-Taiwan Province of China |
3,840,477 |
|
-Hong Kong SAR, China |
2,796,112 |
|
Thailand |
2,458,975 |
|
Australia |
1,814,759 |
|
Singapore |
1,234,403 |
|
Malaysia |
987,386 |
|
Philippines |
983,218 |
|
Indonesia |
847,879 |
|
India |
357,944 |
|
New Zealand |
317,853 |
|
Pakistan |
154,902 |
|
Sri Lanka |
101,826 |
|
Viet Nam |
95,403 |
|
Bangladesh |
59,102 |
|
Korea DPR |
46,597 |
|
Brunei |
28,101 |
|
Macau |
23,269 |
|
Other |
93,491 |
|
TOTAL Asia-Pacific |
44,082,614 |
Source: FAOSTAT.
Increased proportion of production exported
Globally, the share of total production that is exported has increased for all products except industrial roundwood. This situation is also generally reflected in the Asia-Pacific region. For example, in Asia-Pacific the proportion of sawnwood production exported increased from 10 percent in 1970 to 24 percent in 1995; the share of wood-based panels (mainly plywood) exported increased from 22 percent to 34 percent; the share of wood pulp exported increased from 1 percent to 5 percent; and the share of paper and paperboard exported increased from 5 percent to 7 percent. By contrast, the share of industrial roundwood production that was exported fell from 18 percent to 11 percent.
A few countries dominate both exports and imports
In 1995, five countries accounted for 55 percent of world exports of forest products and ten accounted for 70 percent. Canada and the United States alone accounted for almost one-third. On the import side, five countries accounted for 48 percent and ten countries for 66 percent. The United States and Japan alone were responsible for almost one-third. As with the global situation, a small number of Asia-Pacific countries account for the bulk of the region's exports and imports. In 1995, five countries accounted for 72 percent of the region's exports of forest products and ten accounted for 92 percent. The major exporters are Indonesia and Malaysia, which together account for almost half of the total. Malaysia (mainly Sarawak) is the world's third largest exporter of logs (after United States and the Russian Federation) and the seventh largest exporter of sawnwood (Table 5.2).
Asia-Pacific countries account for 29 percent of world forest products exports, but 67 percent of the world's plywood exports. Indonesia dominates plywood exports with 45 percent of the world market, while Malaysia has been expanding its share in recent years and in 1995 accounted for 19 percent. Sixty percent of the region's pulp exports are provided by New Zealand; and five countries provide three-quarters of the region's paper and paperboard exports. The People's Republic of China, Indonesia and the Republic of Korea are increasing their exports of these latter products. Exports of logs from Asia-Pacific countries have reduced only slightly since 1990 but there has been a major change in the source of these logs. There has been a substantial (60 percent) reduction by Malaysia, the largest exporter, counterbalanced by a strong increase by New Zealand and to a lesser extent the People's Republic of China, Cambodia, Papua New Guinea, Fiji and Myanmar.
Changing product mix for exports
Although expanding in absolute terms, globally industrial roundwood's share of the value of total forest product exports dropped from a peak of 15 percent to 8 percent, largely since the early 1980s (Table 5.3). This trend seems likely to continue. Wood pulp's share has declined steadily as importers have moved to importing final products. Sawnwood exports have remained relatively stable. By contrast, the share of both wood-based panels, and paper and paperboard increased, reflecting the growing emphasis on higher-value forest products in world trade. Paper and paperboard products now account for approximately 46 percent of the value of world forest product exports, followed by sawnwood (17 percent), wood pulp (16 percent) and wood-based panels (11 percent). Similar trends have taken place in the Asia-Pacific region where the importance of industrial roundwood has declined, while that of sawnwood remained static and wood-based panels and paper and paperboard rose.
Table 5.3: Share of products in total exports - 1970 and 1995 (percent by value)
|
Commodity group |
Asia-Pacific |
World |
||
|
1970 |
1995 |
1970 |
1995 |
|
|
Industrial roundwood |
45 |
17 |
15 |
9 |
|
Sawnwood |
15 |
15 |
21 |
17 |
|
Wood-based panels |
25 |
34 |
9 |
11 |
|
Wood pulp |
1 |
3 |
20 |
16 |
|
Paper and paperboard |
14 |
31 |
34 |
46 |
|
|
100 |
100 |
99 |
99 |
Declining significance of tropical products
Despite the substantial attention they receive, tropical forest products represent only a small share of global exports for most product categories. Tropical roundwood production is estimated to represent about 15 percent of world industrial roundwood production. Tropical products account for small but varying shares of the total exports of different product categories: 20 percent of industrial roundwood exports; 10 percent of sawnwood exports; less than 10 percent of pulp and paper and paperboard product exports; and 39 percent of wood-based panel exports. Tropical plywood, however, accounts for 71 percent of global plywood exports.
In Asia and the Pacific, export volumes of tropical logs and sawnwood have reduced substantially since 1990, while those of panels, pulp and paper and paperboard have risen slightly. The decline in log and sawnwood exports is due to various factors, with regional totals frequently masking considerable country changes. The decline in tropical log exports largely reflects a reduction by Malaysia, which reduced the harvest level in Sarawak and banned log exports temporarily from Sabah (partially lifted in 1996). The reduction in sawnwood exports reflects a drop by Malaysia and Singapore. The increase in panel exports reflects increased exports from Malaysia and Indonesia, despite reduced exports by Singapore and Hong Kong SAR, China. The rise in paper and paperboard exports is due to increases by Indonesia, Thailand and Hong Kong SAR, China.
Increasing imports
In addition to their traditional position as exporters, as their economies have grown a number of Asia-Pacific countries have increased their importance as importers, and also their share of global imports. This has occurred mainly with logs and semi-finished wood products, but also paper products in some cases. Five countries account for 78 percent of the region's forest product imports, with Japan alone importing a 44 percent share. While Japan is by far the largest single importer in Asia, imports by a number of the developing countries are growing rapidly. Of note are the Republic of Korea, the People's Republic of China and Thailand.
India is also showing increased and significant potential as an importer because of its size, recent relaxations of import restrictions, and harvesting controls in natural forests have been imposed in some regions of the country in an effort to preserve declining resources. A major challenge for India will be to rapidly develop adequate infrastructure to support the opening of its markets to import competition. India's per capita consumption of industrial roundwood is among the lowest in the world as a result of heavily constrained domestic production and (until recently) an effective embargo on importing forest products through extremely high trade barriers and administrative complexity of import procedures. As a consequence, the first shipments of logs arriving at India's ports face uncertain transportation and processing facilities that must rapidly adapt to log dimensions and species that may be generally unfamiliar, or inappropriate for installed technology. Especially in the case of sawmilling, but also in other sectors of wood processing, many enterprises in India tend to be small. Exporters to this fairly dispersed market may initially face significant transaction costs.
Changed supply levels from major suppliers outside the Asia-Pacific region
One area with a considerable impact on the region has been the Russian Far East. This area's market situation changed significantly in recent years. For many years, the former USSR (largely Russia) has been a major supplier of logs to Asia, particularly to Japan, but also to the Republic of Korea and the People's Republic of China. Total exports of industrial roundwood from the USSR reached a peak of 21 million cubic metres in 1988 and then declined to around 12 million in 1991. The Russian Far East has again increased exports since the early 1990s, and in 1995 exports matched the 1988 level. The main Asian markets accounted for about one-quarter of the total Russian Far East exports in 1995.
The overall trade pattern of the region and its reliance on other regions is largely influenced by the purchasing patterns of Japan (Box 5.1). Japan depends on imports for about 80 percent of its consumption. Since the late 1960s, imported wood has steadily increased its share in the Japanese market due to its price advantage over domestic timber, supply capacities and distribution systems. Almost half of Japan's forestry imports are sourced from North America, which provides a dominant source of coniferous wood products, notably logs, sawn timber and wood pulp.
Japan also imports significant amounts of logs from the Russian Far East, an area where poor infrastructure is known to be a significant barrier to rapid increase in harvests. Recently, Japan and Russia made progress on the status of the Kuril Islands that may lead to resolution of this long-standing issue. Should this happen, some policy barriers to Japanese investment in Russia could disappear. The possibility exists that investments in Russian Far East infrastructure would improve accessibility of the forest resource enough to significantly alter the wood trade patterns into Japan.
|
Box 5.1: CASE STUDY: JAPAN - THE KEY MARKET IN THE ASIA-PACIFIC REGION Dominance as a market for the region Japan is, without doubt, the pivotal market for forest products in the Asia-Pacific region. In 1995, Japan's gross trade in forest products totalled more than US$21 billion and comprised 33 percent of all forest products trade in the region. Japan is heavily forested with 67 percent of the country's total land area under forest, but its annual harvest of industrial roundwood is only about 23 million cubic metres per annum. Very high forest harvesting costs in Japan make it financially more logical to import forest products than to harvest trees domestically. Japan's imports of industrial logs in 1995 totalled 48 million cubic metres, and imports of processed forest products (sawn timber, panels, pulp and paper) were estimated to have a roundwood equivalent of 72 million cubic metres. Thus, Japan's turnover (production + imports) of forestry products has a roundwood equivalent of approximately 143 million cubic metres - an amount equal to almost exactly half of the Asia-Pacific region's total industrial roundwood harvest. Japan's dominance of the industrial wood market has a number of important policy implications for the region. Most significantly, if Japan unilaterally (and substantially) reduced wood consumption (or alternatively, substantially increased domestic wood production), there would be both a significant lessening of industrial harvesting pressures on the region's forests, and a significant economic dislocation for forestry producers in the region. By extension, through its domestic policies, Japan has significant leverage to change behaviour throughout the region. For example, Japan's targeting of a 55 percent recycled component in pulp and paper products has significant impacts outside of Japan. Profile of supply sources and of demand Total supply of wood: The 1995 Japanese timber supply totalled 111.9 million cubic metres, of which 20 percent (22.9 million cubic metres) was domestic and 80 percent (89 million cubic metres) was imported. Of the total supply, the percentage breakdown by enduse is as: | ||||||
|
|
Imported |
Domestic |
Total |
Domestic (%) | ||
|
Total |
89.02 |
22.92 |
111.94 |
20.5 | ||
|
Logs |
|
25.87 |
|
| ||
|
Rdwd equiv. of sawnwood |
15.98 |
16.25 |
32.23 |
50.4 | ||
|
Rdwd equiv. veneer & plywood |
6.99 |
0.23 |
7.22 |
3.2 | ||
|
Chips |
26.42 |
0.00 |
26.42 |
| ||
|
Pulpwood |
11.99 |
5.97 |
17.96 |
15.5* | ||
|
Others |
1.77 |
0.45 |
2.22 |
20.3 | ||
|
Note:* = percent of total of "chips" and "pulpwood". Demand for roundwood for sawn timber; the factory intake of logs was 36.7 million cubic metres in 1995, with the breakdown by sources of supply (in million cubic metres) being: | ||||||
|
|
Volume (million m3) |
% | ||||
|
Total supply |
36.67 |
100 | ||||
|
Domestic supply |
16.25 |
44 | ||||
|
Foreign supply |
20.42 |
56 | ||||
|
Of which: | ||||||
|
North America |
13.38 |
65 | ||||
|
Russian Far East |
4.00 |
20 | ||||
|
New Zealand |
1.37 |
7 | ||||
|
Tropical Asia |
1.25 |
6 | ||||
|
Other sources |
0.42 |
2 | ||||
|
Under current plans, Japan intends to achieve a self-sufficiency ratio of 50 percent for sawnwood in about 25 years (i.e. around year 2023). Demand for other categories of roundwood: (i) For plywood-. Production of ordinary plywood in Japan was 4.4 million cubic metres in 1995. Roundwood delivered to plywood factories totalled 7.3 million cubic metres, of which 0.2 million cubic metres (3 percent) was domestic and 7.1 million cubic metres was foreign. Recently, a major increase in the use of coniferous wood in plywood manufacture has occurred. Most coniferous species utilised include Russian larch and New Zealand radiata pine. (ii) For pulpwood. Demand for pulpwood in 1995 was 37.2 million cubic metres as input into producing 29.7 million tonnes of paper and paperboard. The paper and pulp industry has already been promoting paper recycling and by 1995 the recycling ratio had reached the relatively high ratio of 53.4 percent. The industry is aiming to achieve "56 percent recycling of used paper by the year 2000." Source: Adapted from Forestry Agency (1998): Country Report - Japan: Document APFSOS/W P/15. | ||||||
Tropical wood is still a significant element of Japan's imports. Of this, Indonesia and Malaysia provide the bulk (almost 24 percent of Japan's imports were sourced from these two countries in 1995, mainly as logs, sawn timber and plywood). Other major wood suppliers are the Russian Federation (5 percent of value of total forestry imports), New Zealand (3 percent) and Papua New Guinea (2 percent) for mainly logs; Australia (3 percent) and Chile (2.5 percent) for woodchips; and the Scandinavian countries (3 percent) mainly for paper products.
Despite its huge size, Japan's market is mature. In the future, apart from possible shifts in import-dependency, the most important aspects of the Japanese trade market will be where its imports are obtained.
The other key market in Asia is the People's Republic of China. Its size and growth potential make it an important country to monitor as a key emerging market (Box 5.2).
|
Box 5.2: DEVELOPMENTS IN A MAJOR EMERGING MARKET - THE PEOPLE'S REPUBLIC OF CHINA The People's Republic of China is likely to be one of the most influential markets in the region in the future. Significant changes are occurring in the Chinese market,49 Between 1981 and 1992, for example, roundwood dominated Chinese forest product imports, accounting for 32 percent of the total value. Paper and paperboard accounted for an additional 29 percent, followed by pulp and wastepaper (19 percent) and finally plywood (18 percent). In recent years, however, due to log-export bans adopted by other countries and the subsequent increase in the price of logs, China has dramatically reduced its imports of logs, while increasing imports of plywood, veneer, paper and paperboard. The amount of pulp, wastepaper and sawn timber imported into the country has remained steady. 49 For details, see Country Report - The People's Republic of China: Document APFSOS/WP/14, 1977. There have also been changes in the species that are imported. Before 1991, coniferous species dominated roundwood imports but since 1992, the proportion of conifers has declined from about 89 percent (in 1988) to only about 36 percent (in 1994). There is also a shift in the sources of imports. The coniferous roundwood imports of China previously were mainly from the United States (the United States proportion in China's coniferous roundwood imports in 1988-1989 was nearly 62 percent). However, due to the high price of United States products, China's imports of coniferous roundwood have shifted toward Russia and New Zealand. China's imports of hardwood logs, plywood, veneer and even sawn timber are primarily tropical products. The country's imports of tropical forest products between 1988 and 1994 rose very rapidly. Tropical roundwood imports rose an average of 13.7 percent annually; plywood 10.4 percent; veneer 49 percent; and sawn timber 22.5 percent. Both roundwood and plywood imports exceeded 2 million cubic metres annually but sawnwood was only about 0.7 million cubic metres in 1994. Source: Country Report - The People's Republic of China: Document APFSOS/W P/14,1977. |
Changing trade status
A number of countries in the region are becoming either increasingly dependent on imports, or have reduced the extent to which they export. These changes have been caused by a number of factors, such as the increasing demands of domestic markets, and reduced supply due to the increased pressure on the forest resource and the changing demands being placed on it. The only country in the region that remains a net exporter in all five major product categories is New Zealand, which has substantially increased exports of all products except paper and paperboard.
Only four countries (Indonesia, Malaysia, New Zealand and Papua New Guinea) are significant net exporters, with net exports of over $500 million from each country (Table 5.4). Several countries have changed their status: the Philippines is now a net importer of all products except pulp; Thailand is a net importer of logs, sawnwood, and panels; and Singapore has become a net importer of sawnwood and panels. Malaysia has increased panel exports and furniture but has reduced log and sawnwood exports, and is now importing increasing volumes of paper and paperboard. Indonesia has continued its exports of solid wood products and of paper and paperboard, but is increasing its imports of pulp. The Republic of Korea has increased its imports of sawnwood, wood-based panels and pulp while the People's Republic of China has increased imports of all products.
Table 5.4: Net forest products trade in the major Asia-Pacific countries
|
|
Imports (US$1,000) |
Exports (US$1,000) |
Net trade (US$1,000) |
||||||
|
|
(- equals net importer) |
||||||||
|
1970 |
1990 |
1995 |
1970 |
1990 |
1995 |
1970 |
1990 |
1995 |
|
|
Japan |
1,893,353 |
13,150,350 |
19,485,870 |
223,223 |
1,567,013 |
1,781,177 |
-1,670,130 |
-11,583,337 |
-17,704,693 |
|
Rep. Korea |
166,017 |
2,758,361 |
4,972,032 |
103,436 |
479,851 |
1,210,245 |
-62,581 |
-2,278,510 |
-3,761,787 |
|
The People's Republic of China |
22,744 |
1,455,300 |
3,383,015 |
15,334 |
253,272 |
767,715 |
-7,410 |
-1,202,028 |
-2,615,300 |
|
-Taiwan POC50 |
69,526 |
1,505,877 |
3,840,477 |
115,456 |
495,791 |
716,577 |
45,930 |
-1,010,086 |
-3,123,900 |
|
-Hong Kong SAR |
85,005 |
1,725,543 |
2,796,112 |
11,664 |
738,521 |
853,774 |
-73,341 |
-987,022 |
-1,942,338 |
|
Thailand |
30,997 |
1,035,196 |
2,458,975 |
11,026 |
122,613 |
552,939 |
-19,971 |
-912,583 |
-1,906,036 |
|
Australia |
204,442 |
1,441,164 |
1,814,759 |
16,928 |
415,609 |
737,797 |
-187,514 |
-1,025,555 |
-1,076,962 |
|
Philippines |
33,434 |
227,989 |
983,218 |
290,534 |
116,448 |
91,323 |
257,100 |
-111,541 |
-891,895 |
|
Singapore |
77,705 |
897,272 |
1,234,403 |
56,520 |
753,822 |
746,262 |
-21,185 |
-143,450 |
-488,141 |
|
India |
47,539 |
587,318 |
357,944 |
16,027 |
39,247 |
34,516 |
-31,512 |
-548,071 |
-323,428 |
|
Pakistan |
16,450 |
157,312 |
154,902 |
146 |
25 |
1,000 |
-16,304 |
-157,287 |
-153,902 |
|
Sri Lanka |
9,536 |
74,252 |
101,826 |
37 |
246 |
6,182 |
-9,499 |
-74,006 |
-95,644 |
|
Korea DPR |
1,879 |
4,552 |
46,597 |
0 |
1,151 |
6,406 |
-1,879 |
-3,401 |
-40,191 |
|
Viet Nam |
6,727 |
6,637 |
95,403 |
0 |
102,936 |
62,087 |
-6,727 |
96,299 |
-33,316 |
|
Fiji |
2,557 |
9,122 |
20,930 |
361 |
22,774 |
37,385 |
-2,196 |
13,652 |
16,455 |
|
Laos |
1,594 |
950 |
1,108 |
1,715 |
20,493 |
70,427 |
121 |
19,543 |
69,319 |
|
Solomon Islands |
91 |
679 |
833 |
3,118 |
34,953 |
115,219 |
3,027 |
34,274 |
114,386 |
|
Cambodia |
1,335 |
99 |
1,827 |
2,248 |
6,370 |
171,139 |
913 |
6,271 |
169,312 |
|
Myanmar |
7,414 |
4,726 |
11,366 |
23,933 |
158,971 |
307,303 |
16,519 |
154,245 |
295,937 |
|
Papua New Guinea |
3,012 |
5,411 |
5,501 |
7,167 |
126,613 |
536,220 |
4,155 |
121,202 |
530,719 |
|
New Zealand |
20,162 |
211,288 |
317,853 |
73,707 |
785,181 |
1,634,147 |
53,545 |
573,893 |
1,316,294 |
|
Malaysia |
31,220 |
494,777 |
987,386 |
302,635 |
3,139,560 |
4,225,865 |
271,415 |
2,644,783 |
3,238,479 |
|
Indonesia |
29,580 |
455,908 |
847,879 |
87,997 |
3,140,082 |
4,727,553 |
58,417 |
2,684,174 |
3,879,674 |
50 Taiwan Province of China.
Changing trade patterns
Trade patterns have changed substantially in the region over the past decade, particularly through increasing trade between developing countries. Countries such as the People's Republic of China, the Republic of Korea, Thailand and the Philippines have increased their imports from outside the region but also (and increasingly) from other countries in the region such as Myanmar, Papua New Guinea, Solomon Islands, Vanuatu and New Zealand. Japan has also changed some of its sources and some of the products it imports. It is importing from new suppliers outside the region such as Africa and Scandinavia, as well as from new countries within the region. The changes in the direction of trade reflect a wide range of factors including changes in resource availability from natural forests, investment decisions (both relating to forests and processing plants), market preferences and recent attitudes to environmental issues.
On a macro-scale, three regions dominate the global trade in forest products. Europe, the largest region, is effectively self sufficient in forestry products with total exports and imports very broadly in balance. North America is a significant net exporter of forest products. The Asia-Pacific region is a major net importer. Patterns of trade for individual forest products, however, show more variation. For industrial roundwood Asia-Pacific is by far the dominant importing region, while both the former USSR (15.2 percent) and Africa (10.4 percent) provide significant shares of global exports. The Asia-Pacific (especially Indonesia) and Latin America export wood-based panels that help to balance supply shortfalls in Europe, while North America is effectively self-sufficient in panels. For paper and paperboard, Europe and North America provide 85 percent of globally-traded production, with all other regions being net importers of this capital-intensive product.
Most Asia-Pacific exports are traded within the region (Tables 5.5 and 5.6). For imports, however, other regions remain quite important as suppliers, especially North America and the Russian Far East.
Table 5.5: Main trading partners of Asia-Pacific exporters, 1995
|
Major Asia-Pacific forest products trading partners | ||
|
Exporters |
US$1,000 |
Main trade partners |
|
Indonesia |
4,727,553 |
Japan, the Republic of Korea, United States, and Hong Kong SAR, China |
|
Malaysia |
4,225,865 |
Japan, the People's Republic of China and Hong Kong SAR, China, Thailand, the Republic of Korea and Singapore |
|
Japan |
1,781,177 |
United States, Canada, Malaysia, Russian Federation, Chile, New Zealand, Finland, Brazil |
|
New Zealand |
1,634,147 |
Japan, Australia, the Republic of Korea, the People's Republic of China |
|
The Republic of Korea |
1,210,245 |
United States, Canada, Indonesia, Malaysia, New Zealand, Chile, Russian Federation |
|
Total Asia-Pacific |
19,406,961 |
|
Source: FAOSTAT.
Table 5.6: Main trading partners of Asia-Pacific importers, 1995
|
Major Asia-Pacific forest products trading partners | ||
|
Importers |
US$1,000 |
Main trade partners |
|
Japan |
19,485,870 |
United States, Canada, Malaysia, Indonesia, Russian Federation, Chile, New Zealand |
|
The Republic of Korea |
4,972,032 |
United States, Canada, Indonesia, Malaysia, New Zealand, Chile |
|
The People's Republic of China |
3,383,015 |
Malaysia, France, Indonesia, Canada, United States |
|
- Taiwan Province of China |
3,840,477 |
Malaysia, France, Indonesia, Canada, United States |
|
- Hong Kong SAR, China |
2,796,112 |
United States, Indonesia, Malaysia, Canada, Germany |
|
TOTAL Asia-Pacific |
44,082,614 |
|
Source: FAOSTAT.
|
Box 5.3: VALUE-ADDED PROCESSING IN MALAYSIA, THAILAND, THE PHILIPPINES AND VIET NAM Malaysia: Malaysia provides the most graphic illustration of the trend toward further processing in Asia and the Pacific. Malaysia's exports of major wood-based products have increased nearly three-fold (from RM4.3 billion to RM12.3 billion) between 1985 and 1995.51 However, the export mix has changed dramatically. Exports of logs declined from 65 percent of total export value in 1985 to only 18 percent in 1995. Exports of sawn timber also declined, as sawmillers were encouraged to add higher value to their products. By contrast, exports of downstream products like plywood, veneer, mouldings and furniture have expanded rapidly. Furniture moved from an export share of 0.3 percent in 1985 to 13.6 percent in 1995; the export value of mouldings grew almost threefold during the same period. Rubberwood has become the leading timber for value-added exports. In 1995, 95 percent of total furniture exports were wood-based, of which 80 to 85 percent were rubberwood-based. 51 Details are in the Country Report - Malaysia: Document APFSOS/WP/07. FAO, Rome/Bangkok. Malaysia's Second Industrial Master Plan (IMP2) specifically aims to generate maximum value from Malaysia's forest resources and to make Malaysia a highly visible and reputable manufacturer of furniture and mouldings/joinery. Priority projects for the wood-based industry identified under IMP2 are: · to establish furniture complexes to encourage furniture production for export markets; · to establish integrated rubberwood processing plants to maximise the utilisation of different sizes and quality of rubberwood; and · to establish timber processing zones in Sabah and Sarawak to encourage local processing. The Malaysian developments reflect a regional pattern toward the export of value-added products. Thailand: The Thai furniture industry's expansion is export driven. Total furniture exports in 1990 were valued at US$240 million, of which wooden furniture accounted for US$101.7 million. The export of furniture and parts was one of fastest growing export sectors in Thailand in the 1980s with value growth of about 47 percent annually between 1986 and 1990, and continuing the upward trend. The government, in its drive to make Thailand one of the largest furniture production centres in Asia has provided numerous incentives. Rubberwood furniture accounts for 80 to 85 percent of total wooden furniture exports and is the fastest growing sub-sector within the furniture industry. The Philippines: There has been a dramatic shift in the composition of forest product exports from the Philippines. By 1994, the volume of exported logs, lumber veneer and plywood had decreased to only 7.5 percent of the level of 1984. By contrast, the export value of wood-based manufactured articles had increased from US$52.3 million to US$130.1 million and forest-based furniture earned US$280.2 million in 1994, compared with zero foreign earnings in 1984. The export value of wood-based manufactured articles and furniture comprised 87 percent of total forest product export value in 1994, compared with only 16 percent in 1984. Viet Nam: Value-added manufacturing is partly driven by the current shrinkage of forested area which has led the Government of Viet Nam to limit timber extraction from natural forests and the export of roundwood and semi-processed timber. An apparent benefit of the policy is that, despite a decrease in annual roundwood removals from 927,000 cubic metres in 1991 to 310,000 cubic metres in 1995, export earnings from forest products (after a temporary fall) have rebounded (from US$175.5 million in 1991 to US$135.6 million in 1995). Earnings from cabinet-work have increased most rapidly. Source: For Malaysia - adapted from Baharuddin (Personal communication, January 1998); for Thailand- Document APFSOS/WP/46; for the Philippines - Document APFSOS/WP/33; for Viet Nam - Document APFSOS/WP/31. |
Increased trade in higher value products
Paper and paperboard products presently comprise approximately 44 percent of the value of world forest product exports, followed by sawnwood (21 percent) and wood-based panels (13 percent). Additionally there has been an expansion in trade of products such as builders' woodwork and furniture. Although there is still substantial trade in unprocessed logs and woodchips between some countries in Asia and the Pacific, exports have tended to move toward value-added products such as plywood and secondary wood products (Box 5.3). Exports of furniture components, mouldings, etc., have increased substantially, a trend that is largely driven by a few countries. For example, Malaysian exports of secondary processed products have increased fourfold in value over the period 1990-1994 (mouldings rose by 30 percent and furniture rose almost sevenfold); those of Indonesia trebled; those of Thailand doubled; and the Philippines, Singapore and Hong Kong SAR, China showed increases of around 20 percent.52
52 ITTO "Annual Review and Assessment of the World Tropical Timber Situation 1996." ITTO, 1997.
Substitution of materials and products
Allied with the move toward higher-value products, there has been a substitution of non-traditional raw materials, such as rubberwood, coconut wood and rattan for traditional wood products in many countries. In Japan, softwoods are increasingly substituting hardwoods.
Developments related to tariffs
Non-tariff barriers (NTBs)
Impediments to trade
Moves to liberalise trade and increasing environmental pressures are two of the major change factors influencing forest product trade in Asia and the Pacific (and the rest of the world).
Tariff barriers have been declining steadily for a number of years. A major influence on this has been the international multilateral trade negotiations held under the auspices of the GATT/WTO. Very few large developed importing countries now apply significant tariffs on most forest products. Tariffs, however, are still a problem for some products, such as plywood, builders' woodwork and furniture. Even a relatively low duty can create problems for distant suppliers. Problems are especially acute in the competitive basic commodity product categories where price competition is greatest.
In the future, tariffs will continue to decline as the Uruguay Round results are implemented and as additional regional and bilateral negotiations take effect.53 As a result of the Uruguay Round, many tariffs will be reduced over a period of years. The extent and the speed of the reductions will vary considerably between countries and also products, and in some cases the phased reductions may take up to 15 years to be fully achieved.
53 The Uruguay Round was formally signed into force in 1994. For fall details see Barbier, E.B. "Impact of the Uruguay Round Agreement on International Trade in Forest Products," FAO, 1996, and Bourke, I.J. "The Uruguay Round Results - an Overview." hi Tropical Forest Update, ITTO, Vol. 6 (2), September 1996.
The reductions agreed to by developed countries in the Uruguay Round have been estimated by GATT to average (on a trade-weighted basis) 43 percent for solid wood products, and 99 percent for pulp and paper products. For paper and paperboard products, the main importers (i.e. United States, Canada, European Union, and Japan), together with some smaller importers, will phase out tariffs completely over an 8- to 10-year period. Similarly, some major importers such as the European Union, Japan and the United States have agreed to eliminate tariffs completely on furniture over the next 8 to 10 years. Despite this, for products such as wood-based panels (especially plywood), the post-Uruguay Round rates will remain high in some countries.
Tariff changes by developing countries will be more variable. In a number of cases they will be lowered; in many cases, they will be lowered substantially since they are currently very high. With limited exceptions, however, even after these changes, most rates will still be substantially higher than for developed countries. Some examples of the commitments from the pre-Uruguay Round level in the Asia-Pacific region are:
· Thailand will reduce wood-based panel tariffs by 20 to 50 percent and furniture rates by 60 percent;· The People's Republic of China will make 30 percent reductions for furniture and 10 percent for particleboard and builders' joinery;
· the Republic of Korea will reduce tariffs on paper products by 9 percent and on furniture items by 7 to 9 percent;
· India will reduce sawnwood tariffs by 27.5 percent; and
· Malaysia has agreed to reduce rates on most solidwood products by 5 percent, on logs and furniture by 10 percent, and on coated paper by 7.5 percent.
In most major markets, developing country exporters benefit from preference schemes that reduce tariff rates and sometimes provide preferential access to markets. Probably the best-known of these is the UNCTAD Generalised System of Preferences (GSP). Under this system, developed importing countries offer low (often zero) tariffs to selected developing countries without requiring any reciprocal benefits. However, with the general reduction in tariffs that has occurred in recent years, the benefits of schemes such as the GSP have declined.
In addition to the influence of the GATT/WTO negotiations, there are bilateral and regional negotiations that also have an important influence in the Asia-Pacific region. Of note are the efforts of the Association of South East Asian Nations (ASEAN),54 the Asia Pacific Economic Co-operation (APEC),55 and the Australia and New Zealand Closer Economic Relations Trade Agreement (ANZCERTA). This latter agreement has resulted in a phasing-out of tariffs between Australia and New Zealand and the progressive elimination of import licensing and trade quotas. APEC has yet to have a significant effect on trade liberalisation in the region, but may do so in the future. It is seeking to liberalise regional trade, and has set a target of free trade by about 2010 for the developed nations, 2015 for the newly industrialised countries, and 2020 for the developing countries. ASEAN has reduced rates among its members and reached agreement to establish an ASEAN Free-Trade Area (AFTA) in 2000, with programmed tariff cuts starting from that date.
54 ASEAN includes Indonesia, Malaysia, Myanmar, Laos, the Philippines, Singapore, Thailand, Brunei and Viet Nam.55 APEC includes Malaysia, Singapore, Thailand, Indonesia, Brunei, the Philippines, Australia, Canada, the Republic of Korea, Japan, New Zealand, the United States, the People's Republic of China and its territories, Papua New Guinea, Mexico and Chile.
In addition to tariffs, a wide range of non-tariff barriers exists. These include a host of different rules and procedures, ranging from health and technical standards to measures influencing prices. They are much more complex and difficult to recognise and therefore assess than tariffs, especially in quantitative terms, and may also have widely differing effects on different trading partners. Even where they are not formal barriers they make exporting more difficult, especially for smaller and less experienced developing country exporters.
Continuing efforts are being made to reduce NTBs, or at least limit them. At present, most restrictions do not appear to be of major significance. Of special note for forest products, however, are health and technical regulations, and standards for product and processing methods. They include restrictions related to protection of animal and plant life from pests and diseases, human health and safety, and maintenance of air, water and land quality. Some that are having considerable effects on trade include growing restrictions on trade in wood panels that use formaldehyde glues, bans or controls on some timber-preservation processes and materials, and controls on processing methods (e.g. chlorine bleaching of pulp).
Some lessening of these restrictions could follow from two of the agreements that were negotiated in the Uruguay Round: the Agreement on the Application of Sanitary and Phytosanitary Measures (SPS Agreement), and the Agreement on Technical Barriers to Trade (TBT). The former could improve conditions surrounding inspection and quarantine, and the latter could limit the use of technical regulations for other than legitimate health, safety, product quality and environmental protection purposes.
Although import restrictions are the most obvious barriers in forest products trade, export restrictions also have a considerable effect. These latter are common in most Asia-Pacific developing countries and have had a major impact on world forest products trade patterns. Export restrictions include total bans, export quotas, or selective bans based on species; indirect quantitative restrictions due to controls on harvest levels; direct charges such as export taxes or export levies; indirect charges in the form of royalties and reforestation levies; and administrative controls such as permits and licences. For example, log export restrictions are in force in Indonesia; in India, tariffs for imports have been reduced but exports of timber are banned; there is also restriction on exports of many NWFPs to protect the interests of tribals dependent on them. Export restrictions seem likely to continue, as developing countries find them the most direct way of controlling some of the undesirable practices that exist in their forestry sectors, and most notably to encourage domestic processing.
It is important to recognise, however, that export restrictions create, as well as solve, a number of forest products problems. The elimination of the potential for legal trading opens the door for illegal trade. More importantly, the elimination of international competition for a product, usually logs, allows the domestic price (and hence value) of the product to fall. A log ban consequently lessens pressure to utilise resources efficiently, and also lessens the incentives for reafforestation and good forest management.
The trade restrictions discussed above are institutional measures which restrict trade - either overtly or in many cases covertly. There are, however, other restrictions that are less clearly identifiable as trade barriers but still have significant impacts on trade. These restrictions are either legal under GATT/WTO rules, or outside the WTO's sphere of control. Although not strictly trade barriers, their impact or potential impact is very similar to more formal measures - and in many cases their intent is the same.
Many of these unofficial barriers can, deliberately or by default, result in increasing trade difficulties. The actions currently taking place around environmental issues such as certification, eco-labelling, processing methods, and the Convention on International Trade in Endangered Species of Wild Fauna and Flora (CITES) are examples. Also falling in this arena are sub-national and private market actions taken under the guise of concern for the environmental (real or imagined) and certain requirements for post-consumption disposal of products.56 Many of these have had relatively limited effects to date but seem likely to have a greater impact in the future. In the case of CITES, this has recently surfaced as a very controversial issue for forestry due to attempts by developed countries, strongly supported by conservation groups, to have a number of commercially important species found in tropical developing countries placed in CITES appendices. Concern has been expressed by forestry and trade interests that CITES is being used to stop or limit trade, and that the mere fact of having a species listed - even in Appendix III - will have a negative impact on trade in that species. The newest environmental measures are those aimed at limiting trade to products that come from a sustainably managed forest resource.
56 Bourke, I.J.(1995): "International Trade in Forest Products and the Environment". in FAO, Unasylva, Vol. 46, No. 183, p. 11. October.
Environment-related issues are likely to have significant impacts on forestry in the Asia-Pacific region. To date their effects have been less significant in this region than in regions such as Europe and North America. It seems likely however that their impact will increasingly be felt, as countries see benefits in adopting the measures, or as the moves in other regions become more widely adopted. In particular the legislation in markets outside the region could have important consequences for Asia-Pacific exporters, since they may be disadvantaged by having to meet a variety of different requirements in different markets, or simply through the difficulties of keeping informed of new regulations and requirements.
Other actions which will have an increasing impact on many Asia-Pacific exporters are (so called) voluntary measures such as product boycotts being introduced in Europe and North America. Although these usually have no direct links to official government policy (but may be unofficially encouraged by governments), their goal is the same - to limit imports to selected products that are sourced from sustainably managed forests. The main measures used to date have been bans on the use of tropical timber by regional and local councils; decisions to cease handling products by some retailers and a few timber traders; and some unknown level of consumer resistance to buying wood products.
Most of these measures are being associated with forest products certification. Although certification is still in its infancy, and its effect on trade is limited and primarily focused on Europe, a considerable degree of market uncertainty is being generated in many markets. Even though most certification schemes purport to be voluntary, they may in effect become compulsory since important retailers may be unwilling to carry uncertified products (as is presently occurring in the United Kingdom). Consumers may even switch to substitute products made from material other than wood (as is already occurring to a degree in some European countries).
To date, major Asia-Pacific import markets such as Japan, the Republic of Korea and the People's Republic of China, are showing little or no interest in this type of action. Despite this, Asia-Pacific exporters such as Malaysia and Indonesia are actively developing their own certification schemes, both as a defensive market strategy and a means of improving their forest management practices. The moves by these major forestry countries may encourage or force others in the region to follow suit. The procedures and actions being taken in other regions may extend to Asia-Pacific markets over a period of time and have an impact on them.
Perhaps the main effects of environmental measures on trade have been, and will continue to be, the impacts on supply arising from forest management actions. Moves toward sustainable supplies will reduce the volumes that are harvested, and may also influence processed production. Pressures in these areas have encouraged International Tropical Timber Organisation (ITTO) member countries57 in the region to commit to the ITTO Year 2000 Objective, which specifies that all internationally traded timber from ITTO members should come from sustainably managed forests by the year 2000.
57 ITTO members from the Asia-Pacific region as at November 1997 were Australia, Cambodia, the People's Republic of China, Fiji, India, Indonesia, Japan, the Republic of Korea, Malaysia, Myanmar, Nepal, New Zealand, Papua New Guinea, the Philippines and Thailand.
NWFPs are receiving increasing attention in trade. While a vast range of NWFP variants are produced and traded, those that have potential to be of significance in global trade are very limited. The present export values in all the but the very largest non-wood forest products are relatively small (Table 5.7). By far the most important NWFP export is natural rubber, which provides one of the few examples of a successfully domesticated NWFP.
Excluding natural rubber, the total value of NWFP exports from Asia-Pacific forests is slightly under US$1.5 billion. The most important exports are mushrooms, nuts and plaiting materials. The People's Republic of China is the largest NWFP exporter (excluding rubber), having exported US$900 million worth of NWFPs in 1996. In addition to the well-known NWFP exports, China ships commercial volumes of Chinese dates, gingko, tea oil, Chinese tallow, and tung oil. China's forest chemicals industry has also progressed significantly in recent years, earning US$180 million in foreign exchange in 1992.
NWFPs generally face low barriers because their trade is limited and they receive limited attention. They seem most likely to be affected by measures such as health standards and phytosanitary rules since many enter food industries.
Table 5.7: Value of exports for the major Asia-Pacific non-wood forest products, 1996
|
Non-wood forest product |
1996 Value of exports US$1,000) |
Major exporters (US$1,000) | |
|
Lac, natural gums, resins |
46,428 |
Indonesia |
23,272 |
|
Essential oils |
164,506 |
China |
88,687 |
|
Natural rubber, balata, gutta-percha, guayule, |
3,927,053 |
Indonesia |
1,920,055 |
|
chicle and similar natural gums |
|
Malaysia |
1,395,147 |
|
Plaits and similar products of plaiting materials |
265,476 |
China |
224,132 |
|
Honey |
143,667 |
China |
110,665 |
|
Edible products of animal origin |
66,613 |
Singapore |
28,458 |
|
Ambergis, castoreum, civet and musk, etc. |
8,086 |
China |
4,172 |
|
Mushrooms (fresh or chilled) |
151,860 |
China |
118,276 |
|
Mushrooms and truffles (dried) |
181,514 |
China |
147,827 |
|
Walnuts |
40,876 |
China |
40,297 |
|
Chestnuts |
178,741 |
Rep. Korea |
109,022 |
|
Ginseng roots |
125,183 |
Rep. Korea |
69,576 |
|
Bamboos |
30,719 |
China |
26,414 |
|
Rattans |
57,552 |
Singapore |
35,388 |
|
TOTAL |
5,388,274 |
|
|
Source: FAO - extracted from UN COMTRADE Database.
![]()
![]()
![]()