![]()
![]()
![]()
Introduction
Outlook for the demands placed on forests
Outlook for forest resources and land use
The setting for policy choices
This chapter provides an outlook for forest resources in Asia and the Pacific, and for their production potential through the year 2010. It also projects the likely demands that will be placed on forests in the region. Finally, it attempts to provide a foundation for subsequent analysis related to future policy choices that could be made to ensure better forestry contributions to economic, environmental and social objectives.
Outlook information and projections are essential for developing sound forest policies. Among the critical elements of effective, long-term planning is information on prospective levels of demand and sources of supply. There is always some uncertainty associated with key factors that will affect demand and supply of forest products (such as rates of population growth, economic growth and technological developments). It is, however, possible to prepare an outlook for the forest sector in which scenarios are used to organise and display possible future developments and the magnitude of uncertainty surrounding these projections.
The policies and choices made by decision-makers and individuals both within and external to the forest sector can lead to many different outcomes. The outlook presented here is, therefore, useful primarily as an indicator of future trends. It is intended to serve as a starting point for discussions of alternative futures that can be shaped by policy decisions made now or in the near future.
Outlook for services of forests and for non-wood forest products
Outlook for consumption, production and trade for wood-based forest products
The impacts of the current economic downturn
It is not possible at present to develop a quantitative outlook for services of forests and for most non-wood forest products. Data is too scarce to enable formal modelling. The future qualitative changes to be expected were largely described in analysing status and trends (Chapter 3) and are summarised below.
Outlook for services of the forest
The outlook for forest-provided services will range between two extremes. One scenario would result if deforestation and forest degradation continue without commensurate corrective efforts. The result would be increasing social costs due to falling agricultural productivity, environmental hazards, erosion of biological diversity, deterioration of wildlife habitat, and impairment of water quality and streamflow regimes.
A more positive scenario of the future would be marked by intensive efforts to control deforestation and forest degradation, and to expand and enhance the area under forest cover. Regional and inter-regional collaboration and co-operation would promote sharing of responsibility for international rivers and their watersheds and for managing forests for global benefits related to biological diversity and mitigation of climate change. For either scenario, the key future challenges specific to forest-based services, will include the following:
· altering perceptions that: (a) forest values, other than those solely related to timber benefits, can be financially realised and are important; and (b) ignoring values of ecological services of forests will cause downstream costs. Dominant values of forests have come to be equated with commercial resources based on extractive industries. The social, cultural and ecological services of forests have been largely ignored. This can be overcome by establishing belief and interest in the crucial importance of forest-provided services. The creation of both public and political awareness of these services will help to ensure forests are ascribed their true value in decision-making;· developing more effective valuation methods for pricing externalities and for identifying beneficiaries: this will include designing innovative approaches for measuring externalities and incorporating benefits and costs of forest-provided services in both policy decisions and investment analyses.83 Capturing the value of services to demonstrate their usefulness is a key challenge;
83 A recent attempt to value the ecosystem services supplied by wildlands suggested an average annual value of US$33 trillion, a sum that is double the annual Gross Global Product. Even if this estimate is substantially wide of the mark, it nonetheless indicates a huge equivalent monetary value for these difficult-to-value services. (Costanza, R. et al. The value of the world's ecosystem services and natural capital. In Nature, 387:253, 15 May 1997.)· developing mechanisms to maintain the diversity of services of forests while forests continue to provide economic benefit: such an approach will need to recognise the socio-cultural basis for these services, including as they relate to indigenous and local people's rights;
· mobilising investment for developing forest-provided services: the challenge is to create a self-sustaining "market" for services or to develop methods whereby beneficiaries share the costs of sustaining service functions through taxes, charges, or voluntary contributions; and
· ensuring integrated and sustainable management of forest-provided services:: that is, ensuring that continued provision of forest services is an integral component of the objectives and actions of forest resource management.
Certain developments in services will have an international dimension. It is particularly urgent for countries to reach agreement with regard to:
· valuation of forests in upstream conservation for internationally-shared river systems where the benefits of efforts to conserve upper catchment forests largely accrue to other countries downstream;· the role of forests in protection against global warming by sequestering carbon (the potential for major investment flows based on "selling" the capacity to sequester carbon through fast-growing tree plantations should provide an impetus, particularly for the region's developing countries); and
· valuation and use of forest genetic resources, to ensure that global benefits are derived from genetic resources and that source countries are appropriately compensated for valuable natural endowments.
Non-wood forest products
Data for most non-wood forest products (NWFPs) are scarce and often inconsistent. They therefore form an unreliable basis for future projections. Nevertheless, there is considerable evidence that NWFPs are both socially and commercially important in most countries in the Asia-Pacific region, particularly for many indigenous and poor people living in or close to forests. At the same time, collection, processing and distribution of NWFPs in organised markets provides employment for large numbers of people. Estimates of employment associated with NWFPs range up to 100 million people in Asia and the Pacific.84 Exports of raw materials and products (such as furniture) manufactured from NWFPs contribute substantially to local, regional and national revenue. The value of trade in NWFPs has been estimated to be in the hundreds of millions of dollars.
84 Mittelman et al. (1997). Document APFSOS/WP/28.
A number of developments will have a significant effect on the outlook for NWFPs:
· increasing commercialisation of some NWFPs resulting from large-scale exploitation, and developing markets;· declining importance of subsistence use of some NWFPs in some areas as alternative products (for local consumption) and alternative sources of income emerge;
· disintegration of traditional systems of using and managing NWFPs, brought about in part by intrusion of commercial timber harvesting concessions and the granting of NWFP extractive permits to outside groups;
· the possible beneficial effects (for NWFPs) of interest in devolution of forest management to community-based institutions and authorities; and
· the possibility that emerging niche markets, and policy initiatives (such as efforts to promote equitable access to both resources and markets) may combine to enhance the contribution of NWFPs to social, economic, and environmental objectives.
A major factor to be considered is how growing prosperity may affect the numbers and habits of forest-dependent people. Although within the 2010 horizon of this outlook study the absolute numbers of forest-dependent people may not decline, their needs and demands could change significantly as alternative livelihood opportunities open up to them.
For this outlook study, the main projections of future demand and supply of wood products are based on an equilibrium econometric model that calculates quantities and prices at a national scale, based on explicit consideration of regional and global market conditions. The model is referred to as the "Asia-Pacific Forest Products Model (APFPM)" and is linked to other regions through a global model of which the APFPM is a sub-component.
Outlook for fuelwood
Fuelwood and charcoal have been dominant uses of wood in the developing countries of the Asia-Pacific region in the past and will continue to be well into the future. During the last three decades, consumption of fuelwood and charcoal has shown sustained increases, mainly as a consequence of population growth. The region's total production (which generally equals consumption, as there is little trade) increased from 679 million cubic metres in 1980 to 1023 million cubic metres in 1994 (Table 10.1). The latter is just over half of the world's consumption of fuelwood, and 2,8 times the region's use of industrial roundwood in 1994.
Table 10.1: Outlook for fuelwood85
85 Self-sufficiency for fuelwood is best assessed locally or, at most, nationally. By 2010, the percentage of consumption relative to sustainable production potential will be: 299 percent (Maldives), 247 percent (Pakistan), 178 percent (Nepal), 144 percent (Bangladesh), 92 percent (Viet Nam).
|
|
Production and Consumption86 ('000 cum) |
Net Change - Production and Consumption -1994-2010 |
|||
|
1980 |
1994 |
2010 |
Quantity |
% |
|
|
Advanced Industrialised Economies (AIE) |
9,600 |
12,800 |
16,400 |
3,600 |
28.1 |
|
Newly Industrialising Economies (NIE) |
6,490 |
6,389 |
4,900 |
-1,489 |
-23.3 |
|
North Asia (NA) |
159,714 |
340,252 |
347,300 |
7,048 |
2.1 |
|
Southeast Asia (SEA) |
214,637 |
293,079 |
424,900 |
131,821 |
45.0 |
|
South Asia (SA) |
283,305 |
364,519 |
495,300 |
130,781 |
35.9 |
|
Pacific Islands (PI) |
5,529 |
5,802 |
5,965 |
163 |
2.8 |
|
ASIA-PACIFIC |
679,275 |
1,022,841 |
1,294,765 |
271,924 |
26.6 |
|
World |
970,100 |
1,936,853 |
2,35,3907 |
417,054 |
21.5 |
|
Asia-Pacific Share (%) |
70.0 |
52.8 |
55.0 |
65.2 |
|
86 International trade in fuelwood is insignificant for virtually all countries. This analysis assumes zero trade for convenience and because gross fuelwood trade falls within the margin for error.Source: RWEDP
The total Asia-Pacific consumption and production of fuelwood and charcoal will reach about 1,295 million cubic metres by the year 2010,87 a 27 percent increase over the 1994 level, or an average annual increase of 1.5 percent per year. The top three consuming countries will continue to be India (362 million cubic metres), the People's Republic of China (342 million cubic metres) and Indonesia (104 million cubic metres), with Viet Nam and Thailand also being important.
87 Document APFSOS/WP/34, 1997.
In the AIEs (Japan, New Zealand and Australia), high incomes have led to relatively low demand for fuelwood and charcoal, as these countries have shifted their energy focus to fossil fuels and electricity. Analysis by the Regional Wood Energy Development Programme (RWEDP) indicates that historical baseline data of fuelwood use was underestimated. This has led to upward revision of the current estimated consumption for these countries relative to past estimates. Consumption of fuelwood and charcoal in these three countries will increase from 12.8 million cubic metres in 1994 to some 16.4 million cubic metres by the year 2010. Fuelwood consumption in all other sub-regions of the Asia-Pacific is expected to increase even more rapidly, with the vast bulk of the increase occurring in populous North and South Asia.
As in the past, most countries in the Asia-Pacific region will continue to "make do" with fuelwood and charcoal that is locally available, because transportation of these products is uneconomic. While estimates of woodfuel supply potential indicate that supply is greater than consumption at an aggregate level for the region, there will clearly continue to be woodfuel shortages in specific countries or locations within them. These local woodfuel shortages can best be addressed through an integrated approach to forestry, agriculture and energy policies, both for traditional use and more technologically advanced applications.
One aspect of energy development that has the potential to dramatically alter the future prospects for woodfuel use in the region is the growth in industrial energy generation using wood. In cold, well-forested countries, particularly in Scandinavia, wood (especially surplus wood-processing mill wastes) is a mainstream fuel for public heating and contributes also to power generation. In most of the Asia-Pacific region except the cold parts of Northeast Asia, the demand for space heating is limited. Industrial use of woodfuel may, therefore have more limited potential to be profitable in comparison with commercial fuels (Box 10.1).
|
Box 10.1: POTENTIAL FOR COMMERCIAL/INDUSTRIAL USE OF WOODFUELS Industrial use of biomass in the Asia-Pacific region is extensive, but generally on a small-scale and based on traditional technologies. More recently, in some countries of the region, modern bio-energy applications (mainly co-generation, whereby heat and power from industrial processes or residues are generated and captured) have been adopted by some forest industry companies. For example, two plywood companies in Sumatra Indonesia (PT Kurnia Musi Plywood Industries and PT Siak Raya Timber) have invested in waste-fired boiler systems. The latter company estimates its investment of US$5.6 million will result in fuel cost savings of US$1.7 million per annum. Examination of co-generation, and other electricity producing alternatives, offers potential to optimise utilisation of countries' wood residues and biomass resources. As in several industrialised countries, such as Finland (19 percent), Sweden (17 percent) and Australia (13 percent), other countries of the Asia-Pacific could obtain significant proportions of energy requirements from biomass resources. Certainly smaller scale electricity generation through co-generation is likely to be increasingly adopted by wood processors in the region, since this offers opportunities both to save on fuel and to dispose of residues. The key is acceptance of the systems' efficiency and environmentally benign attributes. Woodfuels could offer an alternative to power stations using fossil fuels in some areas. Advantages in terms of cost and environmental impacts certainly exist under some circumstances - especially where adequate and economic supplies of biomass are available. Within the region, the Philippines attempted a national-scale dendrothermal electricity programme in the 1980s. The programme was largely unsuccessful due to, among other things, to a lack of cost-effective wood supplies. Source: Adapted from Biomass energy in ASEAN member countries: RWEDP in association with EC-ASEAN COGEN and ASEAN-EC EMTRC. |
Outlook for industrial roundwood
The combined influences of a growing population, strong economic growth, and explicit policies of forest-based industrialisation in key countries have led to large increases in production and consumption of industrial roundwood in the Asia-Pacific over the past 15 years. Total consumption of industrial roundwood in 1994 was an estimated 318 million cubic metres, or 21 percent of the world's total (Table 10.2) compared to 276 million cubic metres in 1980 (20 percent of the world total). Although future economic growth in the region is expected to be slower (as compared to the rates recorded for 1980-1995), the APFPM forecasts industrial roundwood consumption will continue to increase to 466 million cubic metres by 2010. This is an average increase of 2.4 percent per year from 1994 to 2010, compared to 1.2 percent per year from 1980 to 1994.
Japan, the People's Republic of China, Malaysia, Indonesia and India are expected to remain as the region's five main consuming countries, collectively accounting for about 75 percent of consumption in 1994 and 81 percent in 2010. Consumption of industrial roundwood in China alone presently accounts for about 29 percent, and by 2010 would account for 33 percent of the region's industrial roundwood.
In 1994, the region's production of industrial roundwood was 284 million cubic metres; by 2010, this is expected to increase by 48 percent, to 420 million cubic metres. The regional share of world production is expected to increase from 19 percent to 22 percent. The projected annual growth rate for production is 2.5 percent for 1994-2010, compared to 1.2 percent per year in the period from 1980 to 1994. The region's largest producers will continue to be the People's Republic of China, Indonesia, Malaysia, India, Japan, Australia and New Zealand. These seven countries accounted for 91 percent of industrial roundwood production in the region in 1994, and are expected to account for an equivalent share in 2010.
The People's Republic of China is the largest producer of industrial roundwood in the region, and is expected to remain so with production increasing from 99 million cubic metres in 1994 to 152 million cubic metres in 2010. Over the same period, Indonesia is projected to increase production by 50 percent (much of the increase coming from pulpwood as supplies of large logs are already tight), while Malaysia's output remains largely static. Australia and New Zealand are also forecast to substantially increase production (notably from plantation forests). Although India and the People's Republic of China have declared restrictions on timber harvests in natural forests, the APFPM predicts significant output increases for these countries. The increases, if they are achieved, will likely come from earlier tree planting programmes that are reaching maturity and, in the case of China, the very large stocks of agricultural tree crops, such as fruit trees, shelterbelts and farm trees.
The Asia Pacific region consumes only around 22 percent of the world's industrial roundwood but accounts for over half the imports. This underscores the region's very high dependency on imports to meet its needs. Imports of roundwood expanded very quickly from the mid-1960s until the late 1970s, peaking at 80 million cubic metres in 1979. Subsequent declines in log imports were partly a consequence of log export bans by Indonesia and Malaysia; these countries no longer made large volumes of unprocessed logs available to importing countries.
In 1994, Japan's imports were more than 70 percent of the region's total and nearly 40 percent of world imports. Japan's role as the leading log importing country is expected to continue, although the Republic of Korea may increase imports significantly in the coming decade.
The gross changes in the volume of industrial roundwood consumption mask some important structural changes in the types of roundwood being utilised. In many cases there has been a major shift away from tropical logs in favour of temperate softwoods. This trend is likely to continue. The Republic of Korea, for example, has closed down or converted much industrial capacity that manufactured sawnwood, veneer and plywood from large tropical logs because these are no longer readily available in adequate volumes.88 Another example of structural changes in consumption is the shift in Japan's imports toward woodchips (which accounted for 55 percent of Japan's 48.5 million cubic metres of roundwood imports in 1995) as a result of several key supplier countries restricting or banning log exports.
88 Byoung Il Yoo (1997). In-depth Country Study - the Republic of Korea. Document APFSOSAVP/06. FAO, Rome.
The APFPM model projects that imports of industrial roundwood by countries in the Asia-Pacific are expected to increase to 80 million cubic metres in 2010 from 64 million cubic metres in 1994. Combined imports by the Republic of Korea and Japan are expected to increase from 56 million cubic metres in 1994 to 69.5 million cubic metres.
Table 10.2: Outlook for industrial roundwood
|
|
Production |
Production |
Exports |
||||||
|
1980 |
1994 |
2010 |
1980 |
1994 |
2010 |
1980 |
1994 |
2010 |
|
|
AIEs |
59,647 |
61,141 |
80,822 |
53,916 |
45,600 |
57,595 |
8,068 |
12,860 |
9,743 |
|
NIEs |
2,196 |
1,994 |
3,637 |
7,847 |
11,290 |
12,017 |
117 |
160 |
12 |
|
North Asia |
80,842 |
100,147 |
152,544 |
7,941 |
4,636 |
3,368 |
60 |
2,577 |
191 |
|
Southeast Asia |
81,627 |
89,030 |
123,508 |
197 |
2,258 |
35 |
33,419 |
10,880 |
15,146 |
|
South Asia |
22,704 |
28,816 |
49,869 |
67 |
418 |
7,027 |
163 |
17 |
2 |
|
Pacific Islands |
2,334 |
3,345 |
6,511 |
3 |
2 |
0 |
1,054 |
4,019 |
5,509 |
|
TOTAL |
249,350 |
284,473 |
416,892 |
69,971 |
64,204 |
80,042 |
42,881 |
30,513 |
30,603 |
|
World |
1,385,322 |
1,467,050 |
1,871,574 |
111,782 |
122,582 |
120,944 |
106,674 |
113,412 |
111,781 |
|
Asia-Pacific Share % |
18.0 |
19.4 |
22.3 |
62.6 |
52.4 |
66.2 |
40.2 |
26.9 |
27.4 |
|
|
Consumption |
Change 1995-2010 |
|||||
|
Production |
Consumption |
||||||
|
1980 |
1994 |
2010 |
Quantity |
% |
Quantity |
% |
|
|
AIEs |
105,495 |
93,881 |
128,675 |
19,681 |
32.2 |
34,794 |
37.1 |
|
NIEs |
9,926 |
13,124 |
15,642 |
1,643 |
82.4 |
2,518 |
19.2 |
|
North Asia |
88,723 |
102,206 |
155,721 |
52,397 |
52.3 |
53,515 |
52.4 |
|
Southeast Asia |
48,405 |
80,408 |
108,397 |
34,478 |
38.7 |
27,989 |
34.8 |
|
South Asia |
22,608 |
29,217 |
56,894 |
21,053 |
73.1 |
27,677 |
94.7 |
|
Pacific Islands |
1,283 |
-672 |
1,003 |
3,166 |
94.7 |
1,675 |
-249.2 |
|
TOTAL |
276,440 |
318,164 |
466,331 |
132,419 |
46.5 |
148,167 |
46.6 |
|
World |
1,390,430 |
1,476,220 |
1,880,738 |
404,524 |
27.6 |
404,518 |
27.4 |
|
Asia-Pacific Share % |
19.9 |
21.6 |
24.8 |
32.7 |
36.6 |
|
|
Although log export restrictions have been imposed by a number of countries in the region, industrial roundwood exports from Asia-Pacific countries were still 30 million cubic metres in 1994, about 27 percent' of the world's total. Exports of industrial roundwood are projected to remain steady at about 34 million cubic metres through 2010. Decreases in exports from Malaysia and Indonesia have been partially offset by a 5 million cubic metres increase in industrial roundwood exports from New Zealand and Australia (dominated by woodchip exports). New Zealand is expected to continue to increase exports of industrial roundwood. The region's share of world industrial roundwood exports is expected to fall from its current 27 percent to 25.6 percent in 2010.
More than half of Asia-Pacific imports of industrial roundwood comes from outside the region. In contrast, exports from countries in the region tend to go mainly to countries within the region, primarily Japan. Exports to countries outside the region account for less than 1 percent of total roundwood exports. The top three importers in 1995 were Japan with 45 million cubic metres, the Republic of Korea with 9 million cubic metres and the People's Republic of China with 7 million cubic metres. Major external suppliers of industrial roundwood to the Asia-Pacific region are the United States (accounting for more than half), Russia, Chile and Canada. Combined roundwood imports from these countries represented more than 90 percent of imports from all sources outside the Asia-Pacific region.
There are several key unknowns in the supply equation for the region. The first is the extent to which the Russian Far East will be able to access its forest resources, in particular to meet demand from North Asia. A second large uncertainty is the extent to which the demand for forest products in the People's Republic of China will increase, and the country's capacity to meet demand from its own resources given recently expressed intentions to restrict natural forest harvest (Box 10.2). China's own forecasts to 2010 suggest that a doubling in consumption of forest products is not unlikely. In this event, not only will China's forest resource be placed under considerable pressure, but so too will the ability of key suppliers to match this demand. Only a major shift to sources outside forests and newly maturing plantations can offer supplies on a significant scale. A third uncertainty originates from environmentally oriented policy directions that may be taken in North America. In 1995, North America's coniferous log exports to Pacific Rim countries had fallen to only half their 1990 level of 21 million cubic metres.89 Many analysts expect this downward trend to continue.
89 Original sources cited in: Chipeta, M.E. (1997): The FAO 1996 provisional outlook for global forest products and its implications for policy. In FAO provisional outlook for global forest products consumption, production and trade to 2010. FAO, Rome.
|
Box 10.2: INDUSTRIAL ROUNDWOOD PRODUCTION: THE IMPACTS OF ASSUMPTIONS IN MODELLING The modelling of industrial roundwood production for countries in the Asia-Pacific region results in a number of predictions at variance with expectations provided in outlook study country reports. For example, Table 10.3 compares the unmodified estimates of industrial roundwood production for key countries, produced by the APFPM, with the estimates provided by the same countries in their country reports. Disparities exist between the estimates for all countries, but the most proportionately significant are those for Malaysia, Indonesia and Japan where different assumptions on the extent of harvestable resources and, particularly, harvest regulatory measures have caused significant deviation. Further investigation to clearly explain and reconcile these differences is warranted. For Japan, a significant degree of deviation between the estimates is likely explained by noting that the country estimates are derived from pure woodflow models while the APFPM estimates are derived in a market clearing model. Notably, the Japanese Government's "Long Range Demand and Supply Projection on Important Forest Products" notes that, depending on economic conditions Japan's harvest could be as much as 17 million cubic metres less than the 40.3 million cubic metres quoted below. |
Assessing consumption, production and trade of industrial roundwood, the following features stand out:
· while the AIEs accounted for 29.5 percent of consumption in 1994, their share will decline to 27.6 percent in 2010;· North Asia (excluding Japan and the Republic of Korea) will increase its share of consumption from 31 percent to 33 percent and South Asia's share will increase from 9 percent to 12 percent, while the share of Southeast Asia will decline from 25 percent to 23 percent;
· the main forces for trade will remain with Japan (predicted net supply shortfall of 57.5 million cubic metres) and the NIEs with a shortfall of 12 million cubic metres; and
· North Asia will be a major consumer of industrial roundwood, but is not expected to be a major influence on roundwood trade because China's own capacity to supply from plantations and non-forest areas is expected to increase significantly. China will, however, likely become important in the trade in processed products.
The regional level of supply shortfall (the difference between consumption and production) is predicted to be nearly 40 million cubic metres in 2010 and is clearly unevenly distributed across the region. Japan alone is predicted to exceed the regional shortfall (implying the rest of the region as a whole will generate a roundwood surplus). Nonetheless, Table 10.3 suggests significant variation in production from those modelled are not only possible, but likely (variation among the major producers forecasts in Table 10.3 is 48 million cubic metres). The potential supply shortfall highlights the question of where additional wood might be obtained.
Table 10.3: Comparative estimates of industrial roundwood production for selected countries in 2010
|
Country |
Unmodified estimate produced by Asia-Pacific Forest Products Model (million m3) |
Estimate provided in Country Report or in-depth review source to APFSOS study (million m3) |
Difference(%) |
|
China |
151.6 |
134.9 |
15 |
|
Indonesia |
57.2 |
45.590 |
26 |
|
Malaysia |
37.9 |
21.0 |
80 |
|
India |
43.9 |
40.091 |
10 |
|
Japan |
33.0 |
40.3 |
22 |
90 Source: Blanchez (1997). Document APFSOS/WP/17.91 Source: Blanchez op cit.
In 1995, world exports of roundwood totalled 122 million cubic metres of which Asia imported 70 million (57 percent). Within the region, there are few obvious opportunities to expand production. New Zealand may offer an additional 15 million cubic metres and both Australia and Papua New Guinea also have scope to increase. Other countries are holding production steady, diverting an increasing proportion of harvested timber for national needs (e.g. in Southeast Asia), or are restricting harvests for environmental reasons. Most plantations in the region are young and will not yield large volumes of timber in the next decade. North America has for some time been reducing its roundwood exports due to environmental pressures; the Russian Far East has infrastructure bottlenecks; and Japan faces high costs.
Information to resolve the above questions requires time to accumulate. The main lines of exploration could focus on the following:
· the degree to which technology can reduce the need for raw material, in particular with regard to:- greater use of residues currently left in the forest and at mills;- earlier and enhanced contribution of forest plantations (current data are too weak to predict output potential with confidence);
- reliable, predictable level of supplies from trees outside forests, especially in key countries such as the People's Republic of China and in the whole South Asia sub-region;
· policy and political developments that could unblock timber supplies currently accessible only with difficulty, especially:
- incentives to make commercially attractive the currently costly and unprofitable harvesting of Japan's fragmented forests;- the prospects for Japanese investment to improve infrastructure in the Russian Far East to permit larger-scale harvesting (given recent Japan/Russia progress in addressing the political issue of the Kuril Islands); and
- possible resolution of policy and institutional problems to allow profitable harvesting and transport of logs from Siberia.
Outlook for sawnwood
Over the past 25 years, the rate of growth in sawnwood consumption has been low relative to other wood products. Sawnwood use has expanded moderately in developing countries, but has remained flat in most developed countries. This is due, in part, to increasing scarcity in supplies of large-dimension logs suitable for sawing. It is also because of the rapid substitution by other wood products, particularly reconstituted panels and plywood, and by non-wood materials. The lower prices of wood-based panels relative to sawnwood, and the relative ease with which panels can be installed, have prompted this substitution. Despite these trends, sawnwood remains the most important and widely used primary processed solid wood product. In 1994, for example, sawnwood consumption (112 million cubic metres) was 3.3 times that of panel products.
Sawnwood consumption in the Asia-Pacific region increased from 96 million cubic metres to 112 million cubic metres between 1980 and 1994, an average annual growth rate of 1.1 percent. At the same time, the region's share of world consumption increased from 23 percent to 27 percent (Table 10.4). The region's largest consumers are Japan (accounting for one-third of the regional total), the People's Republic of China and India. Indonesia, Malaysia and the Republic of Korea are also significant consumers. Together, these six countries accounted for nearly 90 percent of the region's total consumption in 1994, and are expected to remain the main consumers of sawnwood to the year 2010. Although continuing economic growth is expected in the region, total sawnwood consumption is not projected to increase significantly in the next decade and a half; projected growth is only 1.4 percent per year, leading to a level of 142 million cubic metres by 2010. This suggests a slight acceleration in growth in spite of the continued trend of substituting panel products for sawnwood. The largest increases in consumption will be in Japan, the People's Republic of China, India, Indonesia and Malaysia.
Table 10.4: Sawnwood
|
|
Production |
Imports |
Exports |
||||||
|
1980 |
1994 |
2010 |
1980 |
1994 |
2010 |
1980 |
1994 |
2010 |
|
|
AIEs |
42,406 |
32,091 |
41,453 |
6,591 |
11,833 |
12,590 |
761 |
1,119 |
4,407 |
|
NIEs |
3,614 |
3,665 |
4,279 |
1306 |
2,216 |
3,113 |
1,593 |
474 |
31 |
|
North Asia |
21,760 |
25,599 |
30,417 |
139 |
2,403 |
7,336 |
45 |
800 |
136 |
|
Southeast Asia |
15,578 |
19,632 |
21,835 |
586 |
2,894 |
2,851 |
5,452 |
5,864 |
1,848 |
|
South Asia |
11,458 |
19,306 |
24,525 |
115 |
43 |
30 |
9 |
9 |
2 |
|
Pacific Islands |
350 |
276 |
318 |
57 |
71 |
29 |
68 |
45 |
2 |
|
TOTAL |
95,166 |
100,569 |
122,827 |
8,794 |
19,460 |
25,949 |
7,928 |
8,311 |
6,426 |
|
World |
429,097 |
413,259 |
501,254 |
70,495 |
104,597 |
106,223 |
76,557 |
107,536 |
109,164 |
|
Asia-Pacific share (%) |
22.2 |
24.3 |
24.5 |
12.5 |
18.6 |
24.4 |
10.4 |
7.7 |
5.9 |
|
|
Consumption |
Change 1994-2010 |
|||||
|
Production |
Consumption |
||||||
|
1980 |
1994 |
2010 |
Quantity |
% |
Quantity |
% |
|
|
AIEs |
48,236 |
42,805 |
49,636 |
9,362 |
29.2 |
6,831 |
16.0 |
|
NIEs |
3,327 |
5,407 |
7,361 |
614 |
16.7 |
1,954 |
36.1 |
|
North Asia |
21,854 |
27,202 |
37,617 |
4,818 |
18.8 |
10,415 |
38.3 |
|
Southeast Asia |
10,712 |
16,662 |
22,838 |
2,203 |
11.2 |
6,176 |
37.1 |
|
South Asia |
11,564 |
19,340 |
24,553 |
5,219 |
27.0 |
5,213 |
27.0 |
|
Pacific Islands |
339 |
302 |
345 |
42 |
15.3 |
43 |
14.3 |
|
TOTAL |
96,032 |
111,718 |
142,350 |
22,258 |
22.1 |
30,632 |
27.4 |
|
World |
423,035 |
410,318 |
498,313 |
87,995 |
21.3 |
87,995 |
21.4 |
|
Asia-Pacific share (%) |
22.7 |
27.2 |
28.6 |
25.3 |
|
34.8 |
|
The region produced 101 million cubic metres of sawnwood in 1994, only 7 percent more than in 1980 but nearly double what was produced in 1962. Nonetheless, the Asia-Pacific region's share of world production increased from 22 percent in 1980 to 24 percent in 1994. The region's largest producers are Japan, the People's Republic of China, India, Malaysia, Indonesia and the Republic of Korea, together accounting for nearly 90 percent of production. Japan, alone, accounts for more than 25 percent of regional production, although this percentage is down significantly from its 39 percent share of production in 1980.
Sawnwood production in the Asia-Pacific region is expected to grow slowly, in line with consumption, during the period leading up to 2010. The region's share of world production is projected to remain constant at 24 percent. Of particular concern is the predicted overall 8 million cubic metre shortfall in the region's production relative to expected consumption. Japan and the People's Republic of China will be the most significant contributors to the shortfall. The supply deficit in these two countries will total 20 million cubic metres.
Asia-Pacific countries exported about 8.3 million cubic metres of sawnwood in 1994, a minor increase from exports in 1980 (7.9 million cubic metres). The region's share of world exports declined from 10.4 percent to 7.7 percent over this period. Most Asia-Pacific sawnwood exports are of non-coniferous wood (6 million cubic metres in 1995). New Zealand is the only significant exporter of coniferous sawnwood (more than 1 million cubic metres in 1995). Prior to 1989, Malaysia and Indonesia were the two main exporters of the region, but in 1989 the Indonesian Government introduced heavy export taxes, which reduced exports. Since 1989, Malaysia has continued to dominate the trade in non-coniferous sawnwood, with 4.1 million cubic metres exported in 1995, 69 percent of total Asia-Pacific exports.
Exports of sawnwood by Asia-Pacific countries are projected to decrease from 7.6 million cubic metres in 1995 to 7.0 million cubic metres in the year 2010, and the region's share of world exports is expected to decrease slightly from 7.7 percent to 5.9 percent. Given anticipated harvest cutbacks in Malaysia, that country will likely no longer figure among the largest exporters in the region by 2010, as annual exports may decline to under 1 million cubic metres within the decade.
Total imports of sawnwood in the Asia-Pacific region increased sharply from 8.8 million cubic metres in 1980 to 19.5 million cubic metres in 1994. The region's share of the world total also increased substantially, from 12.5 percent in 1980 to 18.6 percent in 1994. More than half of the region's sawnwood imports is coniferous wood. Within the region, the largest importers in 1994 were Japan, (10.7 million cubic metres), the People's Republic of China (2.4 million cubic metres) and Thailand (2.4 million cubic metres).
Asia-Pacific sawnwood imports are expected to increase by 33 percent between 1994 and 2010, from 19 million cubic metres to 26 million cubic metres. The region's share of the world's total is projected to increase from 19 percent to 24.5 percent. Japan is expected to remain the largest importer through 2010, with 12.5 million cubic metres imported per year. Other countries that are expected to import more than 1 million cubic metres in 2010 are the People's Republic of China (with Hong Kong SAR, China) (8.1 million cubic metres), Thailand (2.3 million cubic metres) and the Republic of Korea (2 million cubic metres).
|
Box 10.3: INTERNATIONAL TROPICAL TIMBER ORGANIZATION (ITTO) ANALYSIS OF FUTURE WOOD PRODUCTS SCENARIOS Since 1993, ITTO has used a trade model to study structure, changes and prospects for supply and demand of forest products in the region, with focus on its member countries. The results of its three-phase study have been issued in stages under the general title Analysis of macroeconomic trends in the supply and demand of sustainably produced tropical timber from the Asia-Pacific region. ITTO has also contributed a thematic study to the APFSOS based on the trade model results. The major conclusions of this study are: Logs and the log trade Natural forest log scarcity will be offset: sufficient incremental log supply will become available to avoid scarcity through improved utilisation of current log sources, low-impact harvesting of sensitive sites, and the importing of conifer logs. Hardwood log trade will decline: hardwood log trade will decline across the region, and several more ITTO producer countries will become net importers by 2010. Some expected national developments are: · Malaysia becomes an importer of logs: Malaysia, principally Peninsular Malaysia, is already an importer of hardwood logs; this trade will grow. The volume of trade in hardwood logs will decline as Sarawak and Sabah progressively curtail log exports. · Indonesia becomes a net log importer: Indonesia discourages log exports92 and is considering importing logs from Viet Nam, Myanmar, and the Solomon Islands to offset declining log supplies. Log imports are likely to increase during the study period. 92 Though under recent agreements reached with the IMP for structural reform, it is intended to liberalise the log trade. · Papua New Guinea will probably continue to export logs: Papua New Guinea's current policy is to reduce log exports by 10 percent each year for the period 1995-2000, and ban log exports thereafter. The PNG domestic processing industry may be unable, however, to absorb a significant increase in log supply. Log exports are consequently likely to persist well past 2000 and may even expand. · Myanmar and Viet Nam have an export opportunity: These countries have an opportunity to expand log exports in the short term as the major exporters curtail their trade. Coniferous log imports will expand: The region will import substantial volumes of coniferous logs to substitute for tropical logs in the manufacturing of sawnwood, plywood, and reconstituted boards and panels. Manufacturing Manufacturing will relocate to producer countries: The trend of relocating manufacturing capacity to producer countries will continue as the producer countries become more competitive and their manufacturing capacity becomes more efficient. Policy incentives for relocation are expected to accelerate the process. Sawnwood manufacturing will increase: Sawnwood manufacturing will increase in the producer countries, largely in response to growth in domestic demand and the development of secondary manufacturing for export. If sawnwood manufacturing is to increase in consumer countries, it will be based on imported conifer logs. Plywood manufacturing will decline: Plywood manufacture will decline across the region as the supply of peeler-quality logs declines and consumers adopt reconstituted panels. Manufacture of substitute products will expand: While substitute products will be imported from outside the region, new capacity will also develop within the region to manufacture substitutes, especially reconstituted boards and panels based on the increasing supply of coniferous logs and small logs. Trade in manufactured products Sawnwood and plywood trade decline: Although processing capacity will shift to the producer countries, the overall trade in sawnwood and plywood will decline. Substitute products trade increases: With new manufacturing capacity for substitute products being established in the producer countries, the trade in substitute products will expand in the region. Prices Prices will remain stable: Although demand will continue to be strong in the region, product and technological substitution could cause real prices to remain stable, or even decline. This result is sensitive to the rate at which consumers can accept product substitution and the rate of growth in demand for tropical timber solid-wood products. Source: Abbreviated from Document APFSOS/WP/20: Forest industry structure and the evolution of trade flows in the Asia-Pacific region - scenarios to 2010. ITTO. Yokohama. |
Outlook for wood-based panels
The status, trends and outlook for wood-based panels are summarised in Table 10.5. A full review of the dynamics of the panels' sub-sector in the region is given in a working paper by Michael Lyons93 and for China by Lu Wenming.94
93 Lyons, M.J (1997): FAO Outlook study on wood-based panels production, consumption and trade in the Asia-Pacific region 1996-2010. Document APFSOS/WP/40(a), FAO, Rome/Bangkok.94 Lu Wenming (1997): Study on China's wood-based panel market outlook for the years 2000-2010. Document APFSOS/WP/40(b), FAO Rome/Bangkok.
Three dominant uses of wood panels are construction, furniture and packaging. Over the past three decades, wood-based panels (particularly veneer and plywood) have spurred the growth of forest products consumption, production and trade in the Asia-Pacific region.
From 1980 to 1994, consumption of wood-based panels in the Asia-Pacific region increased from 19.5 million cubic metres to 35.3 million cubic metres, accounting for 28 percent of world consumption (Table 10.5). This represents a growth rate of 4.3 percent annually. The leading consumers in the region in 1994 were Japan (13 million cubic metres), China (9.8 million cubic metres), and the Republic of Korea (3.4 million cubic metres). The growth in consumption in China, in particular, has been phenomenal. Apparent consumption of wood-based panels in China increased 668 percent between 1980 and 1994.
Table 10.5: Wood-based panel products
|
|
Production |
Imports |
Exports |
||||||
|
1980 |
1994 |
2010 |
1980 |
1994 |
2010 |
1980 |
1994 |
2010 |
|
|
AIEs |
11,446 |
9,595 |
13,764 |
405 |
5,846 |
6,634 |
290 |
865 |
2,067 |
|
NIEs |
2,315 |
2,138 |
2,981 |
635 |
3,598 |
5,312 |
1,623 |
474 |
30 |
|
North Asia |
2,300 |
6,247 |
13,915 |
50 |
3,955 |
2,136 |
884 |
426 |
32 |
|
Southeast Asia |
3,035 |
16,704 |
17,509 |
50 |
312 |
543 |
1,300 |
12,723 |
10,656 |
|
South Asia |
327 |
568 |
853 |
33 |
64 |
30 |
13 |
43 |
8 |
|
Pacific Islands |
31 |
62 |
53 |
18 |
17 |
20 |
15 |
17 |
0 |
|
TOTAL |
19,454 |
35,314 |
49,075 |
1,191 |
13,792 |
14,674 |
4,125 |
14,548 |
12,792 |
|
World |
90,093 |
126,000 |
179,508 |
13,156 |
37,583 |
38,119 |
15,215 |
38,002 |
38,535 |
|
Asia-Pacific share (%) |
21.6 |
28.0 |
27.3 |
9.1 |
36.7 |
38.5 |
27.1 |
38.3 |
33.2 |
|
|
Consumption |
Change 1995-2010 |
|||||
|
Production |
Consumption |
||||||
|
1980 |
1994 |
2010 |
Quantity |
% |
Quantity |
% |
|
|
AIEs |
11,561 |
14,576 |
18,331 |
4,169 |
43.4 |
3,755 |
25.8 |
|
NIEs |
1,327 |
5,262 |
8,263 |
843 |
39.4 |
3,001 |
57.0 |
|
North Asia |
1,466 |
9,776 |
16,019 |
7,668 |
122.7 |
6,243 |
63.9 |
|
Southeast Asia |
1,785 |
4,293 |
7,396 |
805 |
4.8 |
3,103 |
72.3 |
|
South Asia |
347 |
589 |
875 |
285 |
50.2 |
286 |
48.6 |
|
Pacific Islands |
34 |
62 |
73 |
-9 |
-14.5 |
11 |
17.9 |
|
TOTAL |
16,520 |
34,558 |
50,956 |
13,761 |
39.0 |
16,398 |
47.5 |
|
World |
88,034 |
125,580 |
179,092 |
53,508 |
42.5 |
53,512 |
42.6 |
|
Asia-Pacific share (%) |
18.8 |
27.5 |
28.5 |
25.7 |
|
30.6 |
|
The historical trends in wood-based panel consumption are likely to continue over the outlook horizon period. The region's consumption is expected to increase by some 47 percent between 1994 and 2010, from 35 million cubic metres to about 51 million cubic metres. This is an average growth of 2.4 percent per year. Over the same period, the world total consumption of wood-based panels is projected to increase from 126 million cubic metres in 1994 to 179 million cubic metres in the year 2010 (nearly 2.3 percent annually). Thus, the Asia-Pacific region's share of the world total is expected to rise marginally from 27 percent in 1995 to 28 percent by the year 2010.
In terms of panel type, the region's consumption in 1994 comprised 68 percent of veneer sheets and plywood, 17 percent of particleboard and 15 percent of fibreboard. In the coming years the plywood share is expected to decline to around 58 percent of consumption in 2010. The decline could be more substantial if the industry is unable to reinvest in new equipment to peel the smaller logs that will dominate in the corning years. In that case even more significant substitution in favour of reconstituted panels is likely to occur.
Asia-Pacific production of wood-based panels has also increased substantially, from 19.4 million cubic metres in 1980 to 36 million cubic metres in 1994. The region now accounts for 28 percent of world production. The region's largest producers in 1994 were Indonesia (10.5 million cubic metres), Japan (7.5 million cubic metres), the People's Republic of China (6.2 million metres) and Malaysia (4.9 million cubic metres).
Asia-Pacific Forest Products Model panel products forecast
As demand in the region continues to increase, production of wood-based panels in the Asia-Pacific region is also expected to increase - from 35 million cubic metres in 1994 to 49 million cubic metres by the year 2010. The region's share of world production is projected to decrease marginally from 28 percent to 27.3 percent. By 2010, the major producers of wood-based panels in the region will be the People's Republic of China (13.9 million cubic metres), Indonesia (12 million cubic metres), Japan (9.5 million cubic metres), and Malaysia (4.1 million cubic metres). Almost 55 percent of the total increase in production between 1994 and 2010 is projected to take place in China.
Of the projected 13.7 million cubic metres increase in production between 1994 and 2010, plywood and veneers are expected to account for 2.9 million cubic metres, an increase of 11 percent over 1994 levels. Particleboard and OSB production is projected to increase by about 77 percent (4.1 million cubic metres) and fibreboard production (including MDF) by 147 percent (6.7 million cubic metres).
The total panel imports of the region were 13.8 million cubic metres in 1994, or 36.7 percent of the world's total. More than three-quarters of imports were plywood, and the majority of these products originated from countries within the region, particularly Indonesia and Malaysia. The two largest panel importers in 1994 were Japan with 5.6 million cubic metres and the People's Republic of China with 3.9 million cubic metres. Together, these countries account for almost 70 percent of the region's total imports of wood-based panels. Other important panel importers are the Republic of Korea and Hong Kong SAR, China.
Although the Asia-Pacific region has long been a net exporter of wood-based panels, a reversal of this pattern is expected by the year 2010. Regional consumption, projected to be 50.9 million cubic metres by 2010, is expected to exceed production by 1.9 million cubic metres (3.7 percent). This small gap masks significant shortfalls projected for North Asia and the NIEs.
As a result of these shortfalls, total imports are projected to increase 6 percent from 13.7 million cubic metres in 1994 to 14.6 million cubic metres in 2010, while total exports are projected to decline slightly, from 12.7 million cubic metres to 10.6 million cubic metres. The region's share of world panel imports is forecast to increase from 36 percent to 38 percent between 1994 and 2010. The region's share of world exports is projected to decline from 38 percent to 33 percent during the same period. Japan will be matched by the People's Republic of China as the region's largest consumer, by 2010. The region will also become a net importer of plywood, largely as a result of Indonesia consuming more of its own output. Indonesia, Malaysia and New Zealand are predicted to heavily dominate wood panel exports by 2010 with these three countries expected to account for 98 percent of the Asia-Pacific region's total panels exports in 2010.
Panel products forecasts by other contributors to APFSOS
Difficulties with panel products data, and the supply-side construction of the Asia-Pacific Forest Products Model make it worthwhile to also examine the projections produced independently by the ITTO and Michael Lyons in support of this study (Table 10.6).
International Tropical Timber Organisation Trade Model95 The ITTO model predicts consumption of panel products will increase by 51 percent in ITTO member countries between 1995 and 2010. The consumption of plywood is predicted, however, to decline by 35 percent in this period and production of plywood is expected to decline by 45 percent. Significant substitution by other panel products produced from mill and harvest residues, small logs and coniferous logs are the primary elements associated with these changes, a result that accords closely with the resource trends identified in Section 4. It is notable, however, that while the APFPM and the ITTO models differ considerably in their assessment of the mix of panel products, the magnitudes of increase in overall panel products consumption predicted by the two models are both high (APFPM 47.5 percent: ITTO 51.3 percent).
95 Results are presented for the ITTO Trade Model's Base Scenario. Detailed results (and assumptions) for this scenario, a scarcity scenario, and a scarcity scenario with strong demand, are presented in APFSOS/WP/20. The ITTO Trade Model uses a methodology similar to the APFPM but focuses on trade balances in logs, sawnwood and plywood in ITTO member countries only (Box 10.3). It is, therefore, less sensitive to global scale and multi-product changes in supply and demand than the APFPM, but is more responsive to industry structural changes within its domain. A major difference in the data structure of the models (and hence results) is that the APFPM utilises aggregated roundwood supply data, whereas the ITTO model differentiates saw/veneer logs from small fibre logs. This enables the ITTO model to identify clearly problems associated with shortages in larger dimension logs while the APFPM has insufficient log-assortment resolution to track this particular issue. As a consequence, the forecasts of the two models, with respect to plywood production in the Asia-Pacific region, are markedly different.
Lyons Survey-Assessment of Wood-Panels' Trends. In a background study for the APFSOS, Lyons96 estimates consumption in the region for the different types of panels under three scenarios. For the year 2010, consumption of wood-based panels in the Asia-Pacific region is estimated at 96.4 million cubic metres in the "most probable" scenario. This is significantly greater (by 90 percent) than the APFPM estimate of 50.9 million cubic metres. In his "most pessimistic" scenario for the year 2010, Lyons estimates consumption of wood-based panels at 78.8 million cubic metres (a 77 percent increase over current levels of consumption).
96 M.J. Lyons (1997). Document APFSOS/WP/40(a) op cit.
Table 10.6: Estimates of changes in wood panel consumption in Asia-Pacific, 1995-2010
|
Scenario |
Total panels (%) (A) |
Plywood & veneer (%) (B) |
Particlebd/OSB (%) (C) |
Fibrebd/MDF (%) (D) |
Reconst. panels (%) (C+D) |
|
Lyons "Pessimistic"97 |
77 |
39 |
149 |
125 |
139 |
|
Lyons "Most probable" |
117 |
59 |
227 |
190 |
212 |
|
FAO: APFPM - this study |
47 |
27 |
72 |
111 |
45 |
|
ITTO "Base scenario" |
51 |
(-35) |
- |
- |
548 |
97 Specific panel-type percentages are proportionate with "Most probable" scenario.
Two important features are predicted by all the studies. First, consumption of panel products will increase substantially over the next 15 years. Second, the rate of increase in reconstituted panel products will be markedly faster than for plywood and veneer. The relative magnitudes of increase (or decrease) are largely dependent on assumptions of rates of economic growth and assumptions on availability of large-dimension logs.
Outlook for pulp and paper products
Except in South Asia and the People's Republic of China (where small-scale production units are common), the pulp and paper sub-sector is dominated by large-scale mills with well-documented capacity and output. For mainstream wood pulp and paper and paperboard manufacture, capacity changes and investment plans are regularly reported in the sector press, and statistics on capacity are published annually by FAO98 Thus projections can be based on more reliable information than for many other products.
98 The FAO statistics are published as a three-language Pulp and paper capacities with a 5-year time horizon, the latest being 1996-2001. The compilation is by Jaako Poyry Consulting (Asia-Pacific) Pte. Ltd, Singapore (see below).
The region's consumption of paper and paperboard increased from about 33.5 million metric tonnes in 1980 to 81.5 million metric tonnes in 1994 (Table 10.7). In 1994, consumption was 8 million metric tonnes of newsprint, 23 million metric tonnes of printing and writing paper, and 49 million metric tonnes of other paper and paperboard. The largest consumers in 1994 were Japan and China, each consuming 29 million metric tonnes. These two countries accounted for two-thirds of the region's total consumption in 1994.
Table 10.7: Paper and paperboard production, imports, exports and consumption (1,000 metric tonnes)
|
|
Production |
Imports |
Exports |
||||||
|
1980 |
1994 |
2010 |
1980 |
1994 |
2010 |
1980 |
1994 |
2010 |
|
|
AIEs |
20,192 |
31,619 |
50,936 |
1,394 |
2,611 |
609 |
1,182 |
1,622 |
3,073 |
|
NIEs |
1,740 |
6,725 |
10,011 |
889 |
4,531 |
7,667 |
248 |
3,137 |
492 |
|
North Asia |
6,947 |
26,983 |
51,075 |
640 |
4,058 |
631 |
149 |
1,158 |
3,510 |
|
Southeast Asia |
1,010 |
5,953 |
9,406 |
755 |
2,082 |
2765 |
27 |
973 |
879 |
|
South Asia |
1,119 |
3,233 |
5,398 |
430 |
634 |
407 |
23 |
25 |
29 |
|
Pacific Islands |
0 |
0 |
0 |
25 |
33 |
36 |
0 |
0 |
0 |
|
TOTAL |
31,008 |
74,513 |
126,825 |
4,133 |
13,949 |
12,116 |
1,629 |
6,915 |
7,984 |
|
World |
159,160 |
269,380 |
393,952 |
29,494 |
69,747 |
72,389 |
32,910 |
72,687 |
75,337 |
|
Asia-Pacific share (%) |
19.5 |
27.7 |
32.2 |
14.0 |
20.0 |
16.7 |
4.9 |
9.5 |
10.6 |
|
|
Consumption |
Change 1994-2010 |
|||||
|
Production |
Consumption |
||||||
|
1980 |
1994 |
2010 |
Quantity |
% |
Quantity |
% |
|
|
AIEs |
20,404 |
32,608 |
48,472 |
19,317 |
61.1 |
15,864 |
48.6 |
|
NIEs |
2,381 |
8,119 |
17,186 |
3,286 |
48.9 |
9,067 |
111.7 |
|
North Asia |
7,438 |
29,883 |
48,195 |
24,092 |
89.3 |
18,312 |
61.3 |
|
Southeast Asia |
1,738 |
7,062 |
11,292 |
3,453 |
58.0 |
4,230 |
59.9 |
|
South Asia |
1,526 |
3,842 |
5,776 |
2,165 |
67.0 |
1,934 |
50.3 |
|
Pacific Islands |
25 |
33 |
36 |
0 |
N/A |
3 |
9.7 |
|
TOTAL |
33,512 |
81,547 |
130,957 |
52,312 |
70.2 |
49,410 |
60.6 |
|
World |
155,744 |
266,440 |
391,004 |
124,572 |
46.2 |
124,564 |
46.8 |
|
Asia-Pacific share (%) |
21.5 |
30.6 |
33.5 |
42.0 |
|
39.7 |
|
The region's paper and paperboard consumption is projected to increase by 34 million metric tonnes, to around 127 million metric tonnes, by 2010 (Table 10.7). This implies an average annual growth rate of 3 percent. Over the same period, the Asia-Pacific region's share of the world's consumption is projected to increase from 30 percent to 33 percent. These projections are moderately lower that those of Jaako Poyry's recent study" (1997), which predicts that regional consumption of paper and paperboard in 2010 will be around 150 million metric tonnes. That study, however, assumed faster economic growth rates than those assumed for APFSOS.
99 J. Poyry Consulting (June 1997). Business opportunities in the Asia-Pacific pulp and paper industry. A close look at resources, markets and industry. Jaakko Poyry Consulting (Asia-Pacific) Pte. Ltd, Singapore.
The People's Republic of China's consumption of paper and paperboard is expected to grow by more than 50 percent to reach 48 million metric tonnes in 2010. (China has already overtaken Japan as the largest consumer in the region.) Sizeable increases in consumption are projected for Japan, the Republic of Korea, Indonesia, India, Australia, Thailand and Malaysia.
In 1994, the Asia-Pacific region produced 28 percent of the world's production of paper and paperboard. The largest producers in the region in 1994 were Japan (29 million metric tonnes) and China (27 million metric tonnes) which together account for 75 percent of regional output. Other major producers are the Republic of Korea (6.3 million metric tonnes), Indonesia (3.0 million metric tonnes), India (2.6 million metric tonnes) and Australia (2.2 million metric tonnes). Japan, the Republic of Korea and Indonesia are basically self-sufficient, while other countries depend to a greater or lesser degree on imports to meet domestic needs. By 2010, the Asia-Pacific region will be a significant net importer from other regions - probably North America and Russia. There is, however, potential within the region to make use of the large volumes of low-quality fibre from wastes, natural forest and young plantations.
Production of paper and paperboard in the region is projected to rise by 52 million metric tonnes to nearly 127 million metric tonnes by the year 2010. Of the total production in 2010, about 13 million metric tonnes are expected to be newsprint, 39 million metric tonnes are forecast to be printing and writing paper, and 75 million metric tonnes will be "other paper and paperboard." The region's share of world production is projected to increase from 28 percent to 32 percent. In 2010, the People's Republic of China (with expected production of 51 million metric tonnes) is expected to be the major producer of paper and paperboard in the region. Other significant producers are expected to be Japan (45 million metric tonnes), the Republic of Korea (9 million metric tonnes); and Indonesia (5 million metric tonnes). There are several constraints to be overcome, however, in relation to future production growth in the region (Box 10.5).
|
Box 10.4: ASIA-PACIFIC'S LARGE LATENT DEMAND FOR PAPER AND PAPERBOARD The region has major growth potential for consumption of paper and paperboard, which remains latent due to low incomes. The case of India illustrates this well: in 1995, per capita paper consumption was 242 kilograms in Japan, 24 kilograms in the People's Republic of China, 17 kilograms in Indonesia and only about 3 kilograms in India. In that year, India's consumption was about 3.3 million metric tonnes for a population of 929 million. With such a large population, and low current consumption, even small increases in per capita use result in massive absolute increases. For example, if India's consumption merely reached Indonesia's average (a relatively low level that could be a realistic possibility by year 2010), national requirements would rise nearly sevenfold to 19.6 million tonnes, since India's population will by then have reached 1.15 billion. A consumption rate equal to the People's Republic of China's present one would translate into a demand of 27.7 million tonnes, which is nearly equal to China's or Japan's current consumption. Long-term planning will need to focus on developments in per capita consumption rates and policies that affect it, such as literacy drives and packaging standards. |
The Asia-Pacific region has been a net importer of paper and paperboard for the past three decades. Total imports of the region increased from 4.1 million metric tonnes in 1980 to 14 million metric tonnes in 1994. About 60 percent of those imports were other paper and paperboard - newsprint, and printing and writing paper accounted for about 20 percent each. In 1994, the largest importers were China (4.0 million metric tonnes) along with Hong Kong SAR, China (2.9 million metric tonnes) and Japan (1.4 million metric tonnes). Nearly half of Hong Kong SAR, China's imports were re-exported, mainly to its parent. Australia, Malaysia and Singapore also imported sizeable amounts of paper and paperboard.
|
Box 10.5: CONSTRAINTS TO DEVELOPING PULP AND PAPER CAPACITY Production forecasts for paper products (Table 10.7) suggest that a major increase in the Asia-Pacific region's papermaking capacity is imminent. At present, Indonesia and the People's Republic of China in particular have very large pipelines of proposed investments.100 China has five new paper mills planned to come on line in 1998, with 32 new projects announced, each with a capacity exceeding 100,000 metric tonnes. The rest of Asia has confirmed plans totalling another 9.5 million tonnes, including Indonesia with publicly announced capacity increases totalling nearly 5,9 million tonnes. Overall, pulp and paper capacity in the region is projected to increase by more than a third by 2010. There are, however, substantial hurdles to overcome if such a scenario is to be realised within such a relatively short timeframe. Some key constraints may be: 100 An up-to-date but pre-financial crisis assessment of situation and capacity plans is: Jaako Poyry Consulting (1997): Business opportunities in the Asia-Pacific pulp and paper industry - a close look at resources, markets and industry. Jaako Poyry Consulting (Asia-Pacific) Pte. Ltd. Singapore. · the need for very rapid establishment, and consumer acceptance and participation, of substantial wastepaper collection networks; · the need to access very substantive sums of investment capital to ensure the establishment of sufficient industrial capacity. This may be very difficult in the present economic climate; · locating economically accessible forest resources to meet fibre demands; forests may be geographically inaccessible, too dispersed to provide sufficient fibre to large-scale mills, or comprised of species unsuitable for particular types of papermaking (or more highly valued in alternative uses or for conservation); and · technical limits relating to fibre properties of various tree species, tree ages, and specific pulp mixes (e.g. the variable quality of various mixed tropical hardwood pulps is a problem in a number of applications). Similar constraints exist on the proportion of recycled fibre that can be mixed with virgin fibre to produce satisfactory paper quality. |
The Asia-Pacific region is expected to remain a net importer of paper and paperboard over the outlook period. Total imports are, however, projected to decline as new capacity is installed in the region. Imports are expected to decline by 13 percent, to 12 million metric tonnes in 2010. The region's share of world imports is expected to decrease from 20 percent to 16.7 percent. The three Newly Industrialised Economies are expected to become the largest importers of paper by 2010, collectively accounting for 63 percent of the region's imports. China's imports could remain significant if the observed market preference for wood-based paper drives demand away from non-wood paper. At present, stocks of such paper are accumulating while the country imports wood-based paper products.101
101 Zhu Zhaohua et al. (1977). The status, trends and prospects for non-wood and recycled fibre sources in China: Document APFSOS/WP/35 (1997).
Exports of paper and paperboard in the region increased from 1.6 million metric tonnes to 6.9 million metric tonnes between 1980 and 1994, increasing from 5 percent to 9.5 percent of the world's exports. "Other paper and paperboard" exports accounted for three-quarters of total exports. In 1994, the major exporters were Hong Kong SAR, China (1.4 million metric tonnes), the People's Republic of China (1.1 million metric tonnes) and the Republic of Korea (1.3 million metric tonnes).
Total exports of paper and paperboard in the Asia-Pacific region are projected to increase slightly, to 7.9 million metric tonnes by the year 2010. As a result of increases in domestic consumption, many countries in the Asia-Pacific region are expected to reduce exports. By 2010, Japan and the People's Republic of China are expected to account for 72 percent of regional paper and paperboard exports.
Outlook for residues, recovered paper and non-wood fibre for pulp and paper manufacture
With expected continuing growth in the production of most forest products in the region over the next 15 years, expansion of the pulp and paper industry will depend to a large extent on the availability of raw material. Analysis conducted for the APFSOS indicates that a substantial increase in the use of residues, wastepaper and non-wood fibre can probably provide all the raw material needed for the production of pulp and paper products as well as reconstituted panel products. These raw materials can complement, and in some cases substitute for, scarce industrial roundwood. Many countries have papermaking capacity without their own pulp manufacturing and are, therefore, fully dependent on imports of both recovered paper and virgin pulp.
The composition of fibre-furnish for paper manufacture is already adjusting to these new raw material opportunities, with a detectable shift toward increased use of waste-paper (Table 10.8). For the region as a whole, wood pulp's share of total fibre-furnish is expected to remain stable at about one-third, through 2010, but the use of recovered paper is forecast to rise from 42 percent to 48 percent. The share of non-wood fibre is expected to decline from 25 percent to about 19 percent. Non-wood fibre use will likely remain concentrated in North Asia (especially the People's Republic of China where around 41 percent of fibre-furnish is expected to come from non-wood sources by 2010).
Non-wood fibres are widely available in the region but the People's Republic of China and India account for most of the existing production and use of this raw material. Production of non-wood fibre pulp in the region increased from 7.2 million metric tonnes in 1980 to 20.6 million metric tonnes in 1994. Recent preference in China for wood-based paper, however, coincides with closure of the smallest non-wood fibre pulp mills for environmental reasons. These trends, if continued, could substantially reduce growth of this sub-sector. Non-wood fibre pulp production is, however, expected to show some growth, reaching an estimated 30 million metric tonnes in 2010. Almost all of the growth is expected to occur in China.
Table 10.8: Trends in consumption production and trade in fibre-furnish
|
Fibre Furnish |
Production |
Imports |
exports |
||||||
|
1980 |
1994 |
2010 |
1980 |
1994 |
2010 |
1980 |
1994 |
2010 |
|
|
AIEs |
20,012 |
28,738 |
47,088 |
2,452 |
4,203 |
2,551 |
602 |
958 |
1,694 |
|
NIEs |
1,303 |
4,232 |
6,765 |
1,018 |
3,511 |
4,574 |
454 |
850 |
2,008 |
|
North Asia |
6,472 |
27,692 |
48,838 |
987 |
3,676 |
5,209 |
49 |
40 |
30 |
|
Southeast Asia |
700 |
3,035 |
8,012 |
455 |
2,880 |
1,774 |
12 |
615 |
1,050 |
|
South Asia |
1,244 |
2,892 |
4,572 |
62 |
496 |
401 |
0 |
4 |
11 |
|
Pacific Islands |
0 |
0 |
9 |
0 |
0 |
0 |
0 |
2 |
9 |
|
TOTAL |
29,731 |
66,589 |
115,283 |
4,974 |
14,766 |
14,510 |
1,117 |
2,469 |
4,802 |
|
World |
170,298 |
271,373 |
368,147 |
21,648 |
45,805 |
46,544 |
24,469 |
46,069 |
46,581 |
|
Asia-Pacific share (%) |
17.5 |
24.5 |
31.3 |
23.0 |
32.2 |
31.2 |
4.6 |
5.4 |
10.3 |
|
Fibre Furnish |
Consumption
|
Change 1995-2010
|
|||||
|
Production
|
Consumption
|
||||||
|
1980 |
1994 |
2010 |
Quantity |
% |
Quantity |
% |
|
|
AIEs |
21,862 |
31,983 |
47,944 |
18,350 |
639 |
15,961 |
499 |
|
NIEs |
1,867 |
6,893 |
9,331 |
2,533 |
598 |
2,438 |
354 |
|
North Asia |
7,410 |
31,328 |
54,017 |
21,146 |
764 |
22,689 |
724 |
|
Southeast Asia |
1,143 |
5,300 |
8,737 |
4,977 |
1640 |
3,437 |
648 |
|
South Asia |
1,306 |
3,384 |
4,962 |
1,680 |
581 |
1,578 |
466 |
|
Pacific Islands |
0 |
-2 |
0 |
9 |
N/A |
2 |
-1000 |
|
TOTAL |
33,588 |
78,886 |
119,990 |
48,694 |
731 |
41,104 |
521 |
|
World |
167,477 |
271,112 |
368,080 |
96,774 |
357 |
96,968 |
358 |
|
Asia-Pacific share (%) |
201 |
291 |
326 |
503 |
|
424 |
|
Wastepaper offers significant additional potential as an alternative raw material. Further collection and re-use of wastepaper will become increasingly feasible with increased urbanisation. To date, Japan and the Republic of Korea are the only countries that are close to reaching maximum practical capacity rates of utilisation for wastepaper, and both countries also import significant quantities of wastepaper. The People's Republic of China is, however, rapidly increasing domestic use of its wastepaper resource. Between 1980 and 1994, the consumption of wastepaper in the region increased by over 55 percent from 13 million metric tonnes to 33 million metric tonnes, predominantly due to increases in these three countries. Between 1994 and 2010, consumption of wastepaper is expected to rise by a further 81 percent to 60 million metric tonnes. Imports of wastepaper are expected to continue but more reliance is expected to be on regional and national resources. Japan, the Republic of Korea and China will continue to dominate wastepaper consumption, but large increases are also expected in India (increasing from 750,000 metric tonnes to 1.6 million metric tonnes) and Indonesia (increasing from 990,000 metric tonnes to 1.9 million metric tonnes).
Harvesting and processing residues constitute a large resource that is likely to be increasingly utilised in the region. Use of these residues is limited partly by the distance from their production to locations where they can be utilised (i.e. pulp and paper or reconstituted-panel mills). In many cases, sawmills are small and scattered, and transporting chips and other residues to pulp mills may not be financially feasible. Furthermore, much forest harvesting and milling occurs in countries that do not have large enough markets for reconstituted panels, or lack a pulping industry to use residues and smallwood.
Outlook for prices for wood-based products
Historically, the price of sawnwood has paralleled the price of industrial roundwood, mainly because roundwood is a major part of the total cost of sawmilling, reaching as high as 60 to 70 percent. There is little likelihood of significant global price changes for industrial roundwood, sawnwood, wood-based panels, and paper and paperboard products over the next 15 years, other than normal cyclic shifts. For panels, at the global level, there has, in fact, been a mild price decline from the 1960s through the late-1980s. Only small price increases for wood-panels can be expected in the period till 2010.
For paper and paperboard products, there has been a long-term slow-but-steady general decline in real prices (notwithstanding the marked cyclic patterns) during recent decades. This trend is expected to continue till 2010.
In summary, the outlook suggests that the real price of industrial roundwood, worldwide, will remain relatively stable over the next 15 years. The prices of sawnwood and plywood are expected to increase slightly, while those of the other wood-based panels, and paper and paperboard will change little or perhaps decrease slightly.
Summary of outlook for wood-based products
In general, demand in the region for all forest products will increase significantly due to population growth and an anticipated return to strong economic performance. Absolute consumption will be greatest in Japan, the People's Republic of China, and India. Although many countries are expected to expand production and consumption, this will be from relatively low base levels. Asia and the Pacific will likely increase its share of global consumption relative to other regions.
There is broad consensus among recent studies that wood supplies at a global level will be adequate to meet demands for both industrial wood and fuelwood in the immediate future. For the Asia-Pacific region as a whole, there is little evidence to suggest the supply-demand balance will be any more seriously compromised than the present levels of shortfall, through the year 2010. The one major exception is for large-size logs, which are already in short supply.
Several other specific points relative to forest products that have emerged from the APFSOS are important to highlight:
· the Asia-Pacific will increase its dependence on imports for all industrial wood products;· by 2010, Asia-Pacific consumption of wood-based panels and paper and paperboard will exceed consumption in both North America and Europe; Asia-Pacific consumption of sawnwood will be second only to that in North America (Table 10.9);
· Asia-Pacific will become a net importer of wood-based panels, changing from its current position as a net exporter;
· For the region as a whole, imports are expected to supply 16 percent of the region's industrial roundwood; 18 percent of sawnwood; 28 percent of wood-based panels; 9.2 percent of paper and paperboard; and 11.6 percent of fibre-furnish;
· regional production of paper and paperboard will likely increase to 126 million metric tonnes from 75 million metric tonnes;
· consumption of practically all commodities is led by the needs of North Asia, particularly demand in Japan and China; these countries will be the dominant influence in trade;
· use of wastepaper will continue to expand and the region's countries will increasingly collect and re-use paper collected in domestic recovery operations; imports will, however, continue to be significant;
· use of "other fibre" pulp will remain important but growth will be modest due to environmental concerns and adverse market preferences, particularly in China; and
· the very large latent market for paper and its products could emerge to create huge new demands for paper, particularly if economic growth accelerates in key countries such as India; this would likely lead to major investments in new production capacity and expanded levels of imports.
A critical aspect of the outlook for the Asia Pacific region is the considerable differences among countries of the region, with their different resource endowments, levels of economic development, and population growth rates. There are, therefore, likely to be some significant deficits of specific wood products (e.g. large-diameter logs) while overall supplies may appear adequate at the aggregate. The situation will be exacerbated by anticipated rapid growth of consumption in some countries such as China, and other countries' shifts from exporting status to importing status as domestic consumption grows.
Table 10.9: Regional comparison of projected consumption in 2010
|
Commodity |
Units |
Asia-Pacific |
Americas |
Europe |
World |
|
Sawnwood |
million m3 |
142.3 |
196.5 |
140.6 |
498.3 |
|
Wood-based panels |
million m3 |
50.9 |
59.0 |
63.5 |
179.0 |
|
Paper & paperboard |
million MT |
130.9 |
144.8 |
105.5 |
391.0 |
|
Industrial roundwood |
million m3 |
466.3 |
773.9 |
542.3 |
1880.7 |
The region will remain heavily dependent on trade to balance national and regional supply shortfalls. The Asia-Pacific region is already the world's largest net importing region, and this situation is expected to persist for the foreseeable future. By 2010, the region is projected to be a net importer of all forest products. Net imports and import dependence are both projected to increase as compared to 1994 (Table 10.10). Some countries (e.g. New Zealand) will likely expand their exports while other countries will likely reduce exports as their domestic markets expand and forest resources decline. Intra-regional trade will continue to be extremely important, particularly between neighbouring countries, and between those with trade agreements.
The general thrust toward more liberal trade policies, through the World Trade Organisation, and through regional agreements such as APEC and ASEAN, should assist both in matching supply and demand, and encouraging more efficient production and processing of wood. For example, the removal of import restrictions and lowering of tariffs should eliminate margins for wastage by protected domestic processors. Nonetheless, it is notable that most of the countries that face the most severe pressure on wood supplies are not participants in the key regional trade agreements and often lack the capacity to participate adequately in trade. For these countries the focus is likely to be on developing domestic production capacity to alleviate supply shortfalls.
Table 10.10: Actual and projected Asia-Pacific consumption and net imports in Asia-Pacific
|
|
1994 |
2010 | |||
|
Commodity group |
Units |
Consumption |
Net imports |
Consumption* |
Net imports* |
|
Fuelwood |
million m3 |
1,022,841 |
- |
1,294,765 |
- |
|
Industrial roundwood |
million m3 |
318,164 |
33,691 |
466,331 |
45,440 |
|
Sawnwood |
million m3 |
111,718 |
11,149 |
142,350 |
19,523 |
|
Wood-based panels |
million m3 |
34,558 |
(-756) |
50,956 |
1,882 |
|
Wood pulp |
million MT |
26,042 |
7,594 |
30,422 |
6,522 |
|
Waste paper |
million MT |
33,364 |
4,569 |
60,646 |
2,875 |
|
Paper & paperboard |
million MT |
81,547 |
7,034 |
130,957 |
4,132 |
* Model-based projections.
The AIEs (especially Japan), and NIEs will be crucial in determining the patterns of forestry trade within the region. Japan is by far the region's largest importer of forest products and almost all of the region's exporting countries depend heavily on the Japanese market. Changes in Japanese consumer preferences, Japan's economic growth rate, or any large increase or decrease in harvesting of Japan's forest resources, would likely result in significant disruption of trading patterns in the region.
In general, Japan is likely to play a leading role in determining changes in production and consumption of wood in the region. For example, a shift in Japanese consumption patterns, in terms of substituting softwood for hardwood in some applications, could offset potentially declining production of tropical timber in major supplier countries such as Malaysia and Indonesia. Another example is Japan's successful programme to increase the use of recycled paper to supplement wood-fibre supplies. Japanese regulatory requirements, for recycled fibre to comprise a fixed proportion of manufactured paper, may encourage more widespread development of wastepaper collection systems.
The relative stagnation in sawnwood production is likely to persist to 2010. The declining availability of large diameter logs, concurrent with improved technologies for manufacturing engineered wood products and panels will likely encourage the continuing shift away from sawnwood. It seems also likely that panel products consumption will continue to grow spectacularly. Based on the North American experience, there will likely be significant substitution by medium-density fibreboard and oriented strandboard for hardwood plywood for construction purposes.
In pure volume terms, the largest growth can be expected in the paper and paperboard sector. This sector, however, offers significant opportunities to relieve pressure on forests through recycling and the use of non-wood fibres and wood residues. Asia, with its large urban areas, has enormous potential to improve collection and utilisation of wastepaper. At present only Japan, and possibly the Republic of Korea, appear to be utilising the full potential of the wastepaper resource. Similarly, use non-wood fibres can potentially expand beyond the People's Republic of China and India.
Many countries are likely to give increased emphasis to the production and trade of higher-value products, although there will be considerable variation between countries in the region. For some countries this will mean moving toward panels and paper, for others toward furniture and builders' woodwork.
Two major areas of uncertainty concerning trade will remain: 1) the future supply situation of the countries of the Russian Far East; and 2) the economic development of the two large developing countries - the the People's Republic of China and India.
In mid-1997, a number of key Asian currencies suffered significant depreciation, signaling the beginning of what is now recognised as a major recession. In May 1998, the currencies of Malaysia, The Philippines, the Republic of Korea and Thailand were trading at about two-thirds the value of May 1977. The Indonesian rupiah was trading at 25 percent its May 1997 level. Major economic and structural problems became evident in most of these countries as liquidity tightened and major recessionary conditions took hold.
In terms of forest products trade, the key variable at the regional level is the extent to which Japan, the dominant importer, is drawn into the recession; at the global level the most important factor is whether the recession spreads to American and European markets. At present, recession is confined to the Asia-Pacific region, with a Japanese economy that is showing few signs of resurgence. The major impacts are:
· overall, reduced demand for all forest products, with the most significant affected countries being Japan, the Republic of Korea, the People's Republic of China and Thailand;· increased competitiveness of affected exporting countries (including Malaysia and Indonesia) through exchange rate depreciation, but in the face of reduced demand;
· falling prices for forest products throughout the region;
· reduced earnings in the forestry sector resulting in closure of mills, reduced harvests and workforce lay-offs. These effects have spread outside the Asian region to a number of countries with heavy dependence on Asian markets.
Modelling the economic downturn
The full impacts of the downturn have yet to clearly emerge. For example, it is presently unclear how badly Japan may be affected by the turmoil in neighbouring economies or how adversely Japan's own continuing recession will affect neighbouring countries' ability to recover. In the interim, however, it is useful to provide some modelled estimates of potential effects on wood products of a downturn of approximately the current magnitude. The APFSOS has, therefore, generated a scenario of adjusted national GDP growth rates and assessed the likely impacts of such a downturn. These, in turn have been utilised in the APFPM to estimate potential impacts of the downturn. These GDP assumptions are listed in Table 2.5 as the APFSOS downturn scenario. The central assumption is that immediate effects of the downturn, across the region, while being significant, are not devastating. The impacts of the downturn are, however, modelled as being persistent and for most countries the modelling could thus be generally described as reflecting a long but relatively shallow recession. The impacts income specific countries are, however, assumed to be more severe.
The overall general effect of the downturn is to reduce-demand and consumption relative to the base scenario (which ignores the economic downturn). Gross volumes of production, consumption and trade are, however, expected to continue to increase during the next decade despite the economic downturn. The variables that drive overall growth under the base scenario are assumed merely to operate in a more muted fashion in the downturn scenario. Most of the subsequent discussion compares the relative outcomes of the two scenarios. The key results of the modelling are summarised in Table 10.11.
It is important to recognise that the results of the modelling are merely indicative. The model presents one possible future and set of actions that are intuitively reasonable but by no means deterministic.
Outlook for fuelwood (downturn scenario)
Since a large proportion of fuelwood production and consumption occur outside of the formal economy the downturn is forecast to have little impact on the fuelwood sector and consequently no specific modelling was attempted for fuelwood. Demand for fuelwood will continue to be influenced by a complex, and poorly understood, set of income and substitution effects. Thus, in some areas where fuelwood is a marketable commodity (for example, in cities), lower incomes may cause consumption to decline or increase depending on the costs of fuelwood relative to kerosene and alternative fuels. In areas where fuelwood is freely gathered (mainly rural areas), the income effects are likely to be negligible though substitution effects, particularly those operating through employment markets, may well have some impacts.
Table 10.11: Production, consumption and trade in selected wood products - downturn scenario
|
INDUSTRIAL ROUNDWOOD |
Production |
Imports |
Exports |
Consumption | ||||||||
|
Sub-region |
1994 |
2002 |
2010 |
1994 |
2002 |
2010 |
1994 |
2002 |
2010 |
1994 |
2002 |
2010 |
|
AIEs |
61,141 |
62401 |
73,645 |
45,600 |
51,199 |
54,392 |
12,860 |
7,368 |
9,414 |
93,881 |
106,231 |
118,623 |
|
NIEs |
1,994 |
3491 |
3,478 |
11,290 |
12,811 |
16,835 |
160 |
58 |
16 |
13,124 |
16,245 |
20,297 |
|
North Asia |
100,147 |
115975 |
138,289 |
4,636 |
1,214 |
4,033 |
2,577 |
720 |
201 |
102,206 |
116,469 |
142,121 |
|
South Asia |
28,816 |
48438 |
47,314 |
418 |
229 |
6,746 |
17 |
8 |
2 |
29,217 |
48,659 |
54,057 |
|
Southeast Asia |
89,030 |
110955 |
120,106 |
2,258 |
182 |
8 |
10,880 |
17,570 |
17,873 |
80,408 |
93,567 |
102,241 |
|
Pacific Islands |
3,345 |
4698 |
5,274 |
2 |
1 |
0 |
4,019 |
3925 |
4,845 |
-672 |
773 |
429 |
|
Total |
284,473 |
345957 |
388,106 |
64,204 |
65,636 |
82,013 |
30,513 |
29,649 |
32,350 |
318,164 |
381,944 |
437,768 |
|
SAWNWOOD |
Production |
Imports |
Exports |
Consumption | ||||||||
|
Sub-region |
1994 |
2002 |
2010 |
1994 |
2002 |
2010 |
1994 |
2002 |
2010 |
1994 |
2002 |
2010 |
|
AIEs |
32,091 |
33798 |
39,920 |
11,833 |
13,135 |
11,044 |
1,119 |
1,375 |
3,217 |
42,805 |
45,558 |
47,747 |
|
NIEs |
3,665 |
4424 |
4,535 |
2,216 |
1,628 |
2,366 |
474 |
123 |
32 |
5,407 |
5,930 |
6,870 |
|
North Asia |
25,599 |
27,001 |
29,048 |
2,403 |
4,628 |
7,410 |
800 |
336 |
140 |
27,202 |
31,292 |
36,318 |
|
South Asia |
19,306 |
21,401 |
23,416 |
43 |
14 |
8 |
9 |
7 |
2 |
19,340 |
21,407 |
23,423 |
|
Southeast Asia |
19,632 |
19,618 |
20,219 |
2,894 |
3,011 |
1,845 |
5,864 |
4,362 |
2,634 |
16,662 |
18,267 |
19,430 |
|
Pacific Islands |
276 |
242 |
286 |
71 |
72 |
35 |
45 |
4 |
0 |
302 |
309 |
321 |
|
Total |
100,569 |
106,483 |
117,424 |
19,460 |
22,488 |
22,708 |
8,311 |
6,208 |
6,025 |
111,718 |
122,763 |
134,109 |
|
WOOD BASED PANELS |
Production |
Imports |
Exports |
Consumption | ||||||||
|
Sub-region |
1994 |
2002 |
2010 |
1994 |
2002 |
2010 |
1994 |
2002 |
2010 |
1994 |
2002 |
2010 |
|
AIEs |
9,595 |
8,936 |
10,529 |
5,846 |
7,590 |
8,955 |
865 |
665 |
1,571 |
14,576 |
15,860 |
17,914 |
|
NIEs |
2,138 |
3,591 |
3,908 |
3,598 |
2,458 |
3,242 |
474 |
120 |
31 |
5,262 |
5,928 |
7,119 |
|
North Asia |
6,247 |
8,416 |
12,128 |
3,955 |
3,900 |
2,334 |
426 |
126 |
34 |
9,776 |
12,190 |
14,428 |
|
South Asia |
568 |
743 |
858 |
64 |
8 |
12 |
43 |
29 |
8 |
589 |
722 |
862 |
|
Southeast Asia |
16,704 |
16,628 |
15,482 |
312 |
155 |
110 |
12,723 |
12,133 |
10,198 |
4,293 |
4,650 |
5,394 |
|
Pacific Islands |
62 |
43 |
42 |
17 |
19 |
22 |
17 |
1 |
0 |
62 |
61 |
65 |
|
Total |
35,314 |
38,355 |
42,948 |
13,792 |
14,130 |
14,676 |
14,548 |
13,075 |
11,842 |
34,558 |
39,411 |
45,783 |
|
PAPER AND PAPER BOARD |
Production |
Imports |
Exports |
Consumption | ||||||||
|
Sub-region |
1994 |
2002 |
2010 |
1994 |
2002 |
2010 |
1994 |
2002 |
2010 |
1994 |
2002 |
2010 |
|
AIEs |
31,619 |
40,116 |
47,179 |
2,611 |
1,034 |
693 |
1,622 |
2,651 |
2,943 |
32,608 |
38,499 |
44,929 |
|
NIEs |
6,725 |
6,941 |
8,358 |
4,531 |
4,746 |
5,878 |
3,137 |
1,788 |
453 |
8,119 |
9,899 |
13,783 |
|
North Asia |
26,983 |
35,574 |
46,490 |
4,058 |
3,940 |
1,416 |
1,158 |
1,364 |
1,709 |
29,883 |
38,151 |
46,197 |
|
South Asia |
3,233 |
3,902 |
4,968 |
634 |
643 |
472 |
25 |
53 |
30 |
3,842 |
4,491 |
5,410 |
|
Southeast Asia |
5,953 |
6,466 |
9,037 |
2,082 |
2,518 |
1,843 |
973 |
1,071 |
1,383 |
7,062 |
7,913 |
9,497 |
|
Pacific Islands |
0 |
0 |
0 |
33 |
37 |
36 |
0 |
0 |
0 |
33 |
37 |
36 |
|
Total |
74,513 |
93,000 |
116,032 |
13,949 |
12,918 |
10,338 |
6,915 |
6,928 |
6,518 |
81,547 |
98,990 |
119,852 |
Outlook for industrial roundwood (downturn scenario)
The overall impact of the Asian economic downturn on wood markets is most apparent in its effects on industrial roundwood consumption in the region. In the period 1996-2010, the APFPM estimates that cumulative102 industrial roundwood consumption will be almost 250 million cubic metres (4.3 percent) lower than estimated under previous economic conditions. Cumulative production of industrial roundwood in the region is estimated to fall by a similar magnitude (220 million cubic metres) with a decline in imports from outside the region accounting for most of the difference. Total volumes of industrial roundwood exported by countries in the region are expected to be largely unaffected and, in fact, are likely to increase marginally in the downturn scenario (Table 10.11).
102 Cumulative being the sum of all annual reductions (or increases) between 1995 and 2010.
Under the downturn scenario, the APFPM predicts that the Republic of Korea and the People's Republic of China will import significantly greater log volumes to 2010 than would otherwise have been expected. Japan's log import volume is predicted to decline commensurately. A rationale for this is that under the downturn scenario, total demand and prices for both logs and processed products will decline. If the price of processed products in Japan falls sufficiently, higher-cost Japanese mills may be unable to compete with processors in lower-cost economies such as Southeast Asia. Thus, imports of industrial logs will likely decline while imports of processed products may rise relative to expectations prior to the economic downturn.
Outlook for sawnwood (downturn scenario)
Associated with a lower rate of consumption growth in industrial roundwood under the downturn scenario is, naturally, a decline in the rate of production of processed products. In the period 1996-2010, the APFPM predicts that production of sawnwood will cumulatively total approximately 63 million cubic metres (3.9 percent) less than the volume expected prior to the economic downturn. In addition, imports of sawn timber by countries in the region are predicted to be cumulatively 14 million cubic metres lower than previously expected. Exports are expected to decrease cumulatively by around 9 million cubic metres. Total consumption of sawnwood in the Asia-Pacific region between 1996 and 2010 is, therefore, expected to total almost 68 million cubic metres less than previously anticipated.
Both the NIEs and the North Asian sub-region are predicted to have higher cumulative production under the downturn scenario than under earlier estimates. Import substitution in both sub-regions, however, is forecast to be sufficiently strong to more than offset this growth. Imports of sawnwood into Japan are forecast to be higher in most years under the downturn scenario, reflecting relatively cheaper prices for processed products arising from exchange rate depreciation. Exports of sawn timber from Southeast Asia are expected to be 42 percent higher by 2010 under the downturn scenario. This reflects lower demand in strongly affected countries (especially Indonesia, Malaysia and Thailand), exchange rates that favour exporting to less affected countries, and exchange rates that encourage development of sawmilling capacity in some of the smaller countries of Southeast Asia.
Outlook for wood-based panels (downturn scenario)
The trends for wood-based panels under the downturn scenario are similar to those for sawnwood. In the period 1996-2010, the APFPM predicts that total cumulative production of wood-based panels will be 63 million cubic metres (an average of 4.2 million cubic metres per annum) lower than in the base scenario. The cumulative decline in consumption growth, however, is expected to total only 57 million cubic metres as a result of markedly increased volumes of imports, particularly into Japan (and to a lesser extent, China). These two countries, both assumed to be only marginally affected by the downturn, are predicted to take advantage of favourable exchange rates to significantly boost imports of wood panels. Conversely, the NIEs that have undergone exchange rate depreciation are forecast to produce significantly more wood-based panels and import significantly less. Exports to countries outside the region are predicted to be lower.
In terms of specific panel products, the greatest impacts of the downturn are expected to fall on the plywood and veneer sector. Total cumulative plywood production is expected to be 10 percent lower under the downturn scenario relative to the base scenario. As noted above, however, both Japan and the People's Republic of China are expected to import significantly greater volumes of plywood under the lower prices of the downturn scenario. Most of the increased export volume is predicted to come from Indonesia. A very similar pattern is expected for particleboard. An interesting projection of the APFPM relating to particleboard is that under the base scenario, Indonesia and New Zealand are jointly the largest exporters in the region; under the downturn scenario, low-cost Indonesian exports to a large extent squeeze New Zealand out of the market. The total production and import volumes of fibreboard are largely unchanged between the two scenarios. Export volumes of fibreboard are marginally higher under the downturn scenario.
Outlook for fibre-furnish, paper and paperboard (downturn scenario)
Production and consumption of paper and paperboard under the downturn scenario are forecast to be lower than anticipated prior to the downturn in every sub-region except the Pacific Islands, where consumption is projected to be marginally higher in several years. The total cumulative production of paper and paperboard is predicted to be 96 million tonnes lower in the downturn scenario for the period 1996-2010 (an average of 6.4 million tonnes per annum). Total cumulative consumption is expected to be 91 million tonnes (5 percent) lower under the downturn scenario. Higher volumes of imports of paper and paperboard by Japan and, particularly, the People's Republic of China will likely push cumulative imports for the region up by as much as 4 million tonnes under the downturn scenario. Markedly higher export volumes predicted from Southeast Asia and the Advanced Industrial Economies (under the downturn scenario) offset lower export volumes from North Asia and the NIEs, resulting in roughly equal volumes of exports under the two scenarios.
Production of all types of fibre-furnish is expected to be lower under the downturn scenario in every year. Total cumulative trade in wastepaper is forecast to be higher under the downturn scenario but overall consumption is predicted to be lower.
Conclusion
The results of the APFPM modelling show four key forces influencing change in the wood products sector as a result of the economic downturn:
· at the broadest level, the downturn has reduced capacity for consumption in the Asia-Pacific region. This is clearly reflected by anticipated overall reductions in consumption of every product in almost every sub-region (excluding logs in the NIEs and paper and paperboard in the Pacific Islands);· resource-rich countries affected by the downturn have increased incentives to export both as a result of more favourable exchange rates and due to reduced domestic demand. This is particularly evident for Southeast Asian countries;
· resource-poor countries affected by the downturn have incentives to develop domestic processing capacity as a means of avoiding exchange rate costs on processed (value-added) products. Consequently, the APFPM predicts a significant increase in log importing by the NIEs as they attempt to avoid consuming imported processed products; and
· countries less affected by the downturn will have incentives to increase imports of processed products where exchange rates have become more favourable. The model predicts this result for the AIEs in particular, especially for imports of wood-based panels.
Prospective land-use evolution
Outlook for the area of natural forests
Outlook for protected areas
Outlook for the area of plantations
Outlook for trees outside the forest
Potential wood and fibre supply prospects for the region
The outlook for forest resources and land use has been prepared assuming that the trends in land use change experienced in the region in the recent past will continue in the future. These changes have been combined with expectations of future developments of the forest sector in the region (particularly the development of plantations and the extension of the harvesting boundary in natural forest) to give estimated changes in production potential.
Recent trends suggest that land uses in the Asia-Pacific region in 2010 will be distributed in a manner reflected by the figures presented in Table 10.12. The need to produce more food for the region's increasing population will drive continued expansion of the area of arable land, while the high profitability of permanent crops will encourage an expansion in cropping area by about one-third from 1994 levels. Together, these changes will take about 36 million hectares away from other land uses. A large proportion of this expansion in agricultural and permanent crops will take place in North and Southeast Asia.
In contrast, the area of permanent pasture is expected to decline by 48 million hectares, or less than 5 percent. In some countries, this will be driven by conversion of pasture to higher value land uses such as those mentioned above. In others, the loss will result from farmers abandoning pastures due to low profitability, soil erosion or other problems. A large part of the overall change in the region will be experienced in China and Australia. This shift away from permanent pasture also accounts for the quite large increase that is expected in the category of "other land" (Table 10.12).
Table 10.12: Estimated changes in land use in the Asia-Pacific region, 1994-2010
|
Land-use type |
Area in 1994 (million ha) |
Estimated area in 2010 (million ha) |
Change 1994-2010 (million ha) |
Change 1994-2010(%) |
|
Arable land |
404 |
413 |
+9 |
+2.2 |
|
Permanent crops |
51 |
78 |
+27 |
+52.9 |
|
Permanent pasture |
974 |
926 |
-48 |
-4.9 |
|
Forest and other wooded land |
806 |
789 |
-17 |
-2.0 |
|
Other land |
613 |
640 |
+27 |
+4.4 |
Note: the area of permanent crops was found to be slightly higher than reported in FAOSTAT when all the individual components (fruit orchards, coconut, oil palm and rubber plantations) were added together.
In terms of forest and other wooded land, it is expected that past deforestation rates will continue and that about 17 million hectares of forest and other wooded land will be converted to other land uses (mainly arable land and permanent crops) by 2010. It is expected that most of this conversion will take place in Southeast Asia.
The total area of natural forest in the region is expected to decline from 490 million hectares in 1994 to 465 million hectares in 2010, or a decline of 35 million hectares in total. As in the past, some of this will be due to conversion to plantations or other land uses and some will be due to degradation of forests to the point whereby they are classified as "other wooded land." This rate of loss is considerably lower than predicted by the Forest Resources Assessment 1990 (FRA 1990) and reflects a recent slowing in the loss of forests and other wooded land (FOWL).
Within this overall change framework, it is also expected that there will be changes in the area of forest available for supplying commercial timber and in the status of forests with respect to harvesting (Table 10.13). The area of disturbed natural forest is expected to increase as some currently undisturbed areas are harvested, and some currently inaccessible areas are opened up by new roads or more sophisticated harvesting technologies.
In countries that have currently inaccessible forest areas, it is assumed that these will become accessible at a rate of 2 percent per annum, resulting in a decline in the area of inaccessible forest in the region from 135 million hectares in 1994 to 100 million hectares in 2010. For the purpose of estimating potential supply, it is assumed that these areas will enter the undisturbed forest category. In total, therefore, the area of disturbed forest available for timber production is expected to increase from 190 million hectares to 230 million hectares. The area of undisturbed forest available for supplying commercial timber will decline slightly from 40 million hectares to 30 million hectares. Combined with the effects of planned conversion and other unplanned land-use changes, the result is likely to be a slight increase in the area of forest available for wood supply (from about 255 million hectares to about 265 million hectares).
Table 10.13: Estimated changes in area of natural forest in the Asia-Pacific region, 1994-2010
|
Natural forest type |
Area in 1994 (million ha) |
Estimated area in 2010 (million ha) |
Change 1994-2010 (million ha) |
Change 1994-2010 (percent) | |
|
Natural forest available for wood supply |
255 |
265 |
0 |
0 | |
|
|
Disturbed |
190 |
230 |
+40 |
+20 |
|
|
Undisturbed |
40 |
30 |
-10 |
-25 |
|
|
Planned conversion |
25 |
5 |
-20 |
-80 |
|
|
Unplanned conversion |
|
|
-10 |
|
|
Natural forest unavailable for wood supply |
235 |
200 |
-35 |
-15 | |
|
|
Inaccessible areas |
135 |
100 |
-35 |
-25 |
|
|
Legally protected areas |
100 |
100 |
0 |
0 |
|
Total natural forest |
490 |
465 |
-35 |
-7 | |
There is considerable pressure on countries in the region to increase the amount of forest area under legally protected status. These pressures, of course, must be weighed alongside the increased demands for forest products and the need for socio-economic development. Nonetheless, there is scope in many countries for increasing these areas, and it is likely that the extent of protected areas will increase modestly by the year 2010. This will only occur, however, as a result of conscious efforts by forestry and environmental policy-makers. Therefore, it makes little sense to make deterministic projections about the likely future extent of such areas. Questions particularly remain as to whether new protected areas will be strictly protected or in less stringent conservation categories. The policy options and institutional aspects of protected area designation and management, and how these might change in the future, are considered in following sections dealing with alternative scenarios for the future.
For purposes of classifying future natural forest areas, it has been assumed, as a base-case scenario, that the area of forest in legally protected areas will remain constant at about 100 million hectares. Under this assumption, coupled with the expectation that timber harvesting will expand to new areas as a result of new technologies, the total area of natural forest unavailable for timber harvesting is expected to decline from 235 million hectares to about 200 million hectares.
During the course of the APFSOS, estimates of current plantation establishment rates were obtained for all countries in the region. Assuming that establishment continues at these rates throughout the period to 2010, the area of industrial forest plantations is expected to increase from 40 million hectares (in 1994) to about 64 million hectares in 2010 (Table 10.14). Most of this increase is likely to be in fast-growing short-rotation plantations, intended for use as pulpwood. The majority of the plantations will be established in South and Southeast Asia, with substantial increases also in North Asia.
Table 10.14: Estimated changes in plantations in the Asia-Pacific region, 1994-2010
|
Region |
Current annual planting rate (million ha) |
Ind. plantation area in 1994 (million ha) |
Ind. plantation area in 2010 (million ha) |
Total change (million ha) |
Total change (%) |
|
AIEs |
0.1 |
11 |
12 |
1.0 |
10 |
|
NIEs |
0.0 |
3 |
3 |
0.0 |
0 |
|
North Asia |
0.5 |
14 |
22 |
7.5 |
50 |
|
Southeast Asia |
0.4 |
7 |
13 |
5.9 |
85 |
|
South Asia |
0.6 |
7 |
15 |
8.4 |
120 |
|
Pacific Islands |
0.0 |
0 |
0 |
0.0 |
0 |
|
Asia-Pacific |
1.5 |
42 |
64 |
21 |
50 |
Based on the overall analysis of land-use change and forest change, the area of "other wooded land" in the region is projected to decline from about 270 million hectares to 260 million hectares. The situation is, however, more complicated than this simple net change implies. Some "other wooded land" is likely to revert to natural forest or be converted to plantations, while other areas may be converted to other land uses.
Considering the three agricultural land categories shown in Table 10.12, it can be seen that the area of agricultural land in the region is, on balance, expected to decline (largely due to losses of permanent pasture in China and Australia). However, arable land and permanent crop areas are expected to increase such that the composition of the agricultural land base is likely to shift toward more productive land and land containing (or with the potential to contain) more trees. This is particularly so in the case of permanent crops (i.e. agricultural tree crops). The area of agricultural tree crops is expected to increase by 15 million hectares to about 60 million hectares by 2010. More importantly, however, due to the age structure of these crops, the area requiring replacement each year is expected to increase by 50 percent from 2 million hectares to 3 million hectares. At an estimated average standing volume of 200 cubic metres per hectare at replacement, this will have a dramatic impact on the potential of such crops to produce utilisable timber and fibre.
The maximum potential annual supply of logs and fibre from various sources in each of the Asia-Pacific sub-regions has been calculated for the year 2010 (Figures 10.1 to 10.4). These projections have been based on the land-use changes that are expected (as presented above), but have not taken into account any changes in harvesting intensities or increment that might occur in the future.
The main change expected in the supply potential of the natural forest is a slight increase, from 340 million cubic metres per year in 1994 to 360 million cubic metres in 2010, as the area of forest available for wood supply expands. Overall supply potential per hectare will decline slightly as harvesting moves progressively from undisturbed to disturbed forest, but this effect will be offset by the increase in areas available for harvesting.
Most of the increase in production potential is expected to come from North Asia (where an increase of 20 million cubic metres per year is expected over current levels) and the Pacific Islands (where parts of the relatively large currently inaccessible areas of forest will likely be brought into production). In contrast, total annual production potential of the Southeast Asian countries is expected to decline by 10 million cubic metres per year. This decline is expected because most of the Southeast Asian countries will be increasingly moving timber harvesting operations into secondary forests (where harvesting volumes will be less) in the years leading up to 2010. It is assumed that timber production from conversion forests in Malaysia and Indonesia will last for 20 years (or until just beyond 2010). If, however, there is a more rapid conversion of forest in these two countries, supply potential in Southeast Asia could decline even more than currently projected.
The potential of plantations in the region will increase dramatically as current plantations mature and the area of fast-growing short-rotation crops continues to increase. Potential sawlog supply from plantations will increase from 90 million cubic metres per year to 150 million cubic metres per year, mostly in Japan, China and New Zealand. However, other demands on forests in these developed countries might prevent much of this potential from being realised.
Potential supply of pulpwood from plantations will increase dramatically across the region, from 130 million cubic metres per year to 270 million cubic metres per year. Growth will be particularly concentrated in South and Southeast Asia, as many of the large areas of plantations previously established start to mature.
The potential annual supply of wood from trees outside the forest will also increase, by about 125 million cubic metres, bringing the total annual potential supply from trees outside forests to just over 1 billion cubic metres per year (Figure 10.3). This increase will almost totally be attributable to the agricultural tree crops sector and, as such, will mostly occur in North and Southeast Asia. While specific utilisation of these agricultural tree crops by forest industries is difficult to predict, it is expected that more research and development (such as has already taken place in Malaysia) will lead to increasing use of these materials in the coming years.
The potential availability of wood and fibre from secondary sources will perhaps increase more than other available sources of supply, from 1 billion cubic metres equivalent per year in 1994 to 1.25 billion cubic metres equivalent in 2010 (Figure 10.4). In wood raw material equivalent terms, the potential availability of recycled fibre will increase from 140 million cubic metres equivalent in 1994 to 230 million cubic metres equivalent by 2010. Most of the absolute increase will occur in the AIEs and NIEs, and in North Asia, but the increases elsewhere will be no less dramatic in percentage terms.
Harvesting residues are expected to increase from a current level of 720 million cubic metres equivalent to 850 million cubic metres equivalent in 2010, assuming no significant improvements in harvesting practices. Wood processing residues are expected to increase from 90 million cubic metres equivalent to 110 million cubic metres equivalent. Non-wood fibre supply potential is not expected to increase significantly due to economic and environmental constraints.
|
Box 10.6: INCREMENTAL SOURCES OF WOOD SUPPLY - THE VIEW FROM ITTO "Incremental sources of supply" are those sources that are not currently producing a significant volume of logs, but could potentially do so if economic conditions become more favourable. The main incremental sources for the Asia-Pacific region are: (a) improved utilisation, including greater use of residues and currently non-commercialised species; (b) new harvesting technologies allowing environmentally benign harvest from steep and environmentally sensitive sites; and (c) greater use of conifer logs from Russia's Far East, Australia, New Zealand and Chile. Each of these sources offer potential, but wood from each is likely to come only at higher cost than current sources. Improved Utilisation: Considerable potential exists for increasing the wood supply in the Asia-Pacific region through better utilisation of forest residues and commercially less-accepted species. Currently, almost 50 percent of the volume in felled trees is left in the forest, and only about 26 percent of the standing volume in harvest areas is felled. ITTO estimates that a 25 to 50 percent increase in extraction volumes is physically possible across the region. Much of this additional supply is unsuitable for manufacturing traditional solid-wood products such as sawnwood and plywood, but could be used for making reconstituted wood or fibre products. The incremental cost of using these resources, however, could be as much as 50 percent higher than for wood currently being used. By improving utilisation practices, an incremental supply of sawlogs and veneer logs 25 percent greater than at present could be achieved by 2010, but at a delivered wood cost for the incremental supply of about 25 percent above the cost of current sawlog and veneer log deliveries. It is anticipated that the incremental sawlog and veneer log supply will gradually become available and will be fully exploited by 2010. Incremental supply of fibre logs (for the manufacturing of reconstituted wood and fibre products) equivalent to 25 percent of the current supply could be developed, but at an estimated incremental cost of 50 percent. Low-Impact Harvesting Technology: New harvesting technologies, including aerial (helicopter and various skyline cable systems) and high-flotation/low-ground-pressure systems, allow the removal of timber from steep and environmentally sensitive sites that until now have been excluded from commercial timber production. Indonesia, Malaysia, and Papua New Guinea, in particular, have significant areas of forest on sensitive sites that would be suitable for application of these new technologies. ITTO has estimated that Indonesia and Papua New Guinea could each sustain a theoretical harvest of 20 million cubic metres per year from these sensitive areas. More achievable potential incremental supplies of sawlogs and veneer logs are estimated at about 5 million cubic metres per year for Indonesia and Papua New Guinea, and 2.5 million cubic metres for Malaysia. These incremental supplies would come at an average harvesting cost 50 percent above the cost of current log sources. These levels are forecast to become available gradually and to be fully developed by 2010. Conifer Logs: Russia: Traditionally, the flow of logs from Russia has been primarily to Japan (averaging 4.6 million cubic metres for all grades of logs between 1991 and 1994), with small volumes going to the Republic of Korea. Both markets are increasing the use of Russian logs for manufacturing plywood. ITTO estimates that the supply of conifer sawlogs and veneer logs from Russia will increase from 1.0 million cubic metres in 1995 to 5.0 million cubic metres in 2010. Australia, New Zealand and Chile: In recent years, conifer logs to substitute for tropical timber have increasingly been supplied from New Zealand, Chile, and, to a lesser extent, Australia. This supply is expected to increase steadily through 2010. ITTO estimates that the incremental supply of conifer logs from New Zealand, Chile and Australia available for export to the rest of Asia and the Pacific will rise from 1.75 million cubic metres in 1995 to 7.0 million cubic metres in 2010. Source: Abbreviated from Document APFSOS/WP/20: Forest Industry Structure and the Evolution of Trade Flows in the Asia-Pacific Region - Scenarios to 2010. ITTO, Yokohama. |
The extent to which the potential of all these categories is realised will depend very much on the forestry, industrial, environmental and recycling policies pursued by countries in the region. For example, so long as incentives for high-grading practices remain, there will be little incentive to intensify collection and use of forest residues.
Of crucial importance in evaluating the future of forestry in the Asia-Pacific region is assessing the adequacy of wood and fibre supplies to meet demands for physical wood products. The estimated supply and demand situation for wood and fibre in each of the Asia-Pacific sub-regions for the year 2010 is shown in Figures 10.5 to 10.11 and Table 10.15, which are based on the figures presented in Section 4.
Figures 10.5 to 10.11 compare the estimates of the maximum potential annual supply of wood and fibre against the projected levels of production in the year 2010. The figures reflect the potential of the region overall, and each of the sub-regions individually, to supply sawlogs and other fibre products (e.g. pulpwood, residues, recycled fibre and non-wood fibre) from the following seven sources:
· Natural forests (NF)
· Plantations (PL)
· Other wooded land (OWL)
· Trees outside forests (TOF)
· Harvesting residues (HRE)
· Recycled and non-wood fibre sources (RNW)
· Wood processing residues (WPR)
Each figure also shows the estimated levels of production of sawlogs, pulpwood, fuelwood and recycled and non-wood fibre that will be achieved in the region and each sub-region in the year 2010 (represented by horizontal lines at the estimated levels of production).
Table 10.15: Potential wood and fibre availability and estimated production in the Asia-Pacific region in 2010
|
Region |
Potential sawlog availability (million m3) |
Sawlog production/ utilisation |
RNW Availability |
RNW production/ utilisation |
||||||
|
NF |
PL |
OWL |
TOF |
Total |
(million m3/%) |
(million m3 EQ) |
(million m3 EQ/%) |
|||
|
AIEs |
17.5 |
71.9 |
1.3 |
3.8 |
94.4 |
47.3 |
50% |
84.9 |
31.5 |
37% |
|
NIEs |
3.7 |
9.0 |
0.0 |
0.3 |
13.0 |
2.6 |
20% |
37.1 |
6.2 |
17% |
|
North Asia |
157.2 |
58.8 |
3.8 |
84.7 |
304.5 |
70.6 |
23% |
117.1 |
46.0 |
39% |
|
Southeast Asia |
45.8 |
7.3 |
3.1 |
32.8 |
88.9 |
84.5 |
95% |
21.4 |
3.8 |
18% |
|
South Asia |
10.9 |
1.5 |
1.5 |
34.2 |
48.0 |
21.9 |
46% |
14.8 |
2.8 |
19% |
|
Pacific Islands |
7.5 |
0.0 |
0.1 |
0.5 |
8.1 |
6.2 |
77% |
0.0 |
0.0 |
N/A |
|
All Asia-Pacific |
242.5 |
148.4 |
9.8 |
156.2 |
556.9 |
233.0 |
42% |
275.3 |
90.3 |
33% |
|
Region |
Potential pulpwood and fuelwood availability (million m3 EQ) |
Pulp/fuel production/ utilisation |
||||||
|
NF |
PL |
OWL |
TOF |
HRE |
WPR |
Total |
(million m3 EQ/%) |
|
|
AIEs |
1.5 |
28.7 |
5.1 |
16.0 |
37.1 |
18.9 |
107.2 |
49.8 46% |
|
NIEs |
0.2 |
4.5 |
0.1 |
1.9 |
5.0 |
1.3 |
13.0 |
8.7 67% |
|
North Asia |
1.1 |
142.0 |
15.2 |
410.5 |
192.8 |
35.4 |
797.0 |
426.7 54% |
|
Southeast Asia |
113.0 |
73.4 |
12.5 |
204.2 |
438.3 |
42.9 |
884.3 |
463.9 52% |
|
South Asia |
0.0 |
107.8 |
5.9 |
161.1 |
168.3 |
11.6 |
454.6 |
527.5 116% |
|
Pacific Islands |
0.0 |
0.8 |
0.3 |
2.1 |
10.8 |
3.7 |
17.8 |
6.1 34% |
|
All Asia-Pacific |
115.7 |
357.2 |
39.1 |
795.8 |
852.2 |
113.7 |
2,273.8 |
1,482.7 65% |
Note: percentage figures are production as a percentage of potential availability.
The clear message emerging from analysis of the modelling results (Figures 10.5-10.11 and Table 10.15) is that potentially there will easily be sufficient fibre available in the Asia-Pacific region overall to meet demand in 2010. It must be stressed, however, that the supply figures presented above are estimates of potential supply. It is virtually certain that the full extent of the potential supplies will not be obtainable in many countries due to technological and economic hurdles. To achieve significant portions of this supply potential in non-traditional areas, it will be necessary to improve utilisation of residues from processing and harvesting and significantly develop collection and utilisation of recovered material (mainly wastepaper) in many countries. Such developments will require substantial capacity building efforts by a number of countries in the region, and will likely increase the overall cost of wood and fibre.
In addition, a number of factors of uncertainty may undermine the conclusion that potential supplies of wood and fibre will be adequate:
· considerable uncertainty exists about the sustainability of the harvesting intensities currently used in the region. There is a high probability that in the future effective wood harvests will be markedly lower than those used in compiling the supply estimates for this study;· significant uncertainty persists over the extent of plantation resources. Much of this doubt stems from data compilation methods that often fail to account for mortality rates or are incomplete with regard to age profiles and intended management regimes. Consequently, both plantation areas and stocking ratios may be significantly lower than official statistics indicate for a number of countries in the region;
· accurate statistics on trees outside forests are almost non-existent. Since these resources play a crucial role in meeting the proportionately dominant woodfuel needs, there remains scope for major errors in estimating the ability of non-forest lands to satisfy demands.
Despite these caveats regarding the assumptions underpinning the potential supply of wood and fibre, countries in Asia and the Pacific can generally be encouraged by the analysis that suggests that the means to alleviate potential wood shortages exist in the member countries. There is, however, a need to ensure that appropriate measures are implemented quickly and successfully, particularly in those countries with projected supply shortages from traditional sources.
The situation is highly variable across the region and adaptive measures will be markedly different across countries. It is anticipated that log production will approach the limits of sustainable potential in Southeast Asia and that general fibre scarcity will continue in South Asia. The analysis indicates that South Asia is likely to consume 13 percent more than it can sustainably supply (Table 10.15), but much of the wood needs in South Asia are for fuelwood, which can often be supplied by using non-stem wood. However, even taking this into account, it seems evident that South Asia will be hard pressed to meet future wood requirements.
While South Asia will remain under severe pressure, other sub-regions (especially the more developed sub-regions) will enjoy a relative abundance of wood and fibre. Most countries will only have to access about 50-60 percent of wood and fibre supplies that are potentially available, although this varies by wood type and sub-region. For example, Southeast Asia will need to utilise close to 100 percent of its available large-dimension logs to meet forecast sawnwood and plywood production levels based on the very large capacities currently installed in Indonesia and Malaysia.
![]()
![]()
![]()
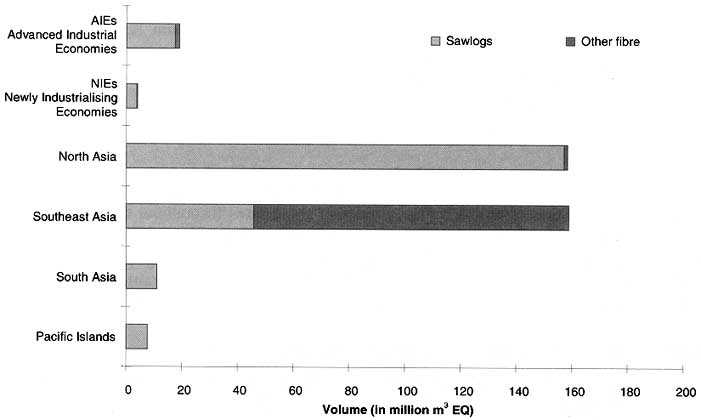
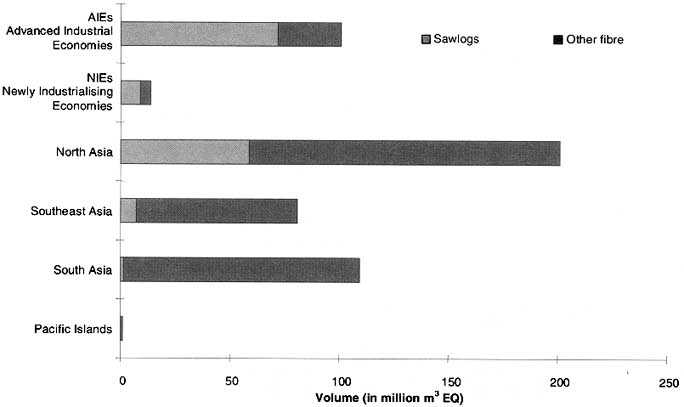
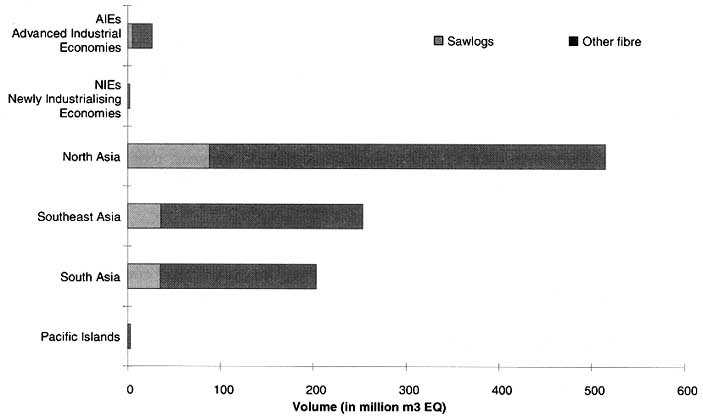
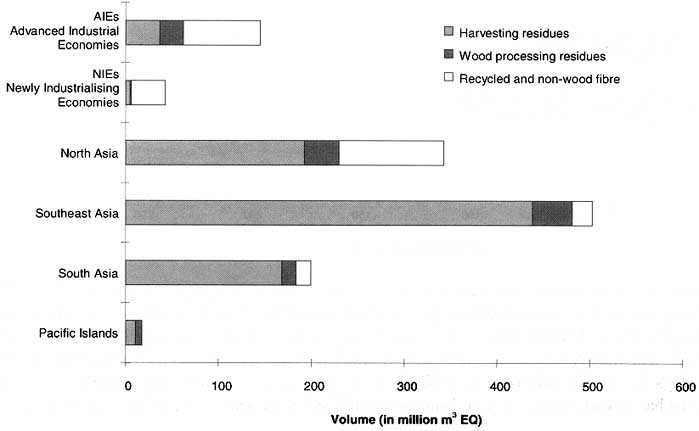
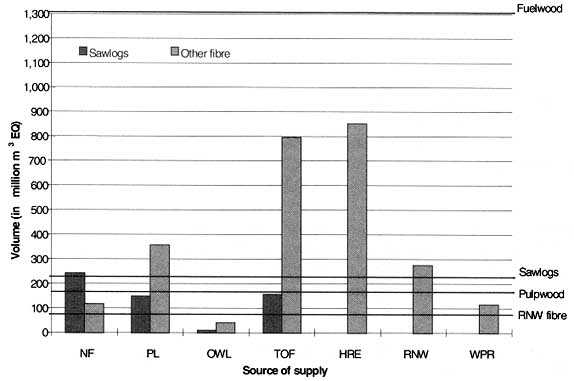
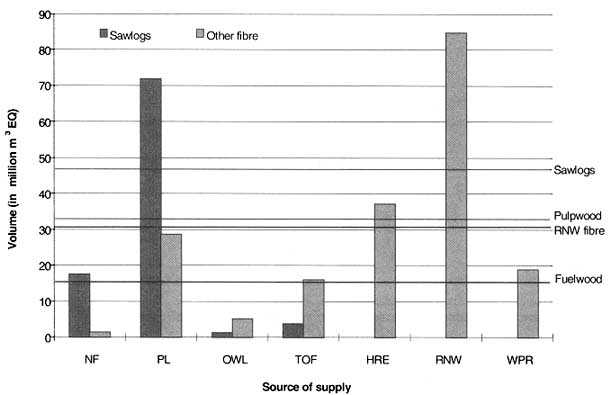
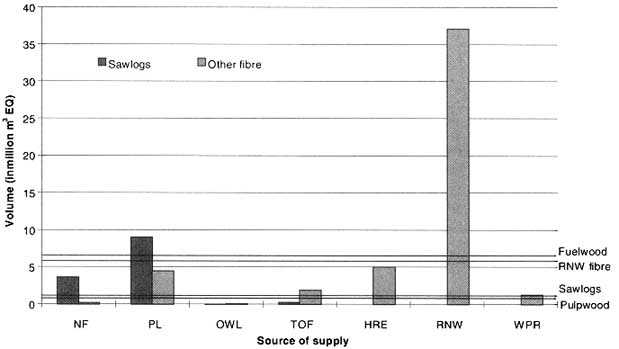
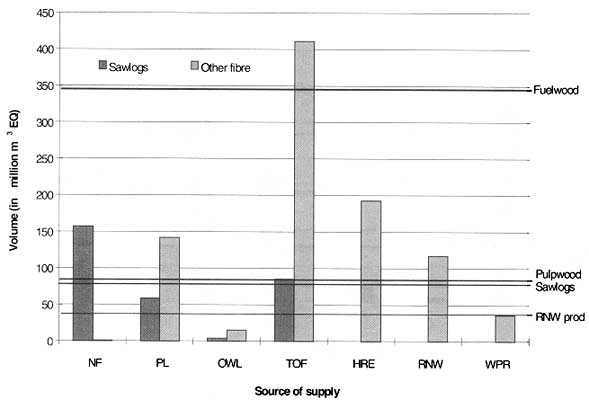
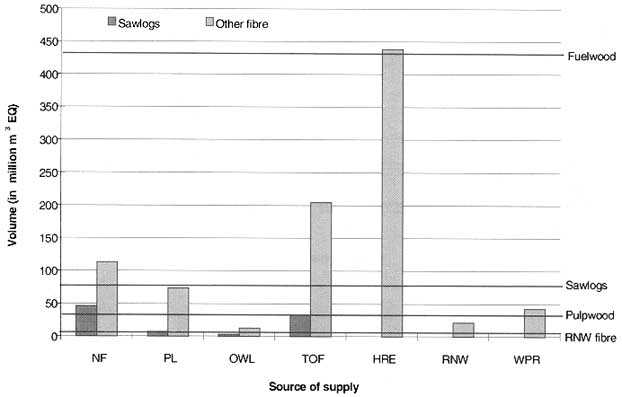
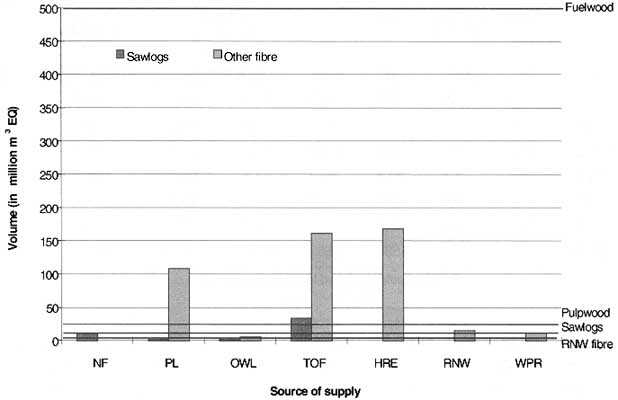
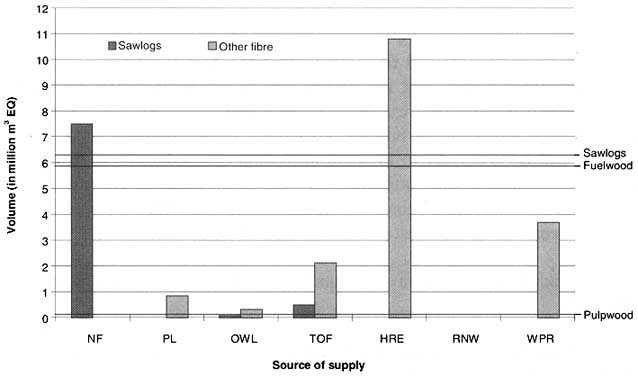