![]()
![]()
![]()
1.1 China
Fishing fleet and fishing technology in East China Sea
|
Category of fishing vessels |
No. |
|
|
Powered fishing vessels |
114 010 |
|
|
Steel fishing vessels |
|
|
|
|
>600 HP |
502 |
|
|
<600 HP |
9 985 |
|
|
Sub-total |
10 487 |
|
Wooden fishing vessels |
|
|
|
|
>15 HP |
38 401 |
|
|
<15 HP |
65 122 |
|
|
Sub-total |
103 523 |
|
Unpowered fishing vessels |
200 000 |
|
|
TOTAL |
314 010 |
|
|
Type of fishing technology used |
East China Sea |
|
|
% of volume of total catch |
|
Trawling |
54 |
|
Set net fishing |
25 |
|
Gillnetting |
7 |
|
Purse seining |
6 |
|
Longline and hand |
|
|
Line fishing |
2 |
|
Others |
6 |
|
Fishing areas |
China |
|
|
% of volume of total |
|
|
marine catch |
|
East China Sea |
85 |
|
Yellow and Bohai Sea |
8 |
|
South China Sea |
1 |
|
Others (deep sea and distant waters) |
5 |
Fisheries legislation and regulations
The following management measures and regulations are in place:
- An increasing number of fishing vessels are controlled through licence systems;Techno-economic and operational characteristics of individual fishing units- fishing areas are delineated; fishing vessels operating in these areas are controlled;
- closed areas and closed seasons (01/07 to 31/08) have been established;
- MSY and MEY have been established for important species, i.e. yellow croaker, little yellow croaker, long hairtail, triggerfish, etc.
|
Type of vessel |
Length (m) |
GRT |
H.P |
On board storage facilities |
Fishing gear |
Owner-ship |
|
Purse seiner |
42.4 |
80 |
600 |
Ice + Fishhold 137 m3 |
1 purse seine |
State-Owned Company |
|
Purse seiner |
27.8 |
37,6 |
279 |
12,4 m3 |
1 purse seine |
State- Owned Company |
|
Bottom-pair trawler |
38.3 |
235 |
367 |
156 m3 |
3 trawl nets |
State-owned Company |
|
Bottom-pair trawler |
25-28 |
80-95 |
183 |
24 m3 |
Bottom pair trawls |
Share-owned by crew |
|
Single trawler |
15-16 |
65 |
150 |
24 m3 |
Single trawl |
Share-owned by crew |
|
Jigger |
44.8 |
270/304 |
551/735 |
Freezing 190 m3 + 10t/day |
12 jigging machines |
State-owned company |
|
Set netter |
29.5 |
67 |
147 |
Ice + Fishhold 26 m3 |
Set net 100 pieces |
Share-owned |
|
Stow netter |
30.5 |
107 |
198 |
37 tonnes |
Stow net |
Share-owned |
|
Stow netter |
27 |
115 |
183 |
90 tonnes |
Stow net |
Share-owned |
|
Type of vessel |
Fishing days |
Average duration of fishing trips |
Fishing seasons (off-seasons) |
|
Purse seiner |
246 |
30 days / trip |
Jan-Feb and Jul-Dec |
|
Bottom pair-trawler |
300 |
15/20 days / trip |
Jan-Jun and Sep-Dec |
|
Bottom pair-trawler |
305 |
15 days / trip |
" |
|
Single trawler |
|
|
All year long |
|
Jigger |
220 |
220 days |
Jun-Dec |
|
Set netter |
300 |
1/12 days / trip |
Jan-Jun and Sep-Dec |
|
Set netter |
202 |
1/9 days / trip |
Jan-Jun and Sep-Dec |
|
Stow netter |
300 |
11/12 days / trip |
Jan-Jun and Sep-Dec |
|
Stow netter |
160 |
7/9 days / trip |
Jan-Jun and Sep-Dec |
|
Type of vessel |
Purse seiner |
Bottom-pair trawler |
Bottom-pair trawler |
Single trawler |
|
|
Total Earnings |
1 146 970 |
371 340 |
182 130 |
54 480 |
|
|
Running costs |
|
|
|
|
|
|
|
Fuel |
93 210 |
98 880 |
37 050 |
11 760 |
|
|
Lubricant |
|
|
|
|
|
|
Harbour dues |
7 390 |
|
140 |
50 |
|
|
Ice / salt |
|
|
5 220 |
|
|
Total running costs |
100 600 |
98 880 |
42 410 |
11 810 |
|
|
Labour charges |
|
|
|
|
|
|
|
Labour share, wages |
117 030 |
46 140 |
99 030 |
27 200(1) |
|
Total labour charges |
117 030 |
46 140 |
99 030 |
27 200 |
|
|
Vessel costs |
|
|
|
|
|
|
|
Gear expenses |
55 410 |
38 150 |
2 490 |
1 040 |
|
|
Repairs and maintenance |
119 200 |
39 440 |
2 420 |
1 160 |
|
|
Vessel insurance |
|
|
4 830 |
840 |
|
|
General expenses |
20 830 |
41 260 |
11 450 |
6 260 |
|
Total vessel costs |
195 440 |
118 850 |
21 190 |
9 300 |
|
|
Total costs / expenses |
413 070 |
263 870 |
162 630 |
48 310 |
|
|
Gross cash flow |
733 900 |
107 470 |
19 500 |
6 170 |
|
|
|
Depreciation (1) |
224 000 |
32 500 |
18 800 |
3 500 |
|
|
Interest (2) |
98 600 |
14 300 |
8 300 |
1 500 |
|
Net cash flow |
411 300 |
60 670 |
-7 600 |
1 170 |
|
|
Type of vessel |
Jigger |
Set netter |
Stow netter |
|
|
Total Earnings |
1 092 780 |
155 170 |
100 020 |
|
|
Running costs |
|
|
|
|
|
|
Fuel |
240 730 |
16 570 |
11 500 |
|
|
Lubricant |
|
|
|
|
|
Harbour dues |
3 840 |
2 410 |
2 410 |
|
|
Ice / salt |
|
7 370 |
7 530 |
|
Total running costs |
244 570 |
26 350 |
21 440 |
|
|
Labour charges |
|
|
|
|
|
|
Labour share, wages |
79 330 |
49 500 |
53 860 |
|
Total labour charges |
79 330 |
49 500 |
53 860 |
|
|
Vessel costs |
Jigger |
Set netter |
Stow netter |
|
|
|
Gear expenses |
60 840 |
29 030 |
18 870 |
|
|
Repairs and maintenance |
38 320 |
4 990 |
7 420 |
|
|
General expenses |
101 180 |
7 290 |
7 050 |
|
Total vessel costs |
200 340 |
41 310 |
33 340 |
|
|
Total costs / expenses |
524 240 |
117 160 |
108 640 |
|
|
Gross cash flow |
568 540 |
38 010 |
-8 620 |
|
|
|
Depreciation |
256 000 (1) |
3 300 (1) |
7 000 (1) |
|
|
Interest |
112 600 (2) |
1 300 (2) |
3 100 (2) |
|
Net cash flow |
199 940 |
33 410 |
-18 720 |
|
1.2 Taiwan Province of China
Taiwan operates two types of tuna fishing vessels, i.e. longliners and purse seiners. The Taiwan study covers the fleet of Taiwanese purse seiners; 42 vessels operating in Papua New Guinea and in Micronesian waters.
Financial and economic characteristics of individual fishing units (in US$)
|
Type of vessel |
Purse seiner (1000 GRT) |
|
Total Earnings |
3 859 880 |
|
Running costs |
|
|
Fuel |
562 500 |
|
Harbour dues |
93 750 |
|
Ice / salt |
37 500 |
|
Food |
187 500 |
|
Other running costs |
168 750 |
|
Total running costs |
1 050 000 |
|
Labour charges |
|
|
Labour share, wages |
506 250 |
|
Social insurance |
37 500 |
|
Total labour charges |
543 750 |
|
Vessels costs |
|
|
Gear expenses |
187 500 |
|
Repairs and maintenance |
375 000 |
|
Vessel insurance |
75 000 |
|
General expenses |
487 500 |
|
Total vessel costs |
1 125 000 |
|
Total costs / expenses |
2 718 750 |
|
Gross cash flow |
1 141 130 |
|
Depreciation |
380 000 |
|
Interest |
182 500 |
|
Net cash flow |
578 630 |
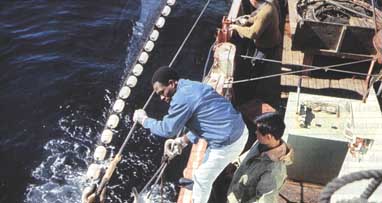
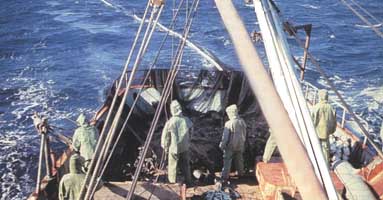
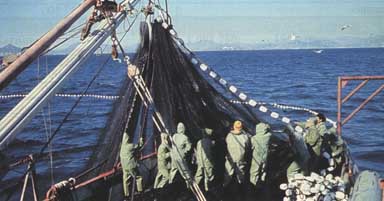
1.3 Republic of Korea
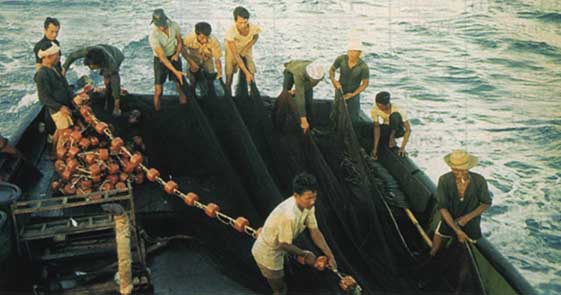
Purse seiners at fisheries training center, Republic of Korea
Purse seiners at fisheries training center, Republic of Korea
Purse seiners at fisheries training center, Republic of Korea
Fishing fleet
|
Type of fishing |
Number of vessels |
Main Species |
|
|
Main |
Auxiliary |
||
|
Offshore stow netting |
806 |
- |
Hairtail, corvine |
|
Offshore jigging |
827 |
- |
Squid |
|
Large purse seining |
48 |
279 |
Mackerel, jack mackerel |
|
Anchovy mid-water trawling |
110 |
578 |
Anchovy |
|
Large bottom/ mid-water trawling |
99 |
- |
Squid, hairtail |
|
Large bottom/mid-water pair trawling |
384 |
- |
Corvine, croaker |
|
Danish seining |
186 |
|
Corvine, croaker Flounder, sea eel Alaska pollack |
|
Eastern Sea Bottom trawling |
40 |
|
Alaska pollack, Shrimps |
|
|
|
|
|
|
TOTAL = 3 357 |
2 500 |
857 |
|
- Offshore stow netting: Yellow Sea and East China Sea,Age structure of fleet- coastal stow netting: near the shore of Yellow Sea,
- offshore jigging: mainly East Sea, partially Yellow Sea in about 400 n mi (nautical miles) from harbour,
- large purse-seining: all along the coast, from coastal waters to 300 n mi from shore, including East China Sea,
- anchovy mid-water trawling: from coastal waters up to 100 n mi from shore,
- large bottom/midwater trawling: around Cheju Island (Southern Sea) and East China Sea. within 200 n mi from shore,
- large bottom/midwater pair trawling: same area as above additional areas in Yellow Sea and East China Sea, fishing distance up to 400 n mi from shore,
- Danish seining: large vessels operate around Cheju Island, middle and south of East China Sea less than 250 n mi from harbour; middle size vessels operate in southern part of Yellow Sea, western part of Southern Sea less than 100 n mi from harbour and coastal part of Eastern Sea,
- Eastern Sea bottom trawling: coastal part of Eastern Sea less than 50 n mi from harbour.
|
Type of fishing |
Number of vessels |
Age (in years) |
||||
|
|
Total |
<5 years |
6-10 |
11-15 |
16-20 |
21 and over |
|
Offshore stow netting |
806 |
68 |
206 |
209 |
282 |
41 |
|
Offshore jigging |
827 |
275 |
209 |
145 |
133 |
65 |
|
Large purse seining |
327 |
43 |
57 |
40 |
48 |
139 |
|
Anchovy midwater trawling |
688 |
111 |
290 |
88 |
97 |
102 |
|
Large bottom/midwater single trawling |
99 |
58 |
7 |
10 |
|
24 |
|
Large bottom/midwater pair trawling |
384 |
81 |
38 |
42 |
26 |
197 |
|
Danish seining |
186 |
31 |
29 |
23 |
5 |
98 |
|
Eastern Sea bottom trawling |
40 |
2 |
7 |
9 |
|
22 |
|
Total |
3 357 |
669 |
843 |
566 |
591 |
688 |
There is little potential for development of new fishing areas, in coastal areas or offshore. Almost all types of fishing gears, equipment and fishing vessels have been operated in the Republic of Korea since the 1970s. Almost all existing resources are fully exploited.
The Korean Ministry of Maritime and Fisheries Affairs, through the Law of Fisheries Industry, controls the fishing effort. Recently, the Ministry has stopped issuing new fishing licences and has also forbidden the replacement of old vessels by larger ones in order to conserve the fishery resources.
Techno-economic and operational characteristics of individual fishing units
|
Type of vessels |
GRT average |
KW Average |
On board facilities/processing and storage |
Fishing gear |
Crew |
Sharing system |
|
Offshore stow netting |
84.3 |
276 |
|
3 sets of nets |
9 |
Minimum wages + share |
|
Offshore jigging |
52 |
248 |
Freezer storage = 100 m3 +28 t/day |
300-900 hooks |
13 |
" |
|
Large purse seining |
133 |
664 |
255 m3 |
Seine 900-1000 m X200-300 m |
80 |
Fixed wages + share |
|
Anchovy mid-water trawling |
33,6 |
262 |
|
Trawl 700 m |
56 |
Fixed wages |
|
Large bottom/mid-water trawling |
135 |
814 |
172 m3 + 50 t/day |
Trawl HR 34-48 m |
15 |
Fixed wages + share |
|
Large bottom/mid-water pair-trawling |
106 |
448 |
130 m3 + 22 t/day |
Trawl HR 54-114 m |
22 |
" |
|
Large Danish seining |
130 |
284 |
190 m3 |
Seine HR 50-104 m |
8 |
Minimum wages + share |
|
W-South Sea Middle Danish seining |
100 |
" |
130 m3 |
" |
9 |
" |
|
Eastern Sea Middle Danish seining |
60 |
" |
80 m3 |
" |
10 |
" |
|
Eastern Sea Trawling |
65 |
321 |
|
Trawl HR 27 - 31 m |
8 |
" |
|
Type of vessel |
Fishing days |
Average duration of fishing trips |
Fishing seasons |
|
Offshore stow netting |
180 |
240 |
All year |
|
Offshore jigging |
150 |
180 |
" |
|
Large purse seining |
240 |
270 |
" |
|
Anchovy mid-water trawling |
180 |
180 |
Jul-Mar (Apr-Jun) |
|
Large bottom/mid-water trawling |
240 |
270 |
All year |
|
Large bottom/mid-water pair-trawling |
240 |
270 |
" |
|
Large Danish seining |
180 |
210 |
" |
|
W-Southern Sea middle Danish seining |
210 |
240 |
" |
|
Eastern Sea middle Danish seining |
180 |
180 |
" |
|
Eastern Sea trawling |
180 |
180 |
" |
Investment costs (in US$)
|
Investments |
Hull (1) |
Engine |
Deck equipment and others |
Fishing gears |
Total value |
|
Depreciation rate |
4 % |
10 % |
10 % |
20 % |
|
|
Type of vessel |
|
|
|
|
|
|
Offshore stow- netting |
151 710 |
75 850 |
12 500 |
55 630 |
295 690 |
|
Offshore jigging |
231 410 |
115 710 |
18 580 |
75 670 |
441 370 |
|
Large purse seining |
3 143 450 |
1 571 730 |
938 350 |
386 260 |
6 039 790 |
|
Anchovy mid- water trawling |
440 830 |
220 420 |
177 350 |
203 650 |
1 042 250 |
|
Large bottom/ mid-water trawl |
1 051 500 |
525 750 |
39 100 |
78 540 |
1 694 890 |
|
Large bottom/ mid-water pair trawling |
408 540 |
204 270 |
40 030 |
110 510 |
763 350 |
|
Large Danish seining |
58 050 |
29 030 |
28 680 |
21 670 |
137 430 |
|
W-Southern Sea middle Danish seining |
241 930 |
120 970 |
17 750 |
29 370 |
410 020 |
|
Eastern Sea middle Danish seining |
127 780 |
63 890 |
19 960 |
17 020 |
228 650 |
|
Eastern Sea trawling |
188 890 |
94 440 |
33 040 |
20 670 |
337 040 |
Economic and financial performances of individual fishing vessels (in US$)
|
Type of vessel |
Offshore |
Offshore |
Eastern Sea |
|
|
Stow-netting |
Jigging |
trawling |
||
|
Total earnings |
412 710 |
424 920 |
313 270 |
|
|
Running costs |
|
|
|
|
|
|
Fuel |
39 430 |
50 560 |
38 010 |
|
|
Harbour dues |
41 280 |
20 650 |
23 200 |
|
Total running costs |
80 710 |
71 210 |
61 210 |
|
|
Labour charges |
|
|
|
|
|
|
Labour share, wages |
150 050 |
171 320 |
103 500 |
|
|
Other labour charges |
29 940 |
21 440 |
58 470 |
|
Total labour charges |
179 990 |
192 760 |
161 970 |
|
|
Vessel costs |
|
|
|
|
|
|
Gear expenses |
46 630 |
17 690 |
13 080 |
|
|
Repairs and maintenance |
32 070 |
23 410 |
26 360 |
|
|
General expenses |
14 130 |
16 800 |
8 070 |
|
Total vessel costs |
92 830 |
57 900 |
47 510 |
|
|
Total costs / expenses |
353 530 |
321 870 |
270 690 |
|
|
Gross cash flow |
59 180 |
103 050 |
42 580 |
|
|
|
Depreciation |
26 030 |
37 820 |
24 440 |
|
|
Interest (1) |
10 800 |
16 100 |
12 300 |
|
Net cash flow |
22 350 |
49 130 |
5 840 |
|
|
Type of vessel |
Large Purse seining |
Anchovy midwater trawler |
Large bottom single trawler |
Large bottom pair-trawler |
|
|
Total Earnings |
5 119 510 |
1 466 710 |
1 890 980 |
1 472 110 |
|
|
Running costs |
|
|
|
|
|
|
|
Fuel |
566 490 |
161 110 |
158 320 |
213 300 |
|
|
Harbour dues |
790 600 |
139 080 |
173 660 |
139 830 |
|
Total running costs |
1 357 090 |
300 190 |
331 980 |
353 130 |
|
|
Labour charges |
|
|
|
|
|
|
|
Labour share, wages |
1 628 780 |
512 160 |
364 300 |
378 040 |
|
|
Other labour charges |
486 030 |
94 260 |
114 240 |
134 180 |
|
Total labour charges |
2 114 810 |
606 420 |
478 540 |
512 220 |
|
|
Type of vessel |
Large purse seining |
Anchovy midwater trawler |
Large bottom single trawler |
Large bottom pair trawler |
|
|
Vessel costs |
|
|
|
|
|
|
|
Gear expenses |
234 150 |
103 940 |
70 900 |
78 440 |
|
|
Repairs and maintenance |
400 940 |
101 480 |
151 000 |
222 790 |
|
|
General expenses |
32 679 |
68 330 |
57 550 |
69 230 |
|
Total vessel costs |
961 880 |
273 750 |
279 450 |
370 460 |
|
|
Total costs / expenses |
4 433 780 |
1 180 360 |
1 089 970 |
1 235 810 |
|
|
Gross cash flow |
685 730 |
286 350 |
801 010 |
236 300 |
|
|
|
Depreciation |
454 000 |
98 140 |
114 250 |
62 870 |
|
|
Interest (1) |
220 900 |
38 100 |
62 000 |
27 900 |
|
Net cash flow |
10 830 |
150 110 |
624 760 |
145 530 |
|
|
Type of vessel |
Large Danish seining |
W-S Sea middle Dan. seining |
E-Sea middle Dan. seining |
|
|
Total Earnings |
411 950 |
424 100 |
313 270 |
|
|
Running costs |
|
|
|
|
|
|
Fuel |
22 550 |
53 720 |
20 920 |
|
|
Harbour dues |
32 260 |
34 770 |
21 030 |
|
Total running costs |
54 810 |
88 490 |
41 950 |
|
|
Labour charges |
|
|
|
|
|
|
Labour share, wages |
119 290 |
125 660 |
149 500 |
|
|
Other labour charges |
29 540 |
27 250 |
45 210 |
|
Total labour charges |
148 830 |
152 910 |
194 710 |
|
|
Vessel costs |
|
|
|
|
|
|
Gear expenses |
13 540 |
28 450 |
8 540 |
|
|
Repairs and maintenance |
49 280 |
22 340 |
21 260 |
|
|
General expenses |
15 940 |
23 930 |
8 430 |
|
Total vessel costs |
78 760 |
74 720 |
38 230 |
|
|
Total costs / expenses |
282 400 |
316 120 |
274 890 |
|
|
Gross cash flow |
129 550 |
107 980 |
38 380 |
|
|
|
Depreciation |
12 430 |
29 420 |
16 900 |
|
|
Interest (1) |
5 000 |
15 000 |
8 400 |
|
Net cash flow |
112 120 |
63 560 |
13 080 |
|
Financial services available to fisheries sector
The Central Federation of Fisheries Cooperatives is a specific credit institution available for the Fisheries Sector. Deposit and loan conditions differ little from those of commercial banks, but it provides some interest rate discounts to its members. In case of natural disasters, loans of up to the equivalent of US$ 12 500 are provided interest free. In addition to loans for fishing craft and gear, loans in the range US$ 125 000 to 250 000 are available for construction of landing sites and fishing ports. Repayment periods range from: 5 to seven years after a two or three year grace period. The average rate of interest is 5 to 8 percent.
All fuel consumed by fishing vessels is tax-free.
1.4 India
Fishing fleet, small/medium-scale coastal fishing
|
State |
Traditional craft |
Mechanized boats |
Total |
|
|
Unpowered |
Powered |
|||
|
Gujarat |
8 825 |
3 730 |
5 294 |
17 849 |
|
Maharashtra |
8 927 |
244 |
7 661 |
16 832 |
|
Karnataka |
11 670 |
190 |
3 730 |
15 590 |
|
Tamil Nadu |
14 763 |
11 374 |
3 742 |
29 879 |
|
Andhra Pradesh |
28 539 |
5 152 |
5 426 |
39 117 |
|
Orissa |
48 645 |
1 688 |
4 082 |
54 415 |
|
West Bengal |
13 488 |
1 142 |
1 118 |
15 748 |
|
Lakshadweep |
4 091 |
270 |
1 880 |
6 241 |
|
Andaman and |
447 |
298 |
415 |
1 160 |
|
Pondicherry |
840 |
124 |
184 |
1 148 |
|
Goa |
4 950 |
355 |
466 |
5 771 |
|
Others |
1 100 |
900 |
850 |
2 850 |
|
TOTAL |
146 285 |
25 467 |
34 848 |
206 600 |
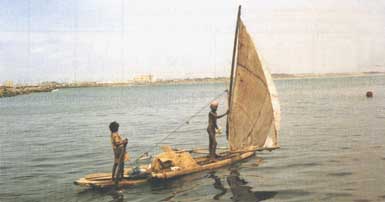
Traditional Kattumaram (fishing raft), India
Large-scale fishing fleet
The fleet consists of 180 Indian vessels, mostly shrimp trawlers, which are operated off Vishakhapatnam. There are also 30 chartered foreign vessels, i.e. 12 tuna longliners, 13 stern- trawlers and five pair trawlers which operate in the Indian EEZ.
Fishing areas
Most of the fishing activities are concentrated in the area within 40 fathoms depth. At present, there is no offshore fishing in India except for deep sea lobsters and deep sea prawns. Some trawlers, however, are trying to diversify towards tuna and cuttlefish.
Fisheries legislation and regulations
Since 1981, India has managed the exploitation of its marine resources up to 200 n mi from shore. This includes the control of foreign fishing vessels operating in the Indian EEZ (30 ships in 1994).
Large vessels may fish inside the Indian EEZ:
- along the East Coast, beyond 12 n mi from the coast;Specific restrictions have been laid down to protect shrimp grounds, in particular.
- along the West Coast, beyond 24 n mi from the coast.
- along the Upper East Coast, around Sand-Heads;Plans for future development of fleet
- along the South West Coast, off Quilon.
In the past, national rules and regulations were not well respected by chartered foreign vessels and traditional fishers urged the Indian Government to reconsider its Policy between 1986 and 1991. The Murari Committee was set up in 1995 and recommended:
- Cancellation of fishing permits to joint ventures, chartered or leased foreign vessels;These recommendations were incorporated in the IXth Five-Year Plan as follows:
- modernization of traditional fishing vessels;
- introduction of more fishing vessels longer than 20 m.
· Upgrading of fishing capabilities of existing mechanized vessels (below 20 m LOA) by providing them with navigational aids (GPS, fish finders, communication equipment, etc.) and increasing their fish hold capacity.In addition, the numbers of new types of fishing vessels to be introduced have been calculated from MSY estimations as follows:· Introduction of intermediate range of fishing vessels (15-19 m LOA) with capacity to fish in depths of 70-150 m (or even up to 200 m). These vessels would be a combination of trawlers, longliners, purse seiners, etc.
· Diversification of existing trawlers (wherever there is extra fishing pressure) to long liners, purse seiners, squid jigging, etc.
· Continuation of assistance for procurement of patrol boats.
· Motorization of traditional craft with outboard or inboard motors including the gear component, particularly for States with weaker response to the ongoing schemes.
· Introduction of new hull materials such as FRP and Ferrocement for fishing vessels.
· Provision of central excise duty exemption on HSD oil supplied to vessels of below 20 m LOA.
- For improved exploitation of demersal resources: 511 25-35 m trawlers with the following distribution: West Coast: 390, East Coast : 94, Wadge bank and the Gulf of Mannar: 27;Techno-economic and operational characteristics of individual fishing units- for improved exploitation of oceanic pelagic resources: 95 to 100 vessels, e.g. 30-35 m tuna longliners. with the following distribution: S-W Coast: 20. lower East Coast, Andaman and Nicobar islands: 75-80.
|
Type of vessel |
Length (m) |
KW |
On-board facilities / storage |
Fishing gear |
Crew |
Owner-ship |
Fishing days |
|
Stern trawler |
14.6 |
108 |
Ice + insulated |
6 trawls |
8 |
Individual |
240 |
|
Tuna longliner |
36 |
590 |
Freezer storage |
Spare hooks and |
17 |
Company |
240 |
|
Purse seiner |
13 |
108 |
Ice + insulated |
1 seine |
16/18 |
Company |
100 |
Stern trawler 14.6 m: crew of eight seamen / 240 days fishing.
- Basic wages: skipper (1) = US$1 143 deckhands (7) = US$286 (each)Tuna longliners 36 m: crew of 17 seamen / 240 days fishing.
- Share: 30 % of income (total earnings less fuel expenses = US$15 822
- Total share and wages: US$18 965 = 28 % of total earnings
- Basic wages : skipper (1), engineer (1), mate (1), engine driver (1), cooks (2), oil men (2), deckhands (8), topass (1) = US$98 825Purse seiner 13 m (Karnataka State) crew of 16/18 seamen / 100 days fishing- Sea allowance for 240 fishing days = US$4 571
- Share: 40 % of income (total earnings less fixed and variable costs) = US$176 571
- Total share and wages = US$279 967 = 37 % of total earnings
- Share: 24 % of income (total earnings less fuel and lubricant expenses) = US$8 240 = 23 % of total earnings.Financial and economic characteristics of individual fishing units.
Investment costs (in US$)
|
Investments |
Hull |
Deck equipment |
Engine and propulsion |
Fishing gear |
Total value |
|
Depreciation rate |
4 % |
10 % |
10 % |
20 % |
|
|
Type of vessel |
|
|
|
|
|
|
Stern-trawler 14 m |
31 750 |
6 980 |
10 760 |
3 970 |
53 460 |
|
Tuna longliner 36 m |
793 650 (1) |
|
|
47 620 |
841 270 |
|
Purse-seiner (Karnataka) 13 m |
27 300 |
1 910 |
8 950 |
9 520 |
47 680 |
Economic and financial performances of individual fishing vessels (in US$)
|
Type of vessel |
Stern trawler 14.6 m |
Tuna longliner 36 m |
Purse seiner 13 m |
|
|
Total earnings |
66 950 |
751 730 |
35 560 |
|
|
Running costs |
|
|
|
|
|
|
Fuel |
14 800 |
73 600 |
1 420 |
|
|
Lubricant |
1 430 |
3 660 |
320 |
|
|
Harbour dues |
320 |
1 590 |
320 |
|
|
Ice |
1 430 |
|
320 |
|
|
Food |
1 710 |
4 510 |
|
|
|
Costs of selling fish |
1 020 |
44 820 |
1 780 |
|
|
Other running costs |
|
11 270 |
|
|
Total running costs |
20 710 |
139 450 |
4 160 |
|
|
Labour charges |
|
|
|
|
|
|
Labour share, wages |
18 970 |
279 970 |
8 240 |
|
Total labour charges |
18 970 |
279 970 |
8 240 |
|
|
Vessel costs |
|
|
|
|
|
|
Gear expenses |
1 310 |
1 590 |
3 170 |
|
|
Repairs and maintenance |
2 820 |
16 670 |
2 480 |
|
|
Vessel insurance |
1 140 |
11 900 |
950 |
|
|
General expenses |
1 110 |
4 440 |
1 270 |
|
Total vessel costs |
6 380 |
34 600 |
7 870 |
|
|
Total costs / expenses |
46 060 |
454 020 |
20 270 |
|
|
Gross cash flow |
20 890 |
297 710 |
15 290 |
|
|
|
Depreciation |
3 840 |
58 400 |
3 790 |
|
|
Interest |
(1) 4 230 |
(1) 66 630 |
(1) 3 780 |
|
Net cash flow |
12 820 |
172 680 |
7 720 |
|
Volume, composition and value of catches for three types of selected vessels
|
Type of vessel |
Stern Trawler |
Tuna Longliner |
Purse seiner |
|||||||
|
14.6 m Wood |
36 m |
13 m (Karnataka) |
||||||||
|
Catches (per year) |
Weight (kg) |
Price $/kg |
Revenue ($) |
K |
P |
R |
K |
P |
R |
|
|
1 - Shrimps |
|
|
|
|
|
|
|
|
|
|
|
Tiger shrimp |
480 |
12.0 |
5 760 |
|
|
|
|
|
|
|
|
White shrimp |
2 400 |
8.2 |
19 680 |
|
|
|
|
|
|
|
|
Other shrimp |
6 880 |
3.5 |
24 080 |
|
|
|
|
|
|
|
|
Fish |
|
|
|
|
|
|
|
|
|
|
|
Prime fish |
2 000 |
1.27 |
2 540 |
|
|
|
|
|
|
|
|
Other fish |
32 000 |
0.48 |
15 360 |
|
|
|
|
|
|
|
|
|
43 760 |
|
67 420 |
|
|
|
|
|
|
|
|
|
||||||||||
|
2- Yellowfin tuna |
|
|
|
159 500 |
3.75 |
598 120 |
|
|
|
|
|
Bigeye tuna |
|
|
|
2 000 |
5.7 |
11 400 |
|
|
|
|
|
Skipjack |
|
|
|
200 |
0.6 |
120 |
|
|
|
|
|
Sailfish, marlin |
|
|
|
15 000 |
3.3 |
49 500 |
|
|
|
|
|
Shark |
|
|
|
53 000 |
1.75 |
92 750 |
|
|
|
|
|
Other |
|
|
|
400 |
0.6 |
240 |
|
|
|
|
|
|
|
|
|
230 100 |
|
752 130 |
|
|
|
|
|
|
||||||||||
|
3- Mackerel |
|
|
|
|
|
|
40 000 |
0.48 |
19 000 |
|
|
Sardine |
|
|
|
|
|
|
100 000 |
0.16 |
16 000 |
|
|
Other |
|
|
|
|
|
|
|
|
600 |
|
|
|
|
|
|
|
|
|
140 000 |
|
35 600 |
|
|
Type of vessel |
Stern trawler |
Tuna longliner |
Purse seiner |
|
Invested capital |
53 460 |
841 270 |
47 680 |
|
Net cash flow |
12 820 |
172 680 |
7 720 |
|
Return on investment |
24.0 % |
20.5 % |
16.2 % |
The National Bank for Agriculture and Rural Development (NABARD) provides refinancing through commercial banks, cooperative banks and RRBs for development of marine fisheries.
Other agencies providing credit for marine sector are:
- Industrial Finance Corporation of India (IFCI)Institutional credit is available for:
- Industrial Development Bank of India (IDBI)
- Shipping Credit and Investment Corporation of India (SCICI)
- Industrial Credit and Investment Corporation (ICIC)
- National Cooperative Development Corporation (NCDC)
- State Finance Corporations (SFCs)
- Traditional craft and gear;Terms of finance
- mechanized vessels;
- motorization of fishing vessels;
- offshore fishing vessels (purse seiners, trawlers, longliners, etc.);
- processing plants;
- cold storage;
- ice plants;
- retail shops;
- refrigerated vans.
NABARD prepares guidelines for formulation of projects and assistance to financing banks.
- Borrowers: any individual, cooperative, corporation, private company etc. can submit a project to any bank. The financing bank, after appraisal, submits the same to NABARD for refinancing assistance.For large amounts (more than US$6 350), contribution is more than 20/25 percent. Subsidies, if any, are reckoned towards this contribution.- Loans: Contribution of borrowers: five to 25 percent.
Amounts and rates:
|
|
Commercial banks |
RRBs |
SCBs |
|
Up to US$800 |
8.5 to 12 % |
6.5 % |
6.5 % |
|
From US$800 to 6 350 |
10.5 to 13.5 % |
9.5 % |
9.5 % |
|
Above US$6 350 |
Commercial rate less 3 % to commercial rate |
12.0 % |
12.0 % |
Repayment period: usually four to ten years.
Capital subsidies:
In Karnataka State, a subsidy of Rs. 100 000 is available, in principle, for building multipurpose vessels.
MPEDA provides subsidies to offshore fishing vessels.
1.5 Malaysia
Fishing fleet
The Malaysian fishing fleet consists of two units, i.e.:
- Coastal or inshore fisheries include boats of less than 70 GRT operating within 30 nautical miles; they account for 87 % of total marine landings in Malaysia.Five main types of fishing boats were used in Malaysia in 1995:- Deep-sea fisheries include boats of 70 GRT and above operating beyond 30 nautical miles; they account for 13 % of total marine landings.
|
|
|
|
|
tonnes |
|
Otter trawl |
5 991 |
Units in operation |
Landing |
609 298 |
|
Purse seine |
953 |
" |
" |
156 826 |
|
Drift and gillnets |
19 296 |
" |
" |
150 207 |
|
Hooks and lines |
3 989 |
" |
" |
41 888 |
|
Portable traps (Bubu) |
666 |
" |
" |
9 110 |
|
Total |
30 895 |
" |
" |
967 329 |
Inshore fisheries are located within the three following zones:
Zone A: 5 n mi from shorePlans for future development of fleet
Zone B: 5 to 12 n mi
Zone C: 12 to 30 n mi- Deep Sea fisheries take place beyond the 30 n mi limit.
- 70 % of the fishing vessels are operated from Peninsular Malaysia.
- 30 % are operated off Sabah and Sarawak coasts
The Government acknowledges that inshore fisheries are already heavily exploited and that in this sector any attempt to increase fishing effort should be avoided. Special emphasis is given to proper management of existing resources.
Deep-sea fisheries are seen to have further potential for development. Since 1980, Malaysian waters expanded from 47 000 n mi2 to 162 000 n mi2, but off shore fisheries were not developed. This is the reason why the Government assumes there is still considerable potential for further development. As this kind of activity requires large capital investment, the corporate sector is expected to take an active role in its growth. Also aquaculture shows bright prospects for expansion.
The Government of Malaysia - through its Department of Fisheries - has started promoting the development of offshore fisheries and commercial aquaculture while maintaining a sustainable level of production for inshore fisheries.
Techno-economic and operational characteristics of individual fishing units
|
Type of vessel |
Tonnage (GRT) |
Crew size |
Fishing trips/year |
|
Trawler (otter trawl) |
20 - 40 |
3 - 4 |
15 - 16 |
|
Purse seiner |
20 - 40 |
14 - 15 |
14 - 15 |
|
Drift or gillnetter |
5 - 10 |
1 - 2 |
19 - 20 |
|
Handliner |
5 - 10 |
2 - 3 |
18 - 19 |
|
Portable traps |
5 - 10 |
2 - 3 |
11 - 12 |
Gross revenue - operation costs = net profit
Owners share = 50 % of net profit
Crew share = 50 % of net profit including:
- Captain's shareFinancial and economic characteristics of individual fishing units (in US$)
- Wages - other key positions
- Wages - ordinary crew
|
Investment |
Hull (1) |
Engine and propulsion |
Deck equipment |
Fishing gear |
Total |
|
Depreciation rate |
10 % |
10 % |
10 % |
20 % |
|
|
Trawler |
41 480 |
22 590 |
12 520 |
6 130 |
82 720 |
|
Purse seiner |
37 410 |
15 810 |
7 850 |
12 300 |
73 370 |
|
Drift or gillnetter |
11 110 |
3 700 |
1 850 |
3 700 |
20 360 |
|
Handliner |
11 410 |
6 200 |
3 780 |
390 |
21 780 |
|
Portable traps |
11 110 |
6 200 |
4 070 |
2 590 |
23 970 |
Economic and financial performance of individual fishing vessels (in US$)
|
Type of vessel |
Trawler |
Purse seiner |
Drift or |
Handliner |
Portable traps |
|
Total earnings |
62 450 |
116 730 |
7 160 |
19 300 |
12 300 |
|
Running costs |
|
|
|
|
|
|
Fuel |
19 470 |
17 360 |
1 470 |
3 440 |
2 400 |
|
Ice / salt |
4 100 |
13 100 |
490 |
1 520 |
1 200 |
|
Other running costs |
3 190 |
10 740 |
650 |
1 600 |
1 150 |
|
Total running costs |
26 760 |
41 200 |
2 610 |
6 560 |
4 750 |
|
Labour charges |
|
|
|
|
|
|
Total labour charges |
12 950 |
35 210 |
1 040 |
4 300 |
2 300 |
|
Vessel costs (1) |
10% |
15% |
5% |
3% |
5% |
|
Total vessel costs (1) |
6 240 |
17 500 |
360 |
580 |
610 |
|
Total costs / expenses |
45 950 |
93 910 |
4 010 |
11 440 |
7 660 |
|
Gross Cash Flow |
16 500 |
22 820 |
3 150 |
7 860 |
4 640 |
|
Depreciation |
8 890 |
8 570 |
2 410 |
2 220 |
2 660 |
|
Interest (2) |
2 910 |
2 580 |
720 |
770 |
840 |
|
Net Cash Flow |
4 700 |
11 670 |
20 |
4 870 |
1 140 |
(2) Average amount for repayment on ten year loan 80 percent
of investment value.
Interest rate eight percent.
1.6 Indonesia
Artisanal fishing: (Indonesian EEZ)
|
Non- powered boats: 61 % |
245 162 |
|
- Dugout canoes |
127 936 |
|
- Plank boats |
117 226 |
|
- Small |
73 392 |
|
- Medium |
37 139 |
|
- Large |
6 695 |
|
Powered boats: 39 % |
159 491 |
|
|
- Outboard powered boats : 25 % |
94 024 |
|
|
- Inboard powered boats: 16 % |
65 467 |
|
|
|
<5 GRT |
48 855 |
|
|
5 - 10 GRT |
9 562 |
|
|
10 - 20 |
2 789 |
|
|
20 - 30 |
1 519 |
|
|
30 - 50 |
1 682 |
|
|
50 - 100 |
687 |
|
|
100 - 200 |
253 |
|
|
>200 |
120 |
|
|
Subtotal |
404 653 |
|
Industrial fishing (international waters) |
1 674 |
|
|
TOTAL No. of fishing vessels |
406 327 |
|
The major fishing areas and the fishing carried out throughout Indonesian waters are:
|
Java Sea, west coast of Jakarta |
Gillnetters < 30 GRT |
150 n mi |
|
Java Sea, central coast |
Purse seiners 20-50 GRT |
20 - 30 n mi |
|
Pekalongan |
Purse seiners 50 - 100 GRT |
50 - 60 n mi |
|
Java Sea, Makassar Strait " |
Purse seiners > 100 GRT |
> 100 n mi |
|
Indian Ocean, |
Longliners 15/40/60/100 GRT |
South of Java and Bali |
|
North Sulawesi and Obi Strait (N. Maluku) |
Tuna handliners 3 - 5 GRT |
Coastal fishing |
|
Obi Strait (N. Maluku) |
Pole and liners 10 GRT |
Coastal fishing |
|
Waigeo island and Arafura sea (W Irian Jaya) |
Pole and liners 30 GRT |
20 - 100 n mi |
While the MSY has been estimated by Indonesian Directorate General of Fisheries at a level of 6.72 million tonnes / year, to compare with actual landings of 3.29 million tonnes (49 % of the total resource potential), many fishing areas are reported to be fully or overexploited:
- Fully exploited resources: Penaeid stock (Java Sea), Spiny lobster stock (Indian Ocean)Future development of marine capture fisheries can only be considered if alternative fishing grounds are found and explored further offshore, especially in Eastern Indonesia. The introduction of more efficient management measures is urgently needed.- Overexploited resources: small pelagic fish (Malacca strait and Java Sea), demersal fish stocks (Malacca strait, Java Sea, Makassar Strait, Flores Sea, Seram Sea, Tomini bay, Celebes Sea, Pacific Ocean).
Techno-economic and operational characteristics of individual fishing units
|
Type of vessel |
Length |
Tonnage |
KW |
On board |
Fishing |
Crew |
Ownership |
|
|
Purse seiners |
|
|
|
|
|
|
|
|
|
|
Small |
17 |
15 |
2 x 17 (outboard) |
Fishhold |
Purse seine 250 / 300 x 40 m |
21 |
Individual |
|
|
Medium |
18 |
54 |
59 |
Ice, salt + fishhold (13 t) |
400 / 600 x 60m |
34 |
Company |
|
|
Large |
25.5 |
114 |
171 |
Ice, salt + |
600 / 800 x 80 m |
44 |
Company |
|
Skipjack |
|
|
|
|
|
|
|
|
|
|
Small |
16 |
10 |
33 |
Ice + |
10 poles |
20 |
Individual |
|
|
Large |
22.2 |
30 |
177 |
Ice + |
20 poles |
23 |
State owned company |
|
Tuna Handliner |
13 |
5 |
11 - 18 |
Ice + |
Line (60/100 m) |
4 |
Individual |
|
|
Type of vessel |
Length |
Tonnage(GRT) |
HP |
On-board |
Fishing |
Crew |
Ownership |
|
|
Tuna |
|
|
|
|
|
|
|
|
|
|
15 GRT |
14.5 |
15 |
77 |
Ice + fishhold (4.6 m3) |
Hooks 700 |
11 |
State-owned company |
|
|
40 GRT |
18.8 |
40 |
177 |
" |
Hooks |
13 |
" |
|
|
60 GRT |
23.4 |
60 |
177 |
" |
" |
13 |
" |
|
|
|
27.8 |
100 |
295 |
" |
" |
19 |
" |
|
Gillnetter |
12.3 |
5.5 |
25 |
" |
Pieces of |
7 |
Individual |
|
|
Type of vessel |
Fishing days |
Average duration of |
Fishing seasons |
|
|
Purse seiners |
|
|
|
|
|
|
Small |
149 |
1 day |
May-Jul and Aug-Dec |
|
|
Medium |
155 |
17 days |
" |
|
|
Large |
164 |
21 days |
" |
|
Skipjack pole and liners |
|
|
|
|
|
|
Small |
150 |
1-2 days |
9 month-peak Sept-Nov |
|
|
Large |
205 |
5 days |
" |
|
Tuna handliner |
132 |
1-2 days |
|
|
|
Tuna longliners |
|
|
|
|
|
|
15 GRT |
254 |
15 days |
Jul-Dec |
|
|
40 GRT |
278 |
" |
" |
|
|
60 GRT |
265 |
" |
" |
|
|
100 GRT |
283 |
35 days |
" |
|
Gillnetter |
276 |
14 days |
Feb-Sep |
|
Investment costs (in US$)
|
Investment |
Hull |
Fishhold |
Deck |
Engine and |
Fishing |
Total |
|
|
Depreciation rate |
4 % |
4 % |
10 % |
10 % |
20 % |
|
|
|
Type of vessel |
|
|
|
|
|
|
|
|
Purse seiners |
|
|
|
|
|
|
|
|
|
Small |
15 450 |
2 580 |
20 |
3 080 |
12 170 |
33 300 |
|
|
Medium |
30 040 |
16 310 |
1 290 |
6 050 |
31 490 |
85 180 |
|
|
Large |
51 500 |
18 460 |
1 300 |
7 430 |
35 410 |
114 100 |
|
Skipjack pole and liners |
|
|
|
|
|
|
|
|
|
Small |
3 860 |
|
40 |
20 170 |
90 |
24 160 |
|
|
Large |
62 230 |
|
1 720 |
40 770 |
100 |
104 820 |
|
Tuna handliner |
2 150 |
|
20 |
5 360 |
30 |
7 560 |
|
|
Tuna longliners |
|
|
|
|
|
|
|
|
|
15 GRT |
|
(not available) |
|
|
|
|
|
|
40 GRT |
|
" |
" |
|
|
|
|
|
60 GRT |
429 180 |
|
|
|
85 840 |
515 020 |
|
|
100 GRT |
|
(not available) |
|
|
|
|
|
Gillnetter |
15 020 |
|
60 |
7 330 |
3 220 |
25 630 |
|
|
Type of vessel |
Purse seiner 17 m |
Purse seiner 18 m |
Purse seiner 25.6 m |
Tuna longliner 23.4 m |
|
|
Total Earnings |
25 430 |
62 030 |
85 700 |
203 150 |
|
|
Running costs |
|
|
|
|
|
|
|
Fuel |
2 460 |
22 360 |
27 570 |
21 040 |
|
|
Lubricant |
|
490 |
530 |
2 100 |
|
|
Harbour dues |
260 |
730 |
900 |
4 280 |
|
|
Ice / salt |
910 |
3 330 |
4 640 |
970 |
|
|
Food |
980 |
5 670 |
6 780 |
5 950 |
|
|
Costs of selling fish |
1 270 |
3 100 |
4 280 |
|
|
|
Other running costs |
|
20 |
30 |
18 450 |
|
Total running costs |
5 880 |
35 700 |
44 730 |
52 790 |
|
|
Labour charges |
|
|
|
|
|
|
|
Labour share,wages |
4 980 |
5 500 |
9 220 |
11 800 |
|
|
Social insurance |
510 |
1 240 |
1 710 |
3 480 |
|
|
Other labour charges |
1 270 |
3 100 |
4 280 |
22 910 |
|
Total labour charges |
6 760 |
9 840 |
15 210 |
38 190 |
|
|
Vessel costs |
|
|
|
|
|
|
|
Gear expenses |
330 |
620 |
730 |
4 500 |
|
|
Repairs and maintenance |
590 |
980 |
1 070 |
18 470 |
|
|
General expenses |
|
630 |
660 |
420 |
|
Total vessel costs |
920 |
2 230 |
2 460 |
23 390 |
|
|
Total costs / expenses |
13 560 |
47 770 |
62 400 |
114 370 |
|
|
Gross cash flow |
11 870 |
14 260 |
23 300 |
88 780 |
|
|
|
Depreciation |
3 470 |
8 890 |
10 750 |
(est) 45 000 |
|
|
Interest (1) |
2 050 |
5 250 |
7 030 |
31 720 |
|
Net cash flow |
6 350 |
120 |
5 520 |
12060 |
|
|
Type of vessel |
Gillnetter |
Tuna handliner |
Pole and liner 10 GRT |
Pole and liner 30 GRT |
|
|
Total Earnings |
12 020 |
8 690 |
43 680 |
122 690 |
|
|
Running costs |
|
|
|
|
|
|
|
Fuel |
2 220 |
1 170 |
3 170 |
13 260 |
|
|
Lubricant |
260 |
140 |
410 |
970 |
|
|
Harbour dues |
40 |
60 |
110 |
50 |
|
|
Ice |
1 230 |
1 540 |
2 570 |
9 580 |
|
|
Food |
2 310 |
820 |
3 400 |
2 930 |
|
|
Costs of selling fish |
1 530 |
|
|
|
|
|
Other running costs |
50 |
540 |
10 600 |
15 980 |
|
Total running costs |
7 640 |
4 270 |
20 260 |
42 770 |
|
|
Labour charges |
|
|
|
|
|
|
|
Labour share, wages |
1 970 |
1 770 |
10 820 |
32 440 |
|
Total labour charges |
1 970 |
1 770 |
10 820 |
35 080 |
|
|
Vessel costs |
|
|
|
|
|
|
|
Gear expenses |
70 |
410 |
1 030 |
1 180 |
|
|
Repairs and maintenance |
350 |
390 |
640 |
4 460 |
|
|
Vessel insurance |
|
|
|
240 |
|
|
General expenses |
20 |
80 |
100 |
670 |
|
Total vessel costs |
440 |
880 |
1 770 |
6 550 |
|
|
Total costs / expenses |
10 050 |
6 920 |
32 850 |
84 400 |
|
|
Gross cash flow |
1 970 |
1 770 |
10 830 |
38 290 |
|
|
|
Depreciation |
1 980 |
630 |
2 190 |
6 760 |
|
|
Interest (1) |
1 580 |
470 |
1 490 |
6 460 |
|
Net cash flow |
-1 590 |
670 |
7 150 |
25070 |
|
Financial services available to fisheries sector
In Indonesia there are no special institutional credit programmes for the fisheries sector, several general institutional credit sources are available:
- Small Investment Credit (KKI) for fishing vessels, engines, gears.Terms of finance:
- General Rural Credit (KUPEDES) for any small-scale investment
- Credit for Primary Cooperatives Members (KKPA) for credit to members of fisheries cooperatives or cooperatives whose members are working in the fisheries sector.
Until 1996: Second Fisheries Industries Credit Project (FICP-II)
- Loan ceiling = US$525 000 / enterpriseTraditional fishing canoes, Ghana
- Equity = 35 %
- Collateral required
- Rate = commercial terms
- Repayment = ten years
From now on: Small Enterprise Credit (SEC)
- Loan Ceiling US$107 000 / client (KUPEDES = US$10 700)Credit for Primary Coop members (KKPA)
- Collateral required
- Rate = commercial terms
- Maturity period = three years
- Loan ceiling = US$21 500 / client
- No collateral required
- Rate = 14 % / year
- Repayment < 15 years including grace period
![]()
![]()
![]()
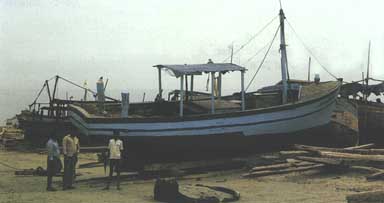