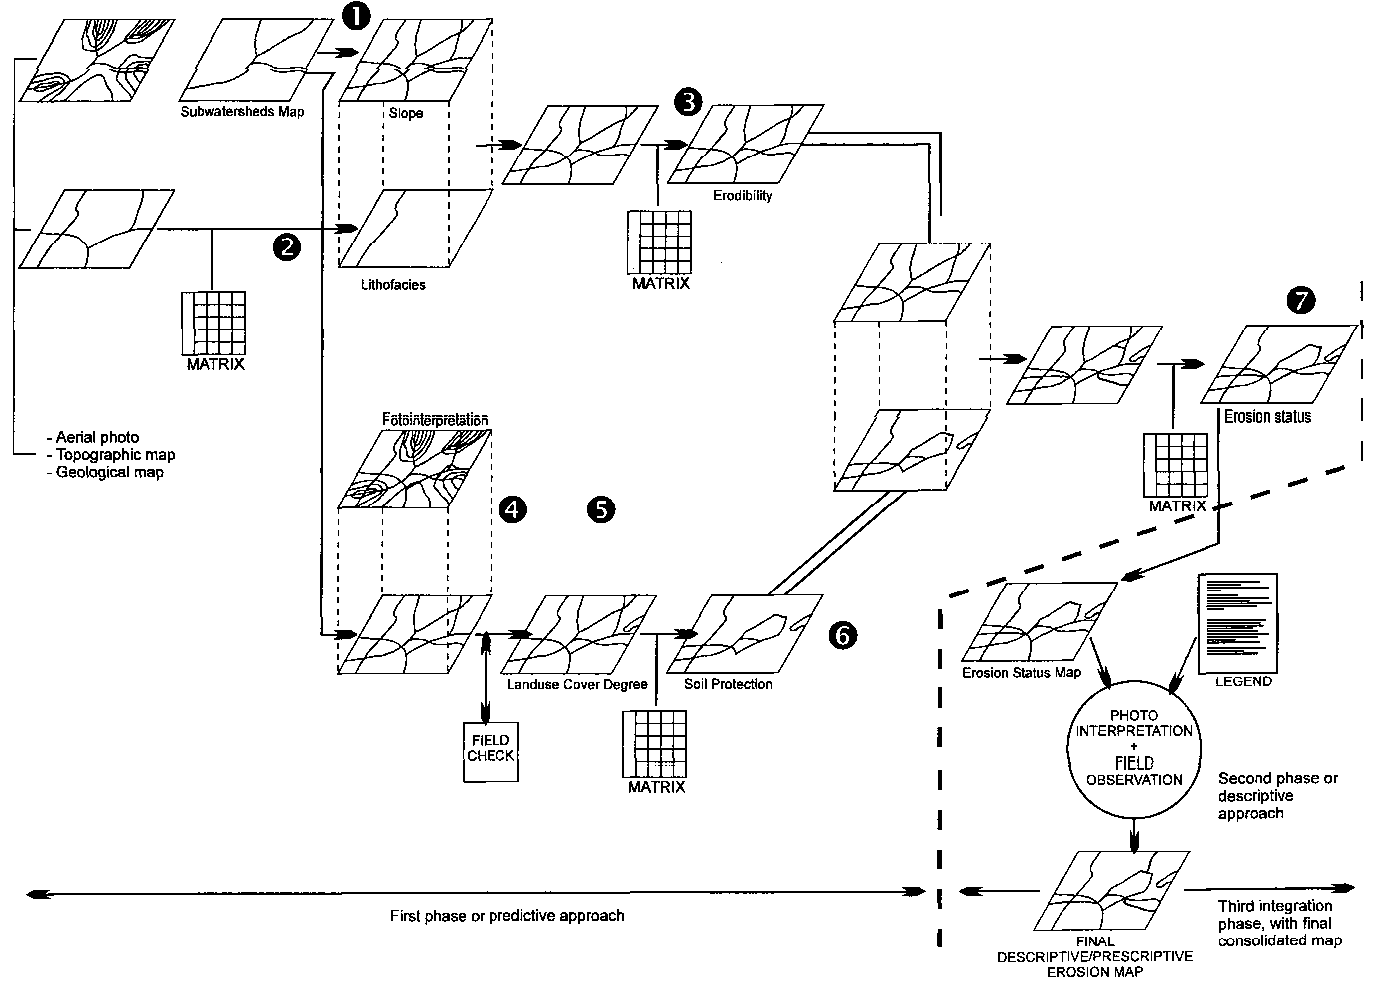
3.2 First phase: Predictive approach
Step 1: Preparation of the slope map from the topographic map
The procedure starts with the delimitation of all identifiable thalwegs on the basic contour topographic map, be those sporadic or permanent water courses. This approximation enables us to delimit all the boundary lines of the slopes, as the thalweg coincides with the bottom of one slope and the beginning of the other (Fig. I-2). Most of the thalwegs figure as watercourses in the topographical map; therefore, only the unmarked thalwegs, which usually coincide with small rivers or gullies, should be additionally drawn.
Figure I-2. Main operational sequence of erosion mapping procedures
Box 2 Mapping scale Erosion mapping, whether predictive, descriptive or integrated, should be closely adapted to the selected mapping scale, which means that the expected cartographic diagnosis should not be overestimated as related to the actual accuracy capacity of the map scale and legend. The basic mapping resolution of the map is determined by the minimum linear (1 cm) or area (1 sq. cm) dimensional expression of erosion processes on the map whatever its scale (e.g. 100 m /1 ha at 1:100,000; 50 m / 0.25 ha at 1:50,000; etc.) Most suitable map scales can be classified as follows:
For
the current erosion mapping programme, a medium working
scale of 1:50,000 has been agreed upon, with further
possibility to reduce the original detailed erosion data
to smaller scales meant to be used in priority
identification and soil and water conservation planning
maps (1:100,000 to 1:200,000). |
Once the thalwegs figure in the map, watersheds divides have to be identified and drawn (see Fig. I-3). The purpose is to identify mountain sides regardless of any minor physiographic change within the slope.
At that stage the map of sub-watershed has been produced. This map will be used as the basic canvas and reference map for the land-use photo-interpretation. All the maps and copies prepared should be drawn on transparent indeformable polyester sheets.
Once the thalwegs and divides have been drawn, it is necessary to identify the large continuous slopes which reflect main topographic features (see Fig. I-4).
Figure I-3. Identification of divide lines
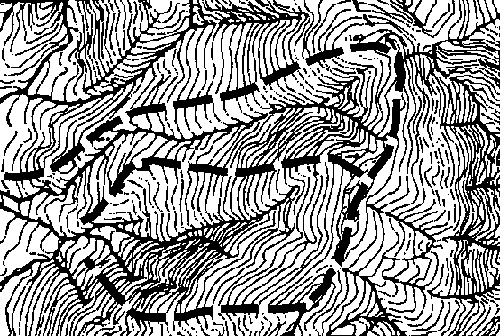
Figure I-4. Preliminary mapping of large sloping units
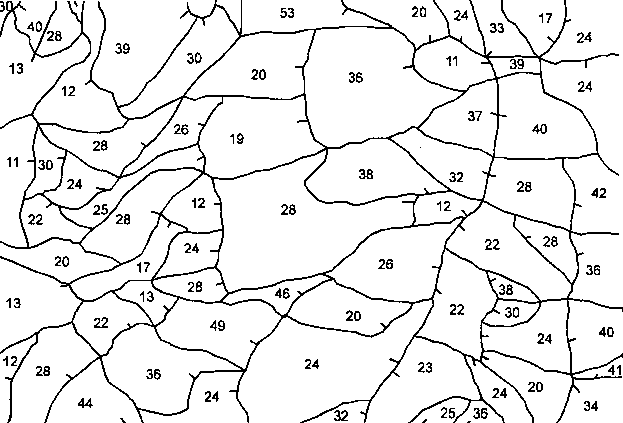
After having located and mapped the large slope polygons, topographic breaks and slope changes inside the polygons are identified and mapped. The result of that operation is the topographic mosaic map which shows homogeneous topographic units. (see Fig. I-5).
Once the topographic mosaic map is finished, slope values for each of the identified units are to be determined. Therefore, the number of countour lines contained within the reference mapping section measured in millimeters have to be counted and then related to in the Table 1, where the slope inclinations are expressed in percentages for each of the referred areas (see Table I-1 and applied examples in Fig. I-6 and I-7)
As additional information, the sloping direction of each unit may be represented by a short line starting from the divide line downward. For the interpretation of the slope map the slope orientation (North facing, South facing, etc.) could be taken into consideration.
Figure I-5. Topographic mosaic map
Table I-1. Slope values
Number of intervals |
Length of sloping
sections in mm |
|||||||||||||
1 |
2 |
3 |
4 |
5 |
6 |
7 |
8 |
9 |
10 |
15 |
20 |
30 |
40 |
|
1 |
40 |
20 |
13.0 |
10 |
8 |
6.0 |
5.7 |
5 |
4.4 |
4 |
2.6 |
2 |
1.3 |
1 |
2 |
80 |
40 |
26.6 |
20 |
16 |
13.3 |
11.4 |
10 |
8.8 |
8 |
5.3 |
4 |
2.6 |
2 |
3 |
- |
60 |
40.0 |
30 |
24 |
20.0 |
17.1 |
15 |
13.2 |
12 |
8.0 |
6 |
3.9 |
3 |
4 |
- |
80 |
53.3 |
40 |
32 |
26.6 |
22.5 |
20 |
17.6 |
16 |
10.6 |
8 |
5.2 |
4 |
5 |
- |
100 |
66.6 |
50 |
40 |
33.3 |
28.5 |
25 |
22.0 |
20 |
13.3 |
10 |
6.5 |
5 |
6 |
- |
- |
80.0 |
60 |
48 |
40.0 |
34.2 |
30 |
26.4 |
24 |
16.0 |
12 |
7.8 |
6 |
7 |
- |
- |
93.3 |
70 |
56 |
46.6 |
39.9 |
35 |
30.8 |
28 |
18.6 |
14 |
9.1 |
7 |
8 |
- |
- |
- |
80 |
64 |
53.3 |
45.6 |
40 |
35.2 |
32 |
21.3 |
16 |
10.4 |
8 |
9 |
- |
- |
- |
90 |
72 |
60.0 |
51.3 |
45 |
39.6 |
36 |
24.0 |
18 |
11.7 |
9 |
10 |
- |
- |
- |
100 |
80 |
66.6 |
57.0 |
50 |
44.0 |
40 |
26.6 |
20 |
13.0 |
10 |
11 |
- |
- |
- |
88 |
73.3 |
62.7 |
55 |
48.4 |
44 |
29.3 |
22 |
14.3 |
11 |
|
12 |
- |
- |
- |
96 |
80.0 |
68.4 |
60 |
52.8 |
48 |
32.0 |
24 |
15.6 |
12 |
|
13 |
- |
- |
- |
104 |
86.6 |
74.1 |
65 |
57.2 |
52 |
34.6 |
26 |
16.9 |
13 |
|
14 |
- |
- |
- |
- |
- |
93.3 |
79.8 |
70 |
61.1 |
56 |
37.3 |
28 |
18.2 |
14 |
15 |
- |
- |
- |
- |
- |
100.0 |
85.5 |
75 |
66.0 |
60 |
40.0 |
30 |
19.5 |
15 |
16 |
- |
- |
- |
- |
- |
- |
91.2 |
80 |
70.4 |
64 |
42.6 |
32 |
20.8 |
16 |
17 |
- |
- |
- |
- |
- |
- |
96.9 |
85 |
74.8 |
68 |
45.3 |
34 |
22.1 |
17 |
18 |
- |
- |
- |
- |
- |
- |
102.6 |
90 |
79.2 |
72 |
48.0 |
36 |
23.4 |
18 |
19 |
- |
- |
- |
- |
- |
- |
- |
95 |
83.6 |
76 |
50.6 |
38 |
24.7 |
19 |
20 |
- |
- |
- |
- |
- |
- |
- |
100 |
88.0 |
80 |
53.3 |
40 |
26.0 |
20 |
Slope inclination in
percentage (%) |
||||||||||||||
Figure I-6. Length and value of sloping sections
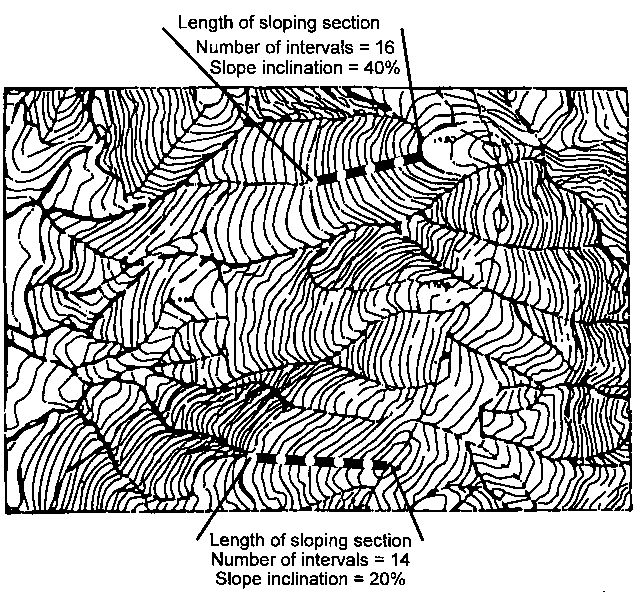
Figure I-7. Map of slopes
Slope classes are shown in Table I-2.
Table I-2. Slope classes
Classes |
Type of slope |
1. |
Flat to gentle slopes (0-3%) |
2. |
Moderate (3%-12%) |
3. |
Steep (12%-20%) |
4. |
Very steep (20%-35%) |
5. |
Extreme (>35%) |
Step 2. Elaboration of the lithofacies map
The procedure is based on the geological, lithological and pedological maps and data. The map shows the kind of rock, parent material or surface sediment/soil, with emphasis on their cohesiveness in order to present their inherent resistance to both mechanical and chemical erosion.
Complementary features specifically related to soil, such as soil structure, impermeability, clay content, water storage capacity, should be taken into account.
The Lithofacies map legend considers the classes as presented in Table I-3.
The areas with abundant (40-80%) to dominant (>80%) rock outcrops and/or surface stoniness should be identified and outlined in all maps (not only in the lithofacies map), and classified as nonproductive areas (class /al of Table I-3). This same classification is to be applied to areas such as water bodies, quarries, beaches. urban or industrial sectors. etc.
Table I-3. Lithofacies classes
Lithofacies classes |
Type of material |
(a) |
Non-weathered compact rock,
strongly cemented conglomerates or soils, crusts, hard
pans outcrops (massive limestone, highly stony soils,
igneous or eruptive rocks, locally crusted soils). |
(b) |
Fractured and/or medium weathered
cohesive rocks or soils. |
(c) |
Slightly to medium compacted
sedimentary rocks (slates, schists, compacted marls,
etc.) and/or soils. |
(d) |
Soft/low-resistant or
strongly/deeply weathered rocks (marls, gypsum, clayey
slates, etc.) and/or soils. |
(e) |
Loose, non cohesive
sediments/soils and detritic materials. |
Step 3. Preparation of erodibility man
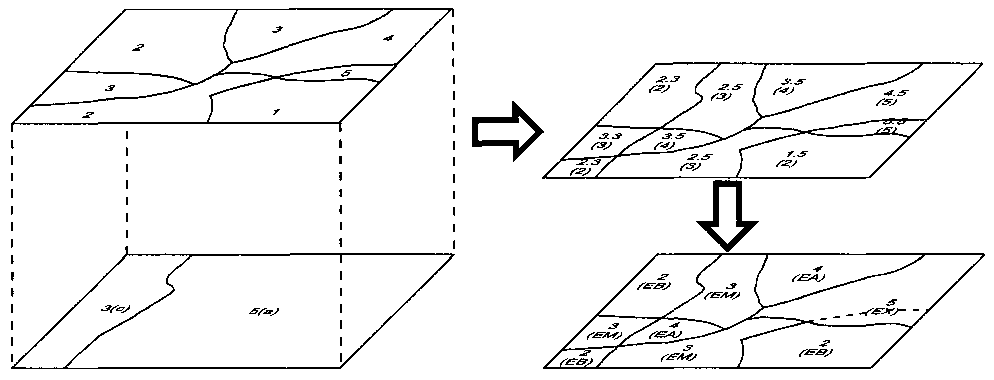
Erodibility map is the result of overlaying the slope map and the lithofacies map (see Fig. I-8).
The polygons resulting from the overlaying of the two reference maps are classified according to the following matrix shown in Table I-4.
Figure I-8. Erodibility map processing
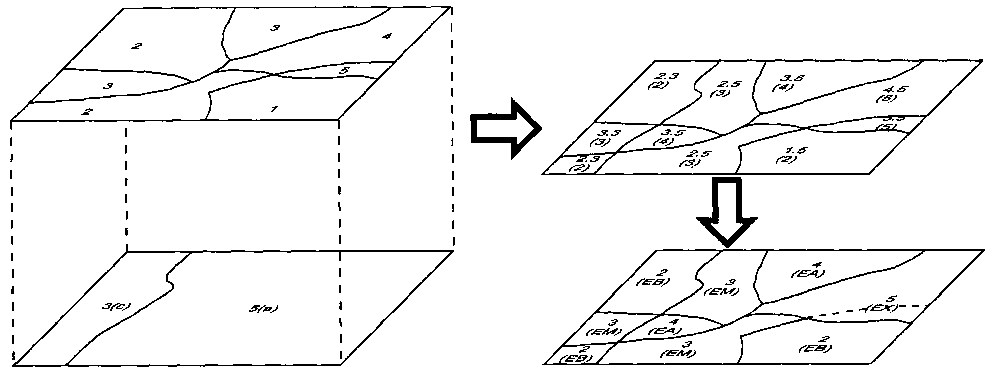
Table I-4. Matrix: Slope vs. lithofacies
Slope class |
Lithofacies class |
||||
1(a) |
2(b) |
3(c) |
4(d) |
5(e) |
|
1. |
1(EN) |
1(EN) |
1(EN) |
1(EN) |
2(EB) |
2. |
1(EN) |
1(EN) |
2(EB) |
3(EM) |
3(EM) |
3. |
2(EB) |
2(EB) |
3(EM) |
4(EA) |
4(EA) |
4. |
3(EM) |
3(EM) |
4(EA) |
5(EX) |
5(EX) |
5. |
4(EA) |
4(EA) |
5(EX) |
5(EX) |
5(EX) |
Table I-5: Levels of erodibility
Classes |
Potential erosion |
1. |
Low (EN) |
2. |
Moderate (EB) |
3. |
Medium (EM) |
4. |
High (EA) |
5. |
Extreme (EX) |
Steps 4 and 5: Preparation of land-use and vegetation cover map
Both actual land use and vegetation cover are first identified by photo-interpretation, and then transferred to the sub-watershed map. Land-use and vegetation cover classes are given in Tables I-6 and I-7.
It should be noted that the scale of the aerial photo does not necessarily coincide with the selected scale for mapping. The mapping scale is selected with regard to the criteria shown in Box 2. Therefore, an adjustment operation has to be done when transferring the photo-interpretation patterns to the basic topographic map.
BOX 3 Developed methodology As an overall recommendation, the methodological framework should not be considered as a rigid scheme, but rather as a set of guidelines in which the cartographic concepts, units and symbols of which should be easily adapted to specific geographical country or regional features. In the predictive phase the content (qualifications) of the double entry tables (matrix) can be adapted to the specific conditions of each country or region. In particular the different vegetation cover classes and their qualifications in the tables should be defined according to the specific local conditions. In
the descriptive phase, the adaptation could be possible
by opening new categories of processes or characteristics
in addition to those proposed in the original legend
under the paragraph "Multiple processes" P1,
P2, P3... for newly identified erosion forms or trends. |
Table I-6. Land use classes
Classes |
Land use |
1. |
Dry farming (herbaceous) |
2. |
Ligneous crops (olive, almonds,
fruit trees, vineyards) |
3. |
Irrigation |
4. |
Forest |
5. |
Shrub |
6. |
Range, sparse shrubs |
Table I-7. Vegetation cover classes
Classes |
Vegetation cover |
1. |
Less than 25% |
2. |
25% - 50% |
3. |
50% - 75% |
4. |
More than 75% |
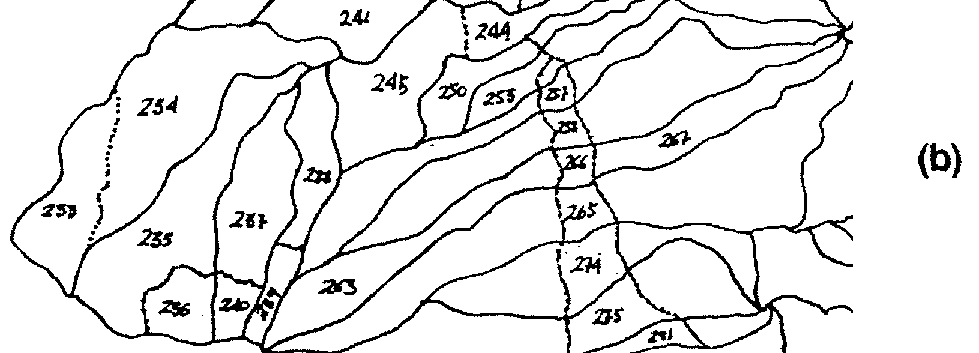
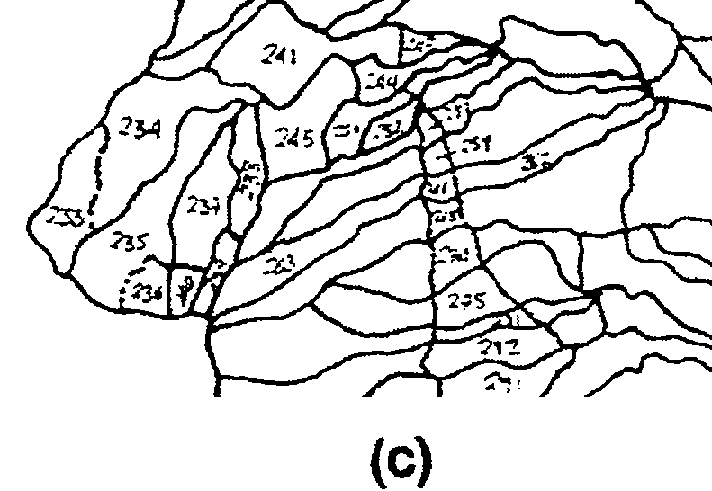
The sequence of photo-interpretation and mapping procedure for land use and vegetation cover identification is shown in Fig. I-9
If possible, recent aerial photographs from different periods of the year should be taken into account in order to consider changes/variations in the vegetation cover/land use throughout the year.
Photo-interpretation has to be checked by field visits and corrected if necessary. The slope map provides a useful reference for polygon identification in the field.
Figure I-9. Sequence of mapping procedure and actual land-use and vegetation cover mapping procedure
(a) Sub-watershed basic reference map (1:50,000).
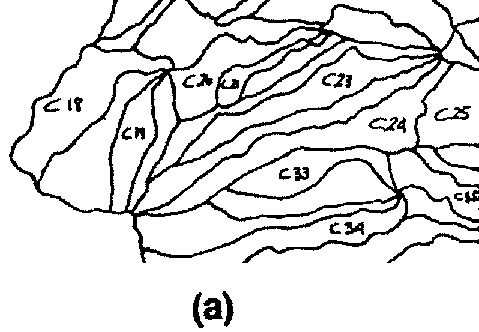
(b) Land-use and vegetation cover photo-interpretation and resulting polygons (@ 1:30,000).
(c) Final land-use/vegetation cover mapped on the sub-watershed reference map (1:50,000).
Step 6: Preparation of soil protection map
The map of soil protection levels is obtained by applying the matrix presented in Table I-8.
Applying the matrix and legend given in Table I-8, the boundaries between polygons with equal levels of soil protection are deleted (see Fig. I-10).
Table I-8. Matrix: Land use vs. vegetation cover
Land use |
Vegetation cover |
|||
1 |
2 |
3 |
4 |
|
1 |
5(MB) |
5(MB) |
4(B) |
4(B) |
2 |
5(MB) |
5(MB) |
4(B) |
3(M) |
3 |
3(M) |
2(A) |
1(MA) |
1(MA) |
4 |
4(B) |
3(M) |
2(A) |
1(MA) |
5 |
5(MB) |
4(B) |
3(M) |
2(A) |
6 |
5(MB) |
4(B) |
3(M) |
2(A) |
Levels of soil protection (Legend):
1. Very high (MA)
2. High (A)
3. Medium (M)
4. Low (B)
5. Very low (MB)
Step 7: Preparation of erosion status map
The erosion map is the final output of the predictive phase, and the result of overlaying erodibility and soil protection level maps.
The overlaying procedure is performed applying the matrix presented in Table I-9.
EROSION STATUS
Table I-9. Matrix: Level of soil protection vs. level of erodibility
Level of soil protection |
Level of erodibility |
||||
1(EN) |
2(EB) |
3(EM) |
4(EA) |
5(EX) |
|
1 (MA) |
1 |
1 |
1 |
2 |
2 |
2(A) |
1 |
1 |
2 |
3 |
4 |
3(M) |
1 |
2 |
3 |
4 |
4 |
4(B) |
2 |
3 |
3 |
5 |
5 |
5(MB)2 |
2 |
3 |
4 |
5 |
5 |
Legend (Codification) of erosive status.
5. very high.
4. high.
3. appreciable.
2. low.
1. very low.
Sequences of step 7 are shown in Fig. I-11, and the final output is the erosion status map.
Figure I-10. Soil protection map processing
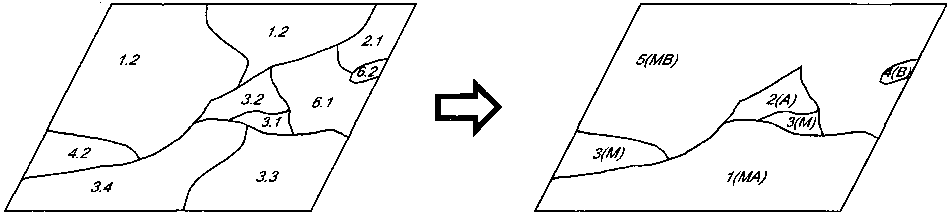
Figure I-11. Erosion map processing