![]()
![]()
![]()
1.1 Present situation
1.2 Consumption patterns
1.3 Spatial patterns in the fuelwood flow
1.4 Purpose and scope of the study
1.5 Why study gender aspects?
The importance of woodfuel as a primary source of energy is often associated with its widespread use in the domestic sector as the sole source of cooking energy, as well as in home-based and village-based industries. The renewability of woodfuel makes it economically attractive and its production has been widely promoted in order to save the expenditure on the import of alternative commercial energy types like petroleum, electricity etc. and to support local sustainability. International agencies like the RWEDP of the FAO have influenced Sri Lanka to address, particularly since the 1980's, the issues pertaining to woodfuel production, transportation, marketing and the efficient management of consumption at the national level.
A significant attempt has been made to integrate the national concerns over fuelwood production into national forestry policies and improving non-forest production systems has been identified as a means to relieve the pressure on forests and to meet the people's woodfuel needs (Nanayakkara, 1990; and FSMP, 1995).
Biomass energy has remained a popular source of energy in Sri Lanka. The practice of using 'fuelwood', the non-converted raw wood, rather than converted woodfuel types like charcoal, has remained unchanged for generations. The most influential factor here is not the reluctance of the people to adopt converted types of woodfuel, but the practice of gathering fuelwood freely from whichever sources are available within an accessible distance. The advantage of using fuelwood, even in the situations where procuring and portaging are cumbersome, is that users do not have to bear the cost of raw materials, conversion, and transport.
The consumption of a whole cluster of biomass including wood sticks, split wood, husks, crop residues etc. seems to be much cheaper than using one solid type of woodfuel, so, 'fuelwood' remains a common type of energy. The household sector consumes the bulk of the fuelwood in Sri Lanka because of its comparative advantages. It either incurs no financial costs or is cheaper to use. The end users, primarily the majority in the household sector, do not depend on external resources or delivery systems. The locally available sources and resources enable local people to satisfy their needs locally by allocating family labour for gathering and portaging. Under these circumstances, women's greater involvement in gathering fuelwood as part of their household responsibilities has tended to continue in rural areas.
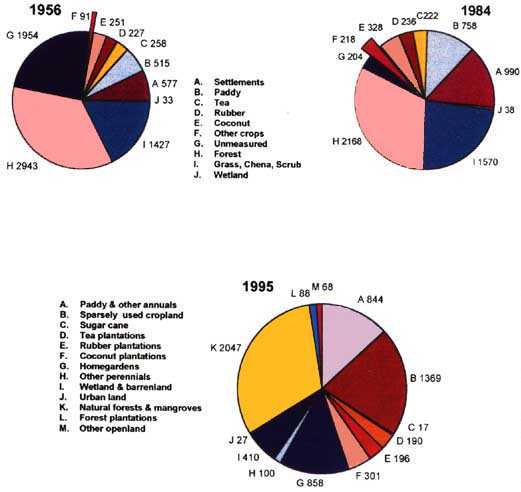
However, there is a wide spatial disparity in the distribution of woodfuel sources like forests, tree crop plantations, homegardens, common lands etc. Further disparities exist in regard to fuelwood types, which include species as well as the type of biomass used. While more than three fourths of the country's forest cover is located in the dry zone (See Figure 1), the trends in landuse point to the fact that more and more forests and other land is being converted to non-forest uses including settlements (see Figure 2).
Figure 1: Spatial distribution of forest cover in Sri Lanka in 1992
Figure 2 : Land use in Sri Lanka in 1956, 1984 and 1995 (in thousands of hectares)
TABLE 1: LAND USE PROJECTIONS ('000 HA.)
|
Land use category |
1995 |
2000 |
|
Paddy and other annuals |
844.4 |
844.4 |
|
Sugarcane |
16.8 |
16.8 |
|
Sparsely use cropland |
1393.8 |
1436.1 |
|
Tea plantations |
189.8 |
189.8 |
|
Rubber plantations |
193.6 |
188.8 |
|
Coconut plantations |
300.7 |
300.7 |
|
Homegardens |
918.3 |
949.4 |
|
Other perennials |
101.6 |
104.1 |
|
Wetland and barren land |
410.3 |
410.3 |
|
Urban land |
27.6 |
29.2 |
|
Natural forests and mangroves |
1961.2 |
1834.8 |
|
Forest plantations |
92.3 |
100.0 |
|
Other open land |
65.3 |
111.3 |
|
Total |
6515.7 |
6515.7 |
Source: FSMP, 1995.
According to FSMP (1995), if current trends continue a number of changes will take place (Table 1) regarding land use. Between 1995 and 2000 a clear expansion of sparsely used croplands, homegardens, urban land, forest plantations, and other perennials and croplands will tend to occur.
Similarly, a further reduction in the natural forest cover of the country and the conversion of some areas currently under rubber plantations to other uses have been predicted. How impacts of these losses/trends on the fuelwood situation should be addressed by introducing coping strategies into energy consumption behavior is an important issue pertaining to the country's regional development.
Although the forest cover has been continuously decreasing, Sri Lanka is fortunate when compared with other countries in the region as it has diverse sources of fuelwood supply. Of the total of 6.5 million hectares of land, the area under forests has been reduced to isolated islands. The total area under closed-canopy forest cover has been reduced from 80% in 1881 to about 24% in 1992. Based on the trends in the forest cover it has been projected that the natural forest cover of the country (exclusive of riverine, sparse forest and mangroves) will be about 22.8% in 1995, and it will be further reduced to about 21.3% by the year 2000. When compared with the proportion of the population depending on fuelwood, which is about 93.8%, the decreasing forest cover points to two crucial consequences: high pressure on the available sources of supply and fuelwood scarcities.
As a result of the depletion of forest resources, their contribution to the fuelwood supply has been reduced. The supply as a whole is dominated by non-forest production systems (see Table 2). The country must be well-equipped not only to match the demand and supply but also to ensure that the systems of fuelwood flow are maintained to satisfy the consumers and producers and to address the issue of spatial disparities.
TABLE 2: ESTIMATED SOURCES OF BIO-ENERGY SUPPLY
|
Source |
Percentage share |
|
Homegardens |
26 |
|
Cropland |
19 |
|
Coconut |
19 |
|
Rubber |
7 |
|
Processing residues |
3 |
|
Natural forests |
7 |
|
Forest plantations |
4 |
|
Others |
14 |
Source: FSMP, 1995
Despite the well-marked spatial disparities in the distribution of production sources, the share of bio-energy in total energy consumption has been exclusively high when compared with other types like petroleum and electricity. In 1992, for instance, bio-energy accounted for about 66% of the total energy consumption in Sri Lanka (see Figure 3). Bio-energy comprises fuelwood (67%), and crop residues (33%). According to the surveys carried out in 1993 for the preparation of the Forestry Sector Master Plan (FSMP), fuelwood alone contributes nearly 44% of the country's total energy consumption, while crop residues, mainly from coconut, contribute nearly 22%. The important changes in the energy consumption patterns are connected with the increased demand for energy since the 1970s. Its consumption has increased an average of 2.33 percent per year between 1982-1992. The increase in consumption in the household sector has been faster than that in the commercial sectors. The household sector consumed 81% of the bio-energy in 1992, while the industry sector used nearly 16%. The implications of these figures for fuelwood production, flow and commercial use are crucial, because in spite of the depletion of forest cover and the expansion of settlements etc., national fuelwood requirements are on the increase. The total fuelwood consumption by households was nearly 8 million tonnes in 1993. However, the forestry sector shows that its contribution to the energy sector has not been fully recognized.
While a number of commercial energy types are used in Sri Lanka, woodfuel has remained critically important in the domestic sector (See Table 3). According to the Forestry Sector Master Plan, the total consumption of bio-energy by households in 1993 was estimated at about 8.15 million tonnes, and this is to be increased to 8.82 million tonnes in 2020 (FSMP, 1995). The estimated consumption by the industrial sector is to be 1 million tonnes. The same estimates have shown that between 1993 and 2020 the tendency in the household sector is for consumption to increase from 8.15 million tonnes to 8.82 million tonnes; whereas in the industrial and commercial sectors the tendency is to decrease consumption from 1.02 million tons to 0.82 million tonnes between 1993-2020, due to the adoption of improved technology and efficiency. Although the expected increase primarily in the household sector does not point to a dramatic increase in demand, with the depletion of forests and the conversion of lands to settlements etc. the share derived from homegardens, coconut, rubber and croplands comes to about 71% of the total supply. Under the present conditions the non-forest production systems are the major supply sources.
This situation suggests a few defining features. The first is that production is heavily dependent on the private sector, both on small-scale units of production and tree crop plantations. The second is that while a spatial imbalance in production is determined by the land use, the consumption patterns are associated with the distribution of population, and industrial and commercial activities. Improving the flow of fuelwood is a way to smoothen out the acute scarcities faced by the end users and excess production, and also the spatial imbalances.
TABLE 3: THE SECTORAL ENERGY SUPPLY AND CONSUMPTION
|
|
Household sector % |
Industry sector % |
|
Fuelwood and other bio-energy |
87.5 |
59 (includes agro-residues) |
|
Hydro-electricity |
6.6 |
25 |
|
Oil |
- |
16 |
|
Kerosene |
4.8 |
- |
|
LPG |
1.1 |
- |
|
TOTAL |
100 |
100 |
Source: Sri Lanka Energy Balance, 1992.
According to the results of the survey conducted in 1993 for the preparation of the FSMP, other types of energy are slowly being substituted for bio-energy due to the increasing cost of fuelwood. The consumption of fuelwood by the industrial and commercial sub sectors in 1993, shows that the tea industry is the main consumer (see Table 4). The spatial distribution of these industries and commercial sectors tends to decide the patterns of commercial woodfuel flows and the concentration of trade and processing activities.
The analysis of the present scenarios and trends in the woodfuel sector and of the projections made for the preparation of the FSMP in Sri Lanka indicates that 8 administrative districts experience woodfuel shortages. Sixteen districts are noted to produce surpluses, while in one district, the Kandy district, demand and consumption are almost equal. The overall country situation in 1995, according to the FSMP projections, was favourable, because while total demand was projected at 9.2 million tonnes of biomass energy the country's supply was projected at about 9.8 million tonnes. Projections for the year 2020 indicate that the country will continue to produce a surplus. While the demand is expected to be about 9.7 million tonnes per annum, the biomass supply will be about 10.1 million tonnes. In such a scenario biomass accessibility and biomass trade mechanisms will have important implications for woodfuel consumption.
FIGURE 3: ENERGY CONSUMPTION SHARES IN 1992 BY TYPE
The flow of fuelwood from production areas/systems to the consumers is controlled by intermediaries. Fuelwood availability as well as its scarcity are complex issues. Both depend on what types of fuelwood are needed and on the level of consumption. Biomass fuel as a whole comprises dense wood, small branchwood, twigs, wood shavings, crop residues etc. The users' selection tends to vary according to the use, while the traders' choice depends on the transportability, profitability of sales, and the market. The type of fuelwood available for transportation or random gathering cannot be generalized because in most cases the flow patterns are determined by what is available, preferred and demanded by the end users.
TABLE 4: ESTIMATED CONSUMPTION OF FUELWOOD BY THE INDUSTRIAL AND COMMERCIAL SUB-SECTOR IN 1993
|
Sub-sector |
Consumption ('000 tonnes) |
% share |
|
Tea curing |
455 |
43.2 |
|
Hotels & eating houses |
164 |
15.6 |
|
Brick & tile manufacturing |
150 |
14.2 |
|
Coconut |
51 |
4.8 |
|
Bakery |
99 |
9 |
|
Rubber |
72 |
6.8 |
|
Tobacco |
13 |
1.2 |
|
Others |
49 |
4.7 |
|
Total |
1,053 |
100 |
Source: FSMP, 1995.
Howes and Endagama (1995), based on an extensive study conducted in Sri Lanka, divided the fuel used by domestic and industrial consumers into 3 categories. These include 'exportable fuelwood', 'other fuelwood' and 'other fuel'. The 'exportable wood' comprises rubber wood, and coconut and forest wood and accounts for nearly 57.8% of the total, which is equivalent to about 9,556.5 thousand tonnes. In fact this category accounts for almost all the industrial biomass fuel and the greatest portion of transacted fuels.
The 'other fuelwood' category which comprises many types of fuelwood coming from homegardens, croplands etc., accounts for nearly 12.8% of the total, which is equivalent to 2,128.3 thousand tonnes. The category referred to as 'other fuel' comprises crop wastes and is made up of coconut by-products from plantations and homegardens and accounts for nearly 28.8% of the total, which is equivalent to 4,759.1 thousand tonnes.
As 'exportable fuelwood' comes from large-scale production systems which are primarily located in the wet zone and from the dry zone forests (see Figure 4), industrial and commercial consumers heavily depend on the systems of trade and market flows. The availability of 'other fuelwood' and 'other fuel' depends on the locality, resource distribution etc. The flow patterns are connected with the location of producing areas relative to consumers and the type of fuelwood available and needed. The flow patterns are interregional and intra-regional as well as local. The four districts in the hill country, according to the analysis of Howes and Endagama (1995), are among the fuelwood deficit areas. The national scenario constructed by these authors divides the country into 5 zones on the basis of the fuelwood balances - which refers to the total production less the total consumption (see Table 5). In preparing the national scenario the following features have been taken into account:
i Overall biomass deficit areas - where consumption exceeds production and a large amount of fuelwood has to be imported;ii Fuelwood deficit areas - the gap between production and consumption is not so wide, some quantities are imported;
iii Self sufficient areas - an overall balance is noted and no exportable surplus is available;
iv Rubber wood exporting areas are noted with a significant surplus of rubber wood so export is significant;
v Fuelwood exporting areas - sufficient surplus of other forms of fuelwood is available to export;
vi Potential exporting areas - at present an unutilized large surplus of exportable fuelwood is available.
Data presented according to the above categorization reveals that the issue is not the deficit at national level but the spatial imbalances among production and consumption areas that have to be smoothed out through appropriate transport mechanisms. Moreover, the balance between production and consumption depends on the distribution of forests, the non-forest production systems with fuelwood producing potential, and the consumption. The exportable commercial woodfuel supply is dominated by natural forests, rubber and coconut. The bulk of commercial fuelwood comes from natural forests, so in the flow patterns, fuelwood transportation from dry zone forests to the wet zone can be noted. Rubber wood is exported mostly for industrial and commercial uses, so, among non-forest fuelwood, it dominates the commercial flow.
The present situation points to a number of important features. The first is that even where fuelwood is not scarce at the national level, the intra-regional spatial differences in the distribution of resources, resource ownership patterns and demand can lead to fuelwood scarcities among users and to excess production. The second feature is that where conventional practices like free gathering of multiple products are continuing, a greater transition from free gathering to commercialisation cannot be expected, although flow patterns can be traced. The third feature is that there is no complete picture regarding the locally prevailing patterns in the fuelwood flow due to its wider use to meet the needs of daily life and of the village-based industries which do not operate under formal systems. The fourth feature is connected with the informal and irregular nature of the fuelwood flow from the production areas to the market areas. The final and most crucial feature is the dependence of the market flow on intermediaries while free flow systems are dominated by women. A proper coverage of these cannot be provided without a broad field investigation over a long period of time which takes into account diverse spatial situations.
The purpose of the field investigation, conducted in Sri Lanka between October 1996 - July 1997, was to examine men's and women's roles in the woodfuel flow mechanism as well as their patterns of engagement in woodfuel related activities. These activities include harvesting, trimming, wholesaling, transporting, processing and marketing etc. and are (or at least some of them are) subjected to gender specific divisions of labour. The flow mechanism includes the flow of woodfuel through market channels for household consumption, industries and other commercial uses as well as the free gathering and portaging from supply sources to consumption areas/units.
FIGURE 4: THE SPATIAL FEATURES RELEVANT TO WOODFUEL PRODUCTION BY DISTRICTS
TABLE 5: AREAS WITH WOODFUEL SURPLUS AND DEFICIT BY DISTRICTS
|
Category |
District |
Zone |
Overall balance '000 tonnes1 |
Fuelwood balance '000 tonnes2 |
Price rank |
|
Overall deficit
|
Colombo |
Wet Low |
-373 |
-399 |
5 |
|
Kandy |
Up-country |
-333 |
-436 |
7 |
|
|
Gampaha |
Wet Low |
-228 |
-210 |
4 |
|
|
Nuwara Eliya |
Up-country |
-176 |
-292 |
1 |
|
|
Badulla |
Up-country |
-90 |
-172 |
2 |
|
|
Fuelwood deficit
|
Matale |
Up-country |
4 |
-34 |
12 |
|
Matara |
Wet Low |
71 |
-85 |
8 |
|
|
Galle |
Wet Low |
77 |
-52 |
18 |
|
|
Jaffna |
Dry |
81 |
-172 |
9 |
|
|
Hambantota |
dry |
111 |
-9 |
10 |
|
|
Self- sufficient
|
Batticaloa |
Dry |
123 |
86 |
5 |
|
Ratnapura |
Wet Low |
270 |
56 |
11 |
|
|
Kurunegala |
Wet Low |
774 |
72 |
14 |
|
|
Rubber wood exporting
|
Kalutara |
Wet low |
178 |
177 |
16 |
|
Kegalle |
wet low |
403 |
240 |
13 |
|
|
Fuelwood exporting
|
Amparai |
Dry |
591 |
584 |
19 |
|
Mullaitivu |
Dry |
853 |
808 |
22 |
|
|
Polonnaruwa |
Dry |
808 |
789 |
23 |
|
|
Anuradhapura |
Dry |
809 |
792 |
24 |
|
|
Monaragala |
Dry |
1110 |
1064 |
17 |
|
|
Potential exporting
|
Trincomalee |
Dry |
513 |
517 |
20 |
|
Mannar |
Dry |
570 |
477 |
15 |
|
|
Vavuniya |
Dry |
578 |
568 |
21 |
|
|
Puttalam |
Dry |
640 |
405 |
3 |
Source: Howes et. al., 1995.1 Includes both fuelwood (e.g. rubber wood, coconut wood) and crop residues (e.g. tea clippings, coconut leaves);
2 Includes only fuelwood
The scope of the study covers the identification of the multiple activities undertaken by men and women in the woodfuel flow and the determination of the levels of their involvement in these activities and the roles they perform to sustain flow mechanisms. But it should be noted that the presence or absence of specific gender patterns in the collection of fuelwood for self-consumption and in trade are of equal importance for the development of wood energy.
Two geographical areas were selected for the study. These include:
I. Kandy urban area - where interregional trade takes place. The administrative centre of the district is the location of woodfuel depots, transporters, centres dealing with processing, wholesaling, delivering and retailing. The involvement of intermediaries is clear in the transportation in the commercial flow systems. These reasons made Kandy an ideal choice for detailed investigation to construct an urban woodfuel flow scenario. Another specific factor influencing this selection is that the Kandy district scenarios constructed for the FSMP, and by Howes and Endagama (1995), reveal some contradictions regarding the fuelwood balance.II. Kundasale - located in the outskirts of Kandy urban area. After a reconnaissance visit Kundasale was selected for 3 reasons. The first is that a range of woodfuel based industries is located in the area so the system is marked by specific consumption patterns, especially in terms of fuelwood types. The second reason is that its rural setting offered opportunities to investigate a range of activities related to harvesting and processing which could not be fully covered in an urban area. The third reason is that the preliminary visits to the area revealed that it was suitable for investigating intra-regional flow mechanism which could broaden our understanding of the local woodfuel trade. To understand the links between gender specific patterns in the division of activities and woodfuel flow mechanisms it was necessary to observe the situations where men and women were directly involved in wodfuel related activities.
The selection of Kandy urban area and Kundasale Administrative Division was complementary in that they helped the researchers construct a comprehensive picture which included both internal and regional flow mechanisms. The investigation in Kandy urban area helped the researchers construct a picture of the interregional flow mechanisms. This area is characterised by a large-scale flow from remote production areas to the wholesalers, and then to an internal delivery system. The management of the flow is in the hands of the intermediaries.
The investigation in Kundasale helped to develop an understanding of how the woodfuel flow is linked with local mechanisms which operate informally and are controlled by a number of small-scale woodfuel suppliers or directly by the producers. The two systems are, to some extent, contrasting. The first operates under external governance and the second is local resource-based and community-based.
In terms of gender, the investigation was to determine whether, and to what extent, equal or equitable opportunities for participation are available for both genders in both rural and urban areas, particularly when the woodfuel flow is controlled by external agents such as traders.
Gender is one of the predominant features in society which influences the behavioural patterns of the two social groups, men and women, particularly those related to the allocation of intra household resources or extra household resource management tasks. Within the context of woodfuel flows gender plays an important and wide ranging role - from managing fuelwood supply sources to consumption. Gender is the least explored aspect of the commercial woodfuel flow, especially in the case of timber. Some aspects pertaining to the gathering of fuelwood for self-consumption have been randomly investigated. In almost all institutions in the production hierarchy, which include households as well as industrial production units and services, most activities are divided between men and women and certain patterns have evolved in the division of their labour, allocation of time, occupation of space/locations and control over resources etc. In association with gender ideology and the division of tasks and responsibilities certain constraints on the equal distribution of benefits have also been established. Under such circumstances the social construct of men's and women's roles, or gender, is a crucial socio-economic variable in the analysis of the commercial woodfuel flow.
Our understanding of who does what, why one gender specifically attends to certain tasks but not to others, why one gender benefits more from the production and sale of fuelwood than the other has direct development implications. A study of the gender aspects of the commercial woodfuel flow will point to the issues which are outside the household maintenance and survival domain and focus on income generation through woodfuel related activities. Clearly, the woodfuel trade can provide income earning opportunities and thus help to uplift living standards, and is thus of vital importance to any strategies aimed at improving women's lives.
In this study an attempt has been made to understand how, conventional ideology related to gender is re-enforced in the commercial and non-commercial fuelwood flow mechanisms. Women, due to their biological status, are recognized as the reproducers; so household maintenance, including the provision of fuelwood, has been combined with their reproductive roles and domestic chores. Men are more recognised as producers of goods and earners of cash. Men's greater ownership of resources and their mobility are conventionally accepted as essential for their productive work. Such socially constructed features of gender are seen throughout woodfuel systems and are related to producers, traders and end users.
As the primary focus of this study is 'woodfuel flows', gender aspects of the production and consumption of woodfuel have not been fully covered owing to constraints on time and resources. But this lesser emphasis is not an acknowledgement that they are less important to woodfuel flows.
The benefits that men and women derive from their involvement in the woodfuel sector, other than fulfilling conventional basic needs, are of immense importance in energy development. A vast amount of literature pertaining to women and fuelwood has contributed to broadening our understanding and has drawn attention to the crucial issues that women face as gatherers and consumers of biomass fuel. Gender aspects of non-commercial woodfuel flows have been covered with the focus being on exploring how women are engaged in the energy sector and how their time is allocated, (i.e. Tinker, 1990; Keenmar et al, 1988; Wickramasinghe, 1991; 1997; Agarwal, 1986). Women and energy issues have been discussed by many authors (Agarwal, 1986) and such discussions have influenced energy development policies. However, according to Cecelski (1995) some policy issues relevant to gender research, namely the promotion of energy transitions, energy efficiency, renewable energy and sustainable transport have been neglected.
![]()
![]()
![]()