![]()
![]()
3.1. Water source protection
3.2 User group capacity
3.3 Evaluation methods
Water source protection and related water supply systems are a major activity of great importance to rural mountain communities. Time and again it was the most popular activity coming out of participatory planning exercises. It is also an entry point activity when starting a rural development program in mountainous areas. To function properly and on a sustainable bases, strong and self-reliant user groups are needed to take care of and maintain the installations.
The most obvious water sources, with high and permanent water discharge levels tend to be treated first. In due course, more marginal sources are identified by the local population for treatment. Clear criteria have so far not been defined for water source protection works. Some of the potential criteria, such as quantity of water discharge in the dry season, may be difficult to assess during a (participatory) feasibility study, unless this feasibility study also takes place in the dry season.
The clear improvements between 1996 and 1997 in care and maintenance of the protected water sources was linked to the strengthening of local user groups during this period. It should be noted, that it were in particular women groups that actually gained in numbers and strength, while some of the male dominated groups have quietly passed away. The fact that nowadays most agreements for water source protection works are made with women groups is largely due to the stringent criteria set by the project for groups to get assistance (regular savings, regular meetings and record keeping, as well as self-initiated activities).
It is recommended to continue to apply such stringent criteria to user groups, in particular in water source protection works, and to encourage women groups to take up responsibility for construction and maintenance for such works through signed agreements. Field staff, in particular (usually male) mid-level technicians dealing with water source protection, should be aware of the important role that self-reliant user groups, and in particular women groups, play in the care and maintenance of these installations, and handle accordingly.
The evaluation was short, simple, easy to handle, and quickly executed and analyzed. The results were very interesting, in particular also because a comparison could be made with a previous evaluation. There has been a clear added value of the repeated evaluation on an annual basis. It is recommended to continue to repeat the evaluation exercise on an annual basis.
However, a number of questions were raised that remained unanswered, such as:
(i) What are the actual user groups involved in care and maintenance of the (older) protected water sources;(ii) How do user groups actually organize maintenance; and
(iii) How is the water actually being used.
It is recommended to include these questions in the next evaluation, in a simple and practical way.
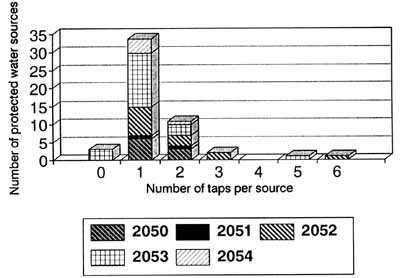
Table 1. Number of water sources protected and number of taps and water points per protected source as per Jesth 2054 (May-June 1997), detailed per year of completion.
|
Number of taps per protected water source |
Number of protected water source/completion year |
Total water taps |
Total water points |
|||||
|
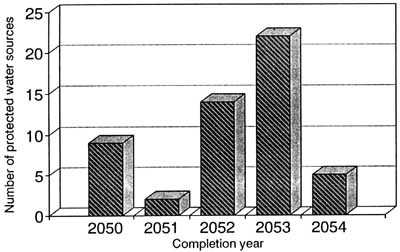
2050 |
2051 |
2052 |
2053 |
2054 |
Total |
|||
|
No tap ("kuwa") |
|
|
|
3 |
|
3 |
|
3 |
|
1 tap |
6 |
1 |
8 |
15 |
4 |
34 |
34 |
34 |
|
2 taps |
3 |
1 |
3 |
3 |
1 |
11 |
22 |
22 |
|
3 taps |
|
|
2 |
|
|
2 |
6 |
6 |
|
4 taps |
|
|
|
|
|
|
|
|
|
5 taps |
|
|
|
1 |
|
1 |
5 |
5 |
|
6 taps |
|
|
1 |
|
|
1 |
6 |
6 |
|
Total |
9 |
2 |
14 |
22 |
5 |
52 |
73 |
76 |
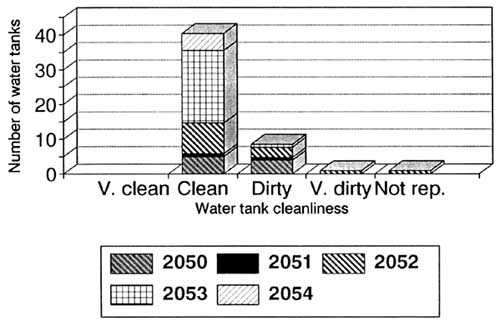
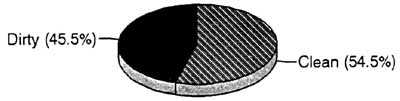
Table 2. Cleanliness of water tanks in Jesth 2054 (May-June 1997), detailed per year of completion.
|
Water tank cleanliness status |
Number of water tanks/completion year |
Total |
||||
|
2050 |
2051 |
2052 |
2053 |
2054 |
||
|
Very clean |
|
|
|
|
|
|
|
Clean |
5 |
1 |
9 |
21 |
5 |
41 |
|
Dirty |
4 |
1 |
3 |
1 |
|
9 |
|
Very Dirty |
|
|
1 |
|
|
1 |
|
Not reported |
|
|
1 |
|
|
1 |
|
Total |
9 |
2 |
14 |
22 |
5 |
52 |
Table 3. Tank cleaning arrangements (detailed per completion year).
|
Tank cleaning arrangements |
Number of water tanks/completion year |
Total |
||||
|
2050 |
2051 |
2052 |
2053 |
2054 |
||
|
Yes |
5 |
1 |
9 |
19 |
5 |
39 |
|
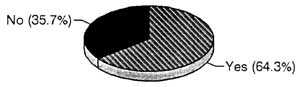
No |
4 |
1 |
5 |
3 |
|
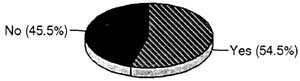
13 |
|
Total |
9 |
2 |
14. |
22 |
5 |
52 |
Table 4. Relation between tank cleaning arrangements and tank cleanliness.
|
Water tank cleanliness status |
Water tank cleaning arrangements |
Total |
|
|
Yes |
No |
||
|
Very clean |
|
|
|
|
Clean |
39 |
2 |
41 |
|
Dirty |
|
9 |
9 |
|
Very dirty |
|
1 |
1 |
|
Not reported |
|
1 |
1 |
|
Total |
39 |
13 |
52 |
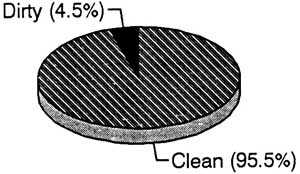
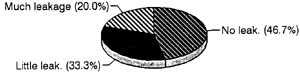
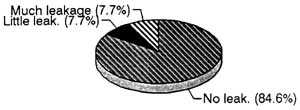
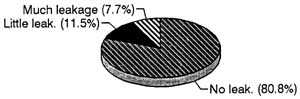
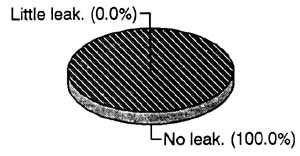
Table 5. Water taps pipe leakage in Jesth 2054 (May-June 1997), detailed by completion year.
|
Water taps pipe leakage |
Number of taps/completion year |
Total |
||||
|
2050 |
2051 |
2052 |
2053 |
2054 |
||
|
No leakage |
7 |
|
22 |
21 |
6 |
56 |
|
Little leakage |
2 |
3 |
2 |
3 |
|
10 |
|
Much leakage |
3 |
|
2 |
2 |
|
7 |
|
Total |
12 |
3 |
26 |
26 |
6 |
73 |
Table 6. Presence and functioning of water taps at tap stands in Jesth 2054 (May-June 1997) detailed per completion year.
|
Tap presence and functioning |
Number of tap stand/completion year |
Total |
||||
|
2050 |
2051 |
2052 |
2053 |
2054 |
||
|
Not present |
1 |
1 |
4 |
3 |
1 |
10 |
|
Not working |
|
|
4 |
1 |
|
5 |
|
Working |
11 |
2 |
18 |
22 |
5 |
58 |
|
Total |
12 |
3 |
26 |
26 |
6 |
73 |
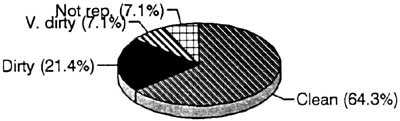
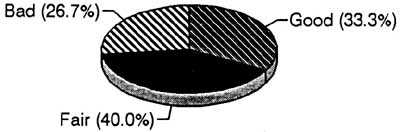
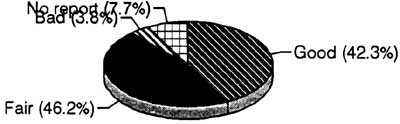
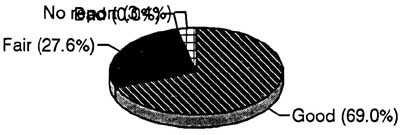
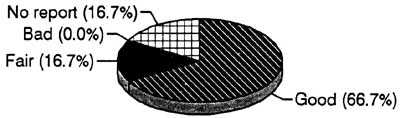
Table 7. Water point sanitary conditions in Jesth 2054 (May-June 1997), detailed per completion year.
|
Sanitary conditions |
Number of water points/completion year |
Total |
||||
|
2050 |
2051 |
2052 |
2053 |
2054 |
||
|
Good |
5 |
|
11 |
20 |
4 |
40 |
|
Fair |
3 |
3 |
12 |
8 |
1 |
27 |
|
Bad |
4 |
|
1 |
|
|
5 |
|
Not reported |
|
|
2 |
1 |
1 |
4 |
|
Total |
12 |
3 |
26 |
29 |
6 |
76 |
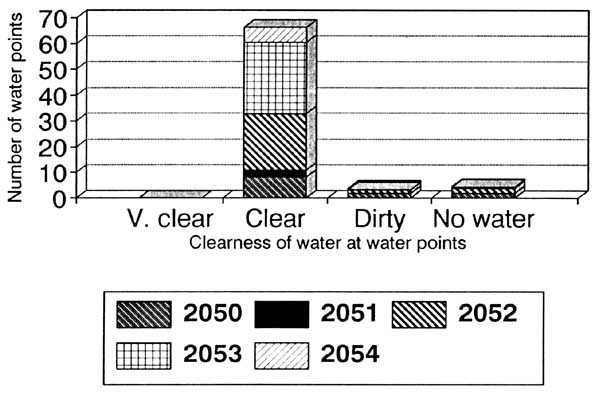
Table 8. Clearness of water at water points, in Jesth 2054 (May-June 1997), detailed per year of completion.
|
Clearness of water |
Number of water points/completion year |
Total |
||||
|
2050 |
2051 |
2052 |
2053 |
2054 |
||
|
Very clear |
|
|
|
|
|
|
|
Clear |
8 |
3 |
22 |
28 |
6 |
67 |
|
Dirty |
2 |
|
2 |
|
|
4 |
|
No water/no report |
2 |
|
2 |
1 |
|
5 |
|
Total |
12 |
3 |
26 |
29 |
6 |
76 |
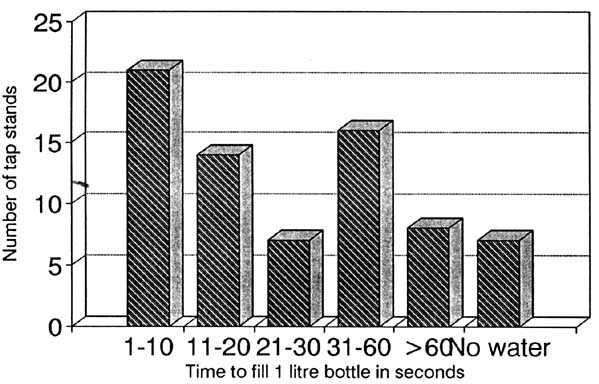
Table 9. Quantity of water flow from water taps in Jesth 2054 (May-June 1997), expressed in seconds to fill a 1 liter bottle, detailed per completion year.
|
Number of seconds to fill 1 liter |
Number of water taps/completion year |
Total |
||||
|
2050 |
2051 |
2052 |
2053 |
2054 |
||
|
1-10 |
4 |
1 |
3 |
11 |
2 |
21 |
|
11-20 |
3 |
|
5 |
6 |
|
14 |
|
21-30 |
|
1 |
3 |
3 |
|
7 |
|
31-60 |
3 |
1 |
6 |
3 |
3 |
16 |
|
More than 1 minute |
|
|
5 |
2 |
1 |
8 |
|
No water/no report |
2 |
|
4 |
1 |
|
7 |
|
Total |
12 |
3 |
26 |
26 |
6 |
73 |
Figure 1. Number of sources protected - Detailed per completion year
Figure 2. Number of taps per source - Detailed per completion year
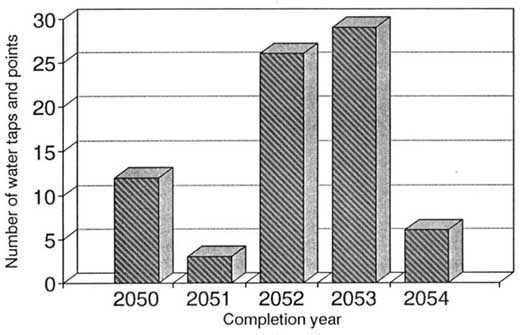
Figure 3. Number of water taps/points - Detailed per completion year
Figure 4. Water tank cleanliness - Detailed per completion year
Figure 5a. Water tank cleanliness - Tanks completed in 2050 and 2051
Figure 5b. Water tank cleanliness - Tanks completed in 2052
Figure 5c. Water tank cleanliness - Tanks completed in 2053
Figure 5d. Water tank cleanliness - Tanks completed in 2054
Figure 6a. Tank cleaning arrangements - Tanks completed in 2050 and 2051
Figure 6a. Tank cleaning arrangements - Tanks completed in 2052
Figure 6a. Tank cleaning arrangements - Tanks completed in 2053
Figure 6a. Tank cleaning arrangements - Tanks completed in 2054
Figure 7a. Water taps pipe leakage - Completed in 2050 and 2051
Figure 7b. Water taps pipe leakage - Completed in 2052
Figure 7c. Water taps pipe leakage - Completed in 2053
Figure 7d. Water taps pipe leakage - Completed in 2054
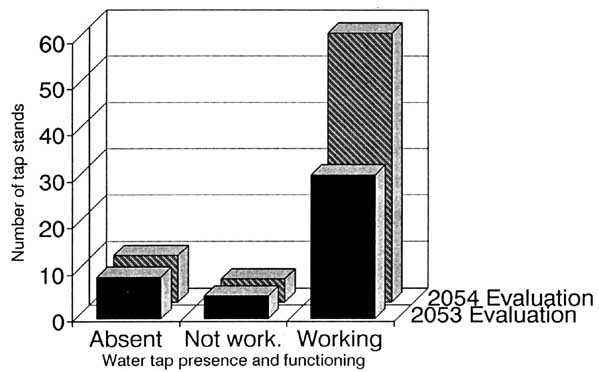
Figure 8a. Functioning of water taps - Comparison of 2053 and 2054 evaluation
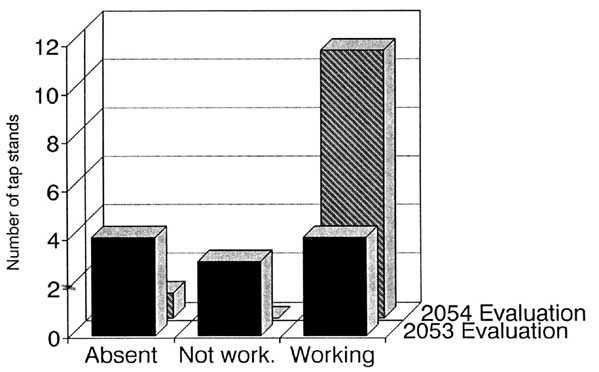
Figure 8b. Water taps completed in 2050 - Comparison of 2053 and 2054 evaluation
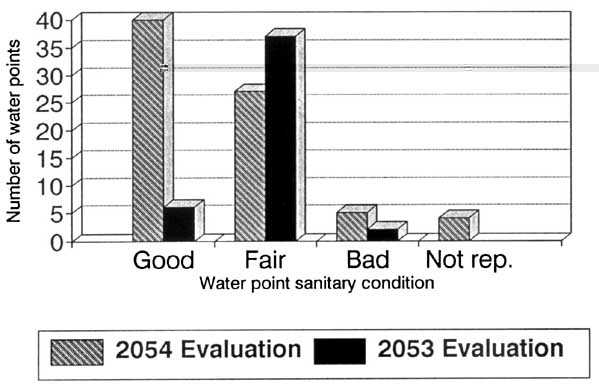
Figure 9a. Water point cleanliness - Comparison of 2053 and 2054 evaluation
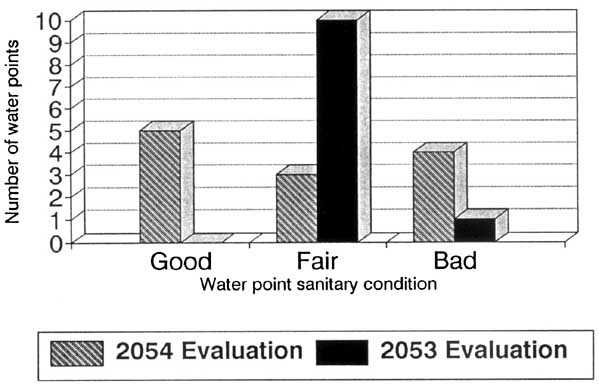
Figure 9b. Water taps completed in 2050 - Comparison of 2053 and 2054 evaluation
Figure 10a. Water point cleanliness - Completed in 2050 and 2051
Figure 10b. Water point cleanliness - Completed in 2052
Figure 10c. Water point cleanliness - Completed in 2053
Figure 10d. Water point cleanliness - Completed in 2054
Figure 11. Clearness of water - Detailed per completion year
Figure 12. Quantity of water flow - Time to fill 1 litre at taps stands
REPORTS QUOTED
|
Field Document 6/96: |
Strengthening the participatory process through community based evaluation and re-planning workshops (Report of a pilot experience carried out by local user groups and project staff in Majghaon Village, Chhoprak VDC (Bhusunde Khola watershed, 10-11 October 1996). |
|
Field Document 1/97: |
Results of the 1996 dry season evaluation of water source protection activities completed in 1993-1995. |
|
Field Document 3/97: |
Participatory Rural Appraisal and Planning in the Bhusunde Khola watershed from October 1995 to January 1996. |
|
Field Document 4/97: |
Participatory implementation in 1996 and 1997 of 26 community action plans formulated between October 1995 and January 1996 in the Bhusunde Khola watershed. |
![]()
![]()