


Table 34 List prices (September 1998) of various dimensions of rough sawnwood made from: Gronfolo
|
Dimension |
Price per m length (in Sf) |
Price per m3 (in Sf) |
||
|
(in inches) |
1st quality |
2nd quality |
1st quality |
2nd quality |
|
1 x 2 |
100 |
50 |
77,500 |
38,750 |
|
1 x 3 |
175 |
88 |
90,417 |
45,208 |
|
1 x 4 |
225 |
113 |
87,188 |
43,594 |
|
1 x 5 |
300 |
150 |
93,000 |
46,500 |
|
1 x 6 |
350 |
175 |
90,417 |
45,208 |
|
1 x 8 |
450 |
225 |
87,188 |
43,594 |
|
1 x 10 |
600 |
300 |
93,000 |
46,500 |
|
1 x 12 |
700 |
350 |
90,417 |
45,208 |
|
1¼ x 8 |
600 |
300 |
93,000 |
46,500 |
|
1¼ x 10 |
800 |
400 |
99,200 |
49,600 |
|
1¼ x 12 |
900 |
450 |
93,000 |
46,500 |
|
1½ x 3 |
225 |
113 |
77,500 |
38,750 |
|
1½ x 6 |
600 |
300 |
103,334 |
51,667 |
|
1½ x 8 |
700 |
350 |
90,417 |
45,208 |
|
1½ x 10 |
900 |
450 |
93,000 |
46,500 |
|
1½ x 12 |
1,050 |
525 |
90,417 |
45,208 |
|
2 x 3 |
350 |
175 |
90,417 |
45,208 |
|
2 x 4 |
450 |
225 |
87,188 |
43,594 |
|
2 x 5 |
526 |
263 |
81,530 |
40,765 |
|
2 x 6 |
700 |
350 |
90,417 |
45,208 |
|
2 x 8 |
900 |
450 |
87,188 |
43,594 |
|
2 x 10 |
1,200 |
600 |
93,000 |
46,500 |
|
2 x 12 |
1,400 |
700 |
90,417 |
45,208 |
|
3 x 3 |
600 |
300 |
103,334 |
51,667 |
|
3 x 8 |
1,350 |
675 |
87,188 |
43,594 |
Source: A medium-sized sawmill in Paramaribo
Table 35 List prices (September 1998) of various dimensions of rough sawnwood made from other mixed hardwoods
|
Dimension |
Price per m length (in Sf) |
Price per m3 (in Sf) |
||
|
(in inches) |
1st quality |
2nd quality |
1st quality |
2nd quality |
|
1 x 2 |
80 |
40 |
62,000 |
31,000 |
|
1 x 3 |
135 |
68 |
69,750 |
34,875 |
|
1 x 4 |
200 |
100 |
77,500 |
38,750 |
|
1 x 5 |
250 |
125 |
77,500 |
38,750 |
|
1 x 6 |
300 |
150 |
77,500 |
38,750 |
|
1 x 8 |
400 |
200 |
77,500 |
38,750 |
|
1 x 10 |
500 |
250 |
77,500 |
38,750 |
|
1 x 12 |
600 |
300 |
77,500 |
38,750 |
|
1½ x 3 |
200 |
100 |
68,889 |
34,445 |
|
1½ x 6 |
500 |
250 |
86,111 |
43,056 |
|
1½ x 8 |
600 |
300 |
77,500 |
38,750 |
|
2 x 3 |
300 |
150 |
77,500 |
38,750 |
|
2 x 4 |
400 |
200 |
77,500 |
38,750 |
|
2 x 5 |
438 |
219 |
67,890 |
33,945 |
|
2 x 6 |
600 |
300 |
77,500 |
38,750 |
|
2 x 8 |
800 |
400 |
77,500 |
38,750 |
Source: A medium-sized sawmill in Paramaribo
Table 36 List prices (September 1998) of various dimensions of rough sawnwood made from various species
|
Dimension |
Price per m length (in Sf) |
Price per m3 (in Sf) |
||||||
|
(in inches) |
Wana |
Other hardwoods |
Softwoods |
Wana |
Other hardwoods quality |
Softwoods |
||
|
1 x 2 |
116 |
105 |
84 |
89,900 |
81,375 |
65,100 |
||
|
1 x 3 |
193 |
175 |
140 |
99,717 |
90,417 |
72,333 |
||
|
1 x 4 |
220 |
200 |
160 |
85,250 |
77,500 |
62,000 |
||
|
1 x 6 |
415 |
377 |
302 |
107,209 |
97,392 |
78,017 |
||
|
1 x 8 |
580 |
527 |
422 |
112,375 |
102,106 |
81,763 |
||
|
1 x 10 |
756 |
687 |
550 |
117,180 |
106,485 |
85,250 |
||
|
1 x 12 |
990 |
900 |
720 |
127,875 |
116,250 |
93,000 |
||
|
1¼ x 10 |
902 |
820 |
656 |
111,848 |
101,680 |
81,344 |
||
|
1½ x 3 |
253 |
230 |
184 |
87,145 |
79,222 |
63,378 |
||
|
1½ x 8 |
902 |
820 |
656 |
116,509 |
105,917 |
84,734 |
||
|
1½ x 10 |
1,086 |
987 |
790 |
112,220 |
101,990 |
81,633 |
||
Source: A timber trader in Paramaribo
Table 37 List prices (November 1998) of rough sawnwood made from various species
|
Species and |
Price per m length (in Sf) |
Price per m3 (in Sf) |
||||||
|
dimension |
1st grade |
2nd grade |
3rd grade |
1st grade |
2nd grade |
3rd grade |
||
|
Rode Kabbes 1" x 1" |
88 |
70 |
53 |
136,400 |
109,120 |
81,840 |
||
|
Kopie 1" x 1" |
88 |
70 |
53 |
136,400 |
109,120 |
81,840 |
||
|
Mora 1" x 1" |
77 |
62 |
46 |
119,350 |
95,480 |
71,610 |
||
|
Gronfolo 1" x 1" |
55 |
44 |
33 |
85,250 |
68,200 |
51,150 |
||
|
Soemaroeba 1" x 1" |
55 |
44 |
33 |
85,250 |
68,200 |
51,150 |
||
|
Other hardwoods 1" x 1" |
50 |
40 |
30 |
77,500 |
62,000 |
46,500 |
||
Source: Sawmills outside Paramaribo
Table 38 List prices (November 1998) of air dried mouldings and flooring made from various species
|
Species and |
Price per m |
Price per m3 |
|
dimension |
length (in Sf) |
(in Sf) |
|
Kopie mouldings 1" x 1" |
385 |
596,751 |
|
Soemaroeba mouldings 1" x 1" |
286 |
443,301 |
|
Mixed mouldings 1" x 1" |
275 |
426,251 |
|
Mixed flooring 1" x 1" |
350 |
542,501 |
Source: Sawmills outside Paramaribo
Export roundwood and product prices
Export roundwood and product prices for 1997 were obtained from LBB records of export volume and value (FOB). Table 39 shows the prices declared for all the main wood products exported from Suriname in 1997. The table also shows the minimum price for each product set by LBB for the purpose of assessing export levies. As was expected, the declared export prices are nearly all at or around the levels set by LBB. They should therefore, all be treated with a certain amount of suspicion.
Table 39 Declared prices (FOB) of roundwood and forest products exported from Suriname in 1997
|
Product |
Total volume |
Total value of |
Unit export value |
Minimum export price |
|
|
exported (in m3) |
exports (in million Sf) |
(in Sf/m3) |
(in US$/m3) |
set by LBB (in US$) |
|
|
Roundwood |
28,670 |
1,018 |
35,522 |
87 |
75 - 90 per m3 |
|
Hewn squares |
2,006 |
143 |
71,094 |
175 |
175 per m3 |
|
Flooring |
<1 |
<1 |
50,750 |
125 |
210 - 420 per m3 |
|
Mouldings |
18 |
4 |
203,147 |
500 |
210 - 420 per m3 |
|
Sawnwood |
6,490 |
681 |
104,887 |
258 |
90 - 350 per m3 |
|
Furniture |
25 |
16 |
633,847 |
1,561 |
350 - 700 per m3 |
|
Plywood |
4,823 |
776 |
160,924 |
396 |
275 - 325 per m3 |
|
Letterhout (snakewood) |
22 |
25 |
1,105,920 |
2,724 |
1.75 - 2.50 per kg |
|
Total |
42,054 |
2,662 |
|||
Source: LBB
Every company exporting roundwood declared export prices within the range of minimum export prices set by LBB. The three exporters of hewn squares were even more exact (i.e. they all declared export prices of US$ 175/m3). Only one company (Bruynzeel) exported flooring in 1997 and somehow managed to declare an export price of less than the LBB minimum. It is unclear whether they had to repatriate an amount of US$ and pay the export levy based on the minimum set by LBB or their declared export value. Bruynzeel was also the only company exporting mouldings and plywood in 1997. Because Bruynzeel is a state owned company, they have less incentive to underdeclare their export values and it is interesting to note that their declared export values for these products were both well above the minimum values set by LBB. The same is true of their export sawnwood values. Figure 1 shows the range of export sawnwood values declared by the 28 companies exporting sawnwood in 1997. Bruynzeel accounts for a significant proportion of the large volume exported at a declared value of over US$ 350/m3. In contrast, MUSA accounted for a significant share of the large volume in the US$ 150/m3 - US$ 199/m3 declared export value range.
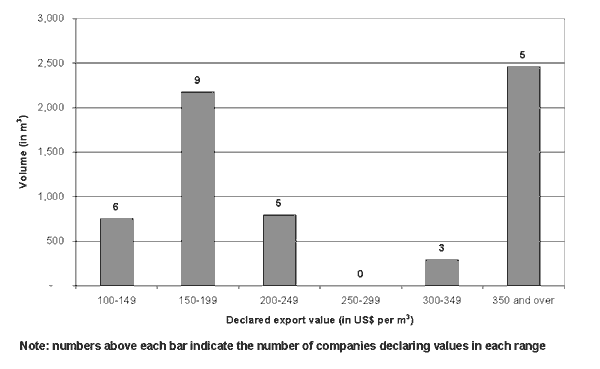 Figure 1 Volume of sawnwood exported at different declared export values
Source: LBB
Other quantitative information on the forest economy of Suriname
In addition to all the cost and price information described above, it is also useful to have some other basic quantitative information about the forestry sector in Suriname. For example, the biological productivity of the forest will affect the economics of forest harvesting and the number and location of sawmills will affect important variables such as local supply and demand conditions and transport costs. Macroeconomic information such as total production and trade in the sector is also necessary to calculate the total value of the sector to the economy and its potential contribution to government revenues. This section of the report presents other important quantitative information that is likely to affect the economics of the sector and, consequently, the calculation of economic rent.
Timber yields and cutting cycle
Three sources of information about timber yields and the appropriate length of the cutting cycle are available in Suriname: the results of the last (1974) national forest inventory (FAO, 1975); research into the CELOS silvicultural and harvesting system carried-out by a range of institutions over the last two decades (see, for example, von Bodegom, undated); and the results of discussions with forest managers during the course of this study.
The 1974 National Forest Inventory (1974 NFI) presents a little information about the potential harvest of commercial species that might be obtained in Suriname. It suggests that between 15 m3/ha and 20 m3/ha of commercial timber species may be obtained on average from the forests of Suriname, given the number of species that were considered as commercial at the time. It also notes however, that if all the species that were considered as potentially commercial were to be included in this calculation, the harvest volume would rise to around 50 m3/ha. The inventory doesn't say anything about management of the subsequent crop other than to note that regeneration of commercial species seems quite poor and that future silviculture should take this into account.
Research into the CELOS silvicultural and harvesting systems provides information about yield, harvesting intensity and presents a recommendation about the appropriate length of the cutting cycle. The research suggests that, without silvicultural treatment, growth of commercial species in the forests of Suriname may be as low as 0.2 m3/ha/year. With a series of refinements, it suggests that this yield can be increased to 2.0 m3/ha/year. The research also suggests that an appropriate level of harvesting intensity in Suriname might be 5 sph - 10 sph (which it equates to about 20 m3/ha - 30 m3/ha) on a cutting cycle of 25 years.
Discussions with forest managers during this study highlighted tw o problems with trying to estimate yield in the forests of Suriname. Firstly, many loggers are currently harvesting in areas that have been logged many times before (one logger quoted five previous companies, which had already worked in the area he was currently working in). This is partly due to the fact that, because of the uncertainty of tenure, very few logging operations are willing to invest in road building to open up new areas of forest, which might then be given to somebody else. The effect of this continuous re-logging is that the maximum volume many operators could probably cut in the areas they are currently working in is probably much lower than the volumes suggested by the 1974 NFI and CELOS research.
The second problem highlighted is that many loggers are currently actually choosing not to take all commercial species, but rather the small number of species that they currently market or have orders for (this partly explains why they are then able to go in and re-log previously cut areas again and again). It is therefore, somewhat difficult to estimate what a reasonable total commercial harvesting intensity in Suriname might actually be.
Only one logging operation visited (number 5) was fairly certain that they were working in an area which had not been logged before and appeared to be taking a wide range of commercial species (about 20). This operation reported that they were taking about 8 sph - 10 sph (roughly 16 m3/ha - 20 m3/ha) of commercial species greater than about 50 cm dbh.
Given the current uncertainty about growth and yield in the forests of Suriname, it would seem wise to take a conservative view about the appropriate harvesting intensity and length of cutting cycle which should be used in Suriname. It was agreed that, due to past logging activities, harvesting intensity might vary between 12 m3/ha and 20 m3/ha depending on how much the forest has been disturbed in the past. With respect to yield and the length of the cutting cycle however, it was much more difficult to reach a consensus. In terms of yield, it was felt that somewhere between the two figures quoted by CELOS research was probably about right and a figure of 0.8 m3/ha has been used in this study. Assuming that the harvesting intensity in undisturbed forest should be around 20 m3/ha, this would suggest a cutting cycle of 25 years (as recommended by the CELOS researchers). This seems a little short, but has also been used in this analysis. A summary of these assumptions made in order to estimate forestry production costs is given in Table 40.
Table 40 Assumptions about harvesting intensity, yield and cutting cycle used in the calculation of forestry production costs in Suriname
|
Variable |
Quality of forest |
|||
|
Low |
Medium |
High |
||
|
Harvesting intensity |
12 m3/ha |
16 m3/ha |
20 m3/ha |
|
|
Yield |
0.8 m3/ha/year |
0.8 m3/ha |
0.8 m3/ha |
|
|
Cutting cycle |
25 years |
25 years |
25 years |
|
Source: Assumptions made after discussions with forest managers and LBB staff
Sawmills and traders in forest products in Suriname
The last major survey of sawmills in Suriname was carried-out by LBB in 1990. Some of the information collected has been lost and the number and scale of mills operating in the sector had changed somewhat since then. In addition to the sawmills, a number of traders have also recently begun to operate in the forestry sector (mostly buying roundwood and forest products for export). An effort was made during this study therefore, to try to update the databases of sawmills and traders currently working in the forestry sector in Suriname. A revised estimate of the sawmilling and sawnwood trading sectors in Suriname is given in Table 41.
Table 41 Sawmill location, capacity, production and trade in Suriname (1990, partially updated to 1998)
|
Location |
Number |
Capacity and utilisation |
Product output and |
Approximate sales distribution |
||||||
|
of mills |
(m3 roundwood intake) |
recovery rate |
Domestic |
Export |
||||||
|
and traders |
Total |
Utilised |
% |
Total |
% |
m3 |
% |
m3 |
% |
|
|
Paramaribo |
32 |
263,650+ |
110,900+ |
50 |
38,100+ |
40 |
35,250+ |
93 |
2,850 |
7 |
|
Nickerie |
7 |
57,500 |
12,360+ |
24 |
6,300+ |
51 |
6,300 |
100 |
0 |
0 |
|
In forest |
7 |
n.a. |
n.a. |
n.a. |
n.a. |
n.a. |
n.a. |
n.a. |
13 |
n.a. |
|
Wanica |
6 |
n.a. |
n.a. |
n.a. |
n.a. |
n.a. |
n.a. |
n.a. |
0 |
0 |
|
Moengo |
6 |
10,000+ |
8,000+ |
80 |
2,400+ |
30 |
2,400+ |
100 |
0 |
0 |
|
Para |
3 |
50,000+ |
40,000+ |
80 |
20,000+ |
50 |
18,406+ |
92 |
1,594 |
8 |
|
Saramacca |
2 |
56,000 |
31,500 |
56 |
8,750+ |
42 |
8,711+ |
>99 |
39 |
<1 |
|
Patamakka |
2 |
n.a. |
n.a. |
n.a. |
n.a. |
n.a. |
n.a. |
n.a. |
0 |
0 |
|
Commewijne |
2 |
8,750+ |
n.a. |
n.a. |
n.a. |
n.a. |
n.a. |
n.a. |
0 |
0 |
|
Coppername |
1 |
8,000 |
n.a. |
n.a. |
n.a. |
n.a. |
n.a. |
n.a. |
31 |
n.a. |
|
All sawmills |
68 |
453,900+ |
202,760+ |
52 |
72,900+ |
43 |
68,373+ |
94 |
4,527 |
6 |
|
Traders (1997) |
24+ |
n.a. |
n.a. |
n.a. |
n.a. |
n.a. |
n.a. |
n.a. |
1,963 |
n.a. |
|
Total |
92+ |
453,900+ |
202,760+ |
52 |
72,900+ |
43 |
66,410+ |
91 |
6,490 |
9 |
|
Note: the above percentage utilisation, recovery and sales figures are based on only partial information. Thus, for example, the utilisation rates for Moengo, Para and Saramacca are based on the figures for one mill only in each location. Also capacity rates have only been calculated for mills where both total and utilised capacity is known. So, for example, the capacity of all seven mills in Nickerie is known, but production is only known for six of the mills, so these six mills were used to calculate percentage capacity utilisation. Therefore, 12,360 divided by 57,500 does not equal 24%. The same is true of product recovery rates and the distribution of sales. |
||||||||||
Source: 1990 sawmill survey (LBB), partially updated to 1998 by the author
The current status of sawmilling and sawnwood trading activities in Suriname is briefly described below.
Number of sawmills. It is estimated that there are currently 68 sawmills in Suriname. Five sawmills are small portable bandsaw mills (one in Paramaribo (Bosmij) and four in the forest) and the remainder are larger mills using stationary sawmilling equipment. At least five sawmills are not operating at the moment (possibly more). About half of the sawmills in Suriname are located in or near Paramaribo. Most of the others are also located close to the coast.
Sawmilling capacity. Information about sawmilling capacity is available for 35 sawmills (the 33 other sawmills are believed to be relatively small). Based on this information, the total sawmilling capacity in Suriname (assuming one shift working) is at least 455,000 m3 roundwood intake per year. By making a conservative estimate of the capacity of the 33 other sawmills, total capacity might be closer to 600,000 m3 roundwood intake per year. Over half of the known sawmilling capacity in Suriname is in Paramaribo. Other large mills or groups of mills are located in Nickerie, Moengo, Para and Saramacca. There is considerable variation in the size of sawmills operating in Suriname. The largest five mills account for about 45% of known sawmilling capacity, but the majority of sawmills in Suriname are in the range of 5,000 m3/year to 15,000 m3/year roundwood input. The distribution of sawmilling capacity by size of mill is shown in Figure 2 below.
